On coinpred.com this is the twenty-first piece in our indicator tutorial series. We are the Coinpred editorial team — the same group that maintains the guides and the author page. The companion SuperTrend tutorial asked what happens when you turn ATR into a trail that flips only when the close crosses it. One more tool still gets dropped onto the same chart and read as if it were the same switch: a trail that accelerates toward the extreme, and flips as soon as a high or a low tags it.
That is Parabolic SAR (Stop and Reverse). In many charting packages the defaults are a starting acceleration factor of 0.02, a step of 0.02, and a cap of 0.20, and those are the settings used throughout this article so the figures are checkable. The picture looks clean: dots under the close are an up-trail, dots above it are a down-trail. The usual mistake is not the formula. It is treating a close that comes back through the line as if the flip had been cancelled, or reading two or three reversals inside a tight range as “more sensitive, therefore more accurate.”
Every figure below is computed from Binance’s public BTCUSDT daily klines, in UTC. The acceleration factor follows the usual Wilder steps: add 0.02 on a new extreme, cap it at 0.20, and reset it to 0.02 after a flip. The main window is 2026-07-01 through 2026-11-21. 22 November was still trading when we drafted this, so that unfinished session is not treated as a complete day. You can download the same series and recompute. This is a reading guide, not a trading system, and it is not investment advice.
1. It trails an extreme, and it flips on the wick
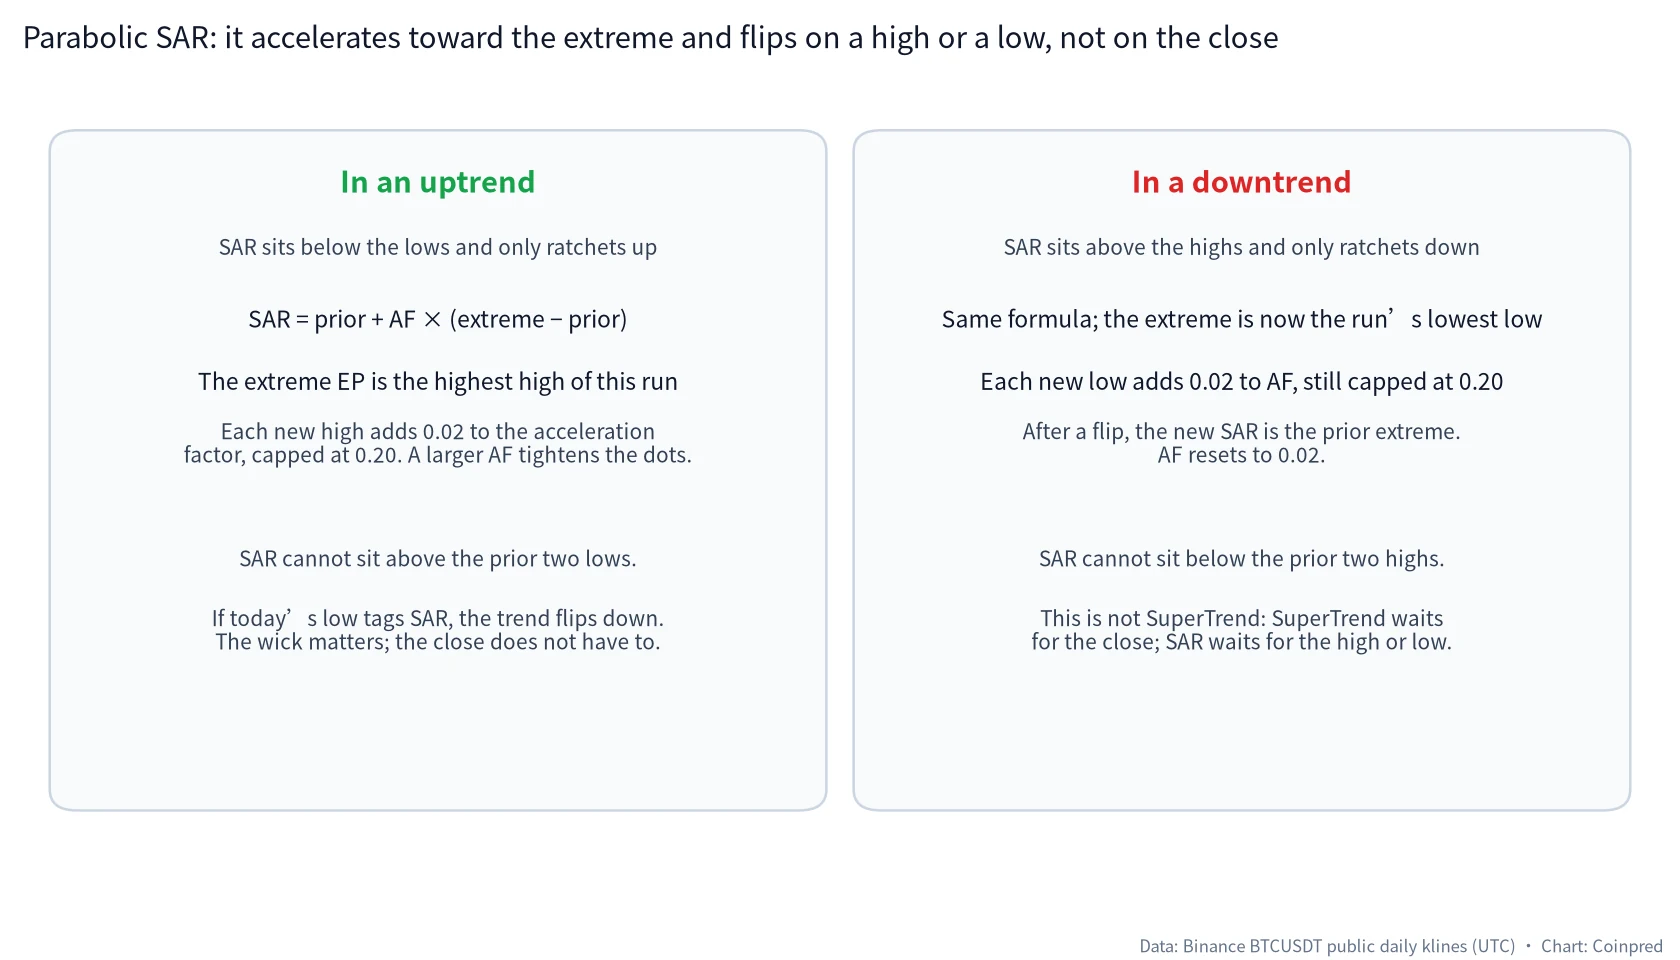
SAR is not a moving average, and it is not an ATR band. It trails the extreme price of the current run. In an uptrend that extreme is the highest high of the run; in a downtrend it is the lowest low. The next dot is the previous dot, pulled a fraction of the way toward that extreme:
SAR = prior SAR + AF × (extreme − prior SAR)
AF is the acceleration factor. It starts at 0.02 when a new trend begins. Each new high in an uptrend, or each new low in a downtrend, adds 0.02, up to 0.20. A larger AF pulls the dots in faster. After a flip, the new SAR is placed on the extreme of the run that just ended, and AF starts again at 0.02.
There are also two clamps. In an uptrend the computed SAR cannot sit above the prior two lows; in a downtrend it cannot sit below the prior two highs. That keeps the dot from being drawn straight through the bars that have just printed.
The difference that matters most, relative to SuperTrend, is the trigger: SAR flips when the day’s low or high tags the line. It does not wait for the close. A wick through the line, followed by a close back on the other side, still changes the trend. 24 July, 1 September and 24 October will make that concrete.
2. Start with the whole window from July to November
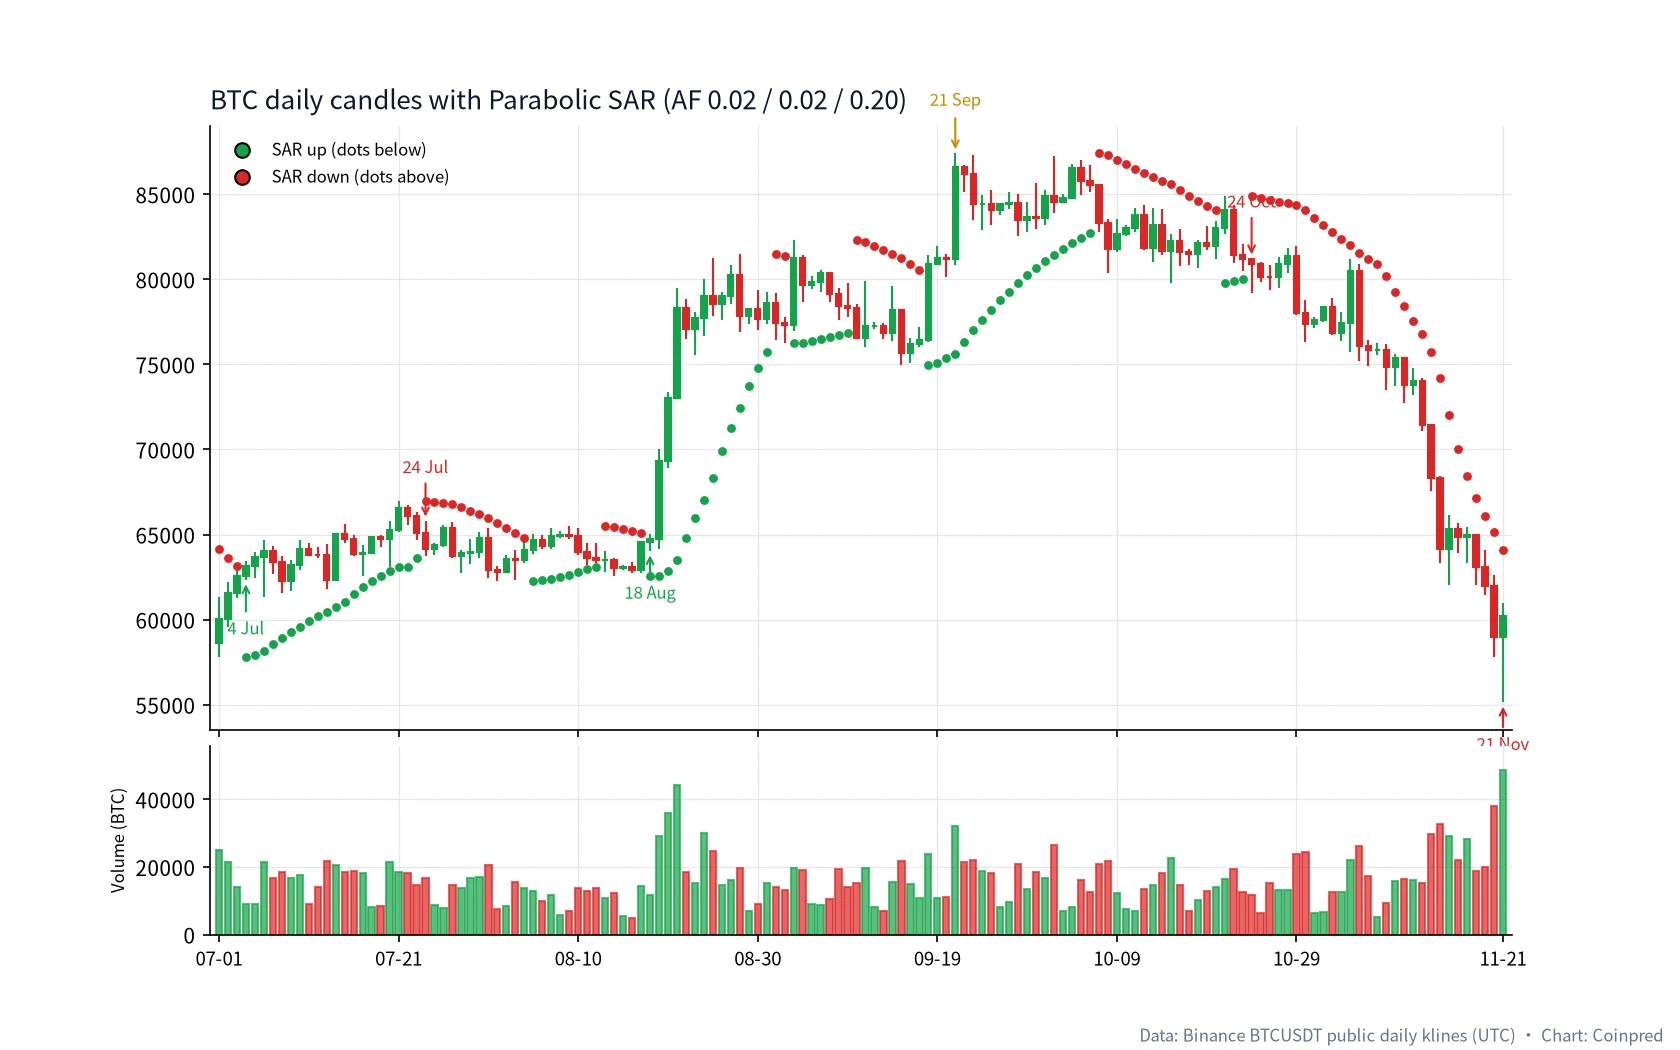
A few spines are worth pinning down before the close-ups.
On 4 July, SAR flipped from down to up and stayed up for 20 sessions, until 24 July. In the mid-August compression it changed sides on 5 August, 13 August and 18 August. In the run that followed 18 August, the acceleration factor rose from 0.02 to 0.14 and the dots visibly tightened. Early September opened with a down flip, a flip back up two days later, then another down flip on 10 September and an up flip on 18 September. The up-run that started on 18 September lasted 19 sessions and included the window high of 87,395.67 on 21 September. After the 7 October down flip, 21 October produced an up-flip that lasted only three days. From 24 October the downtrend ran through the end of the window on 21 November — 29 sessions — and the acceleration factor reached its 0.20 cap on 14 November.
In the same stretch, SuperTrend only flipped up on 21 July and down on 29 October, with almost no back-and-forth in between. The two tools are not asking the same question: one waits for the close, the other waits for a wick. Their flip dates should not be used to corroborate each other.
3. July: the high prints first, and the low three days later does the flipping
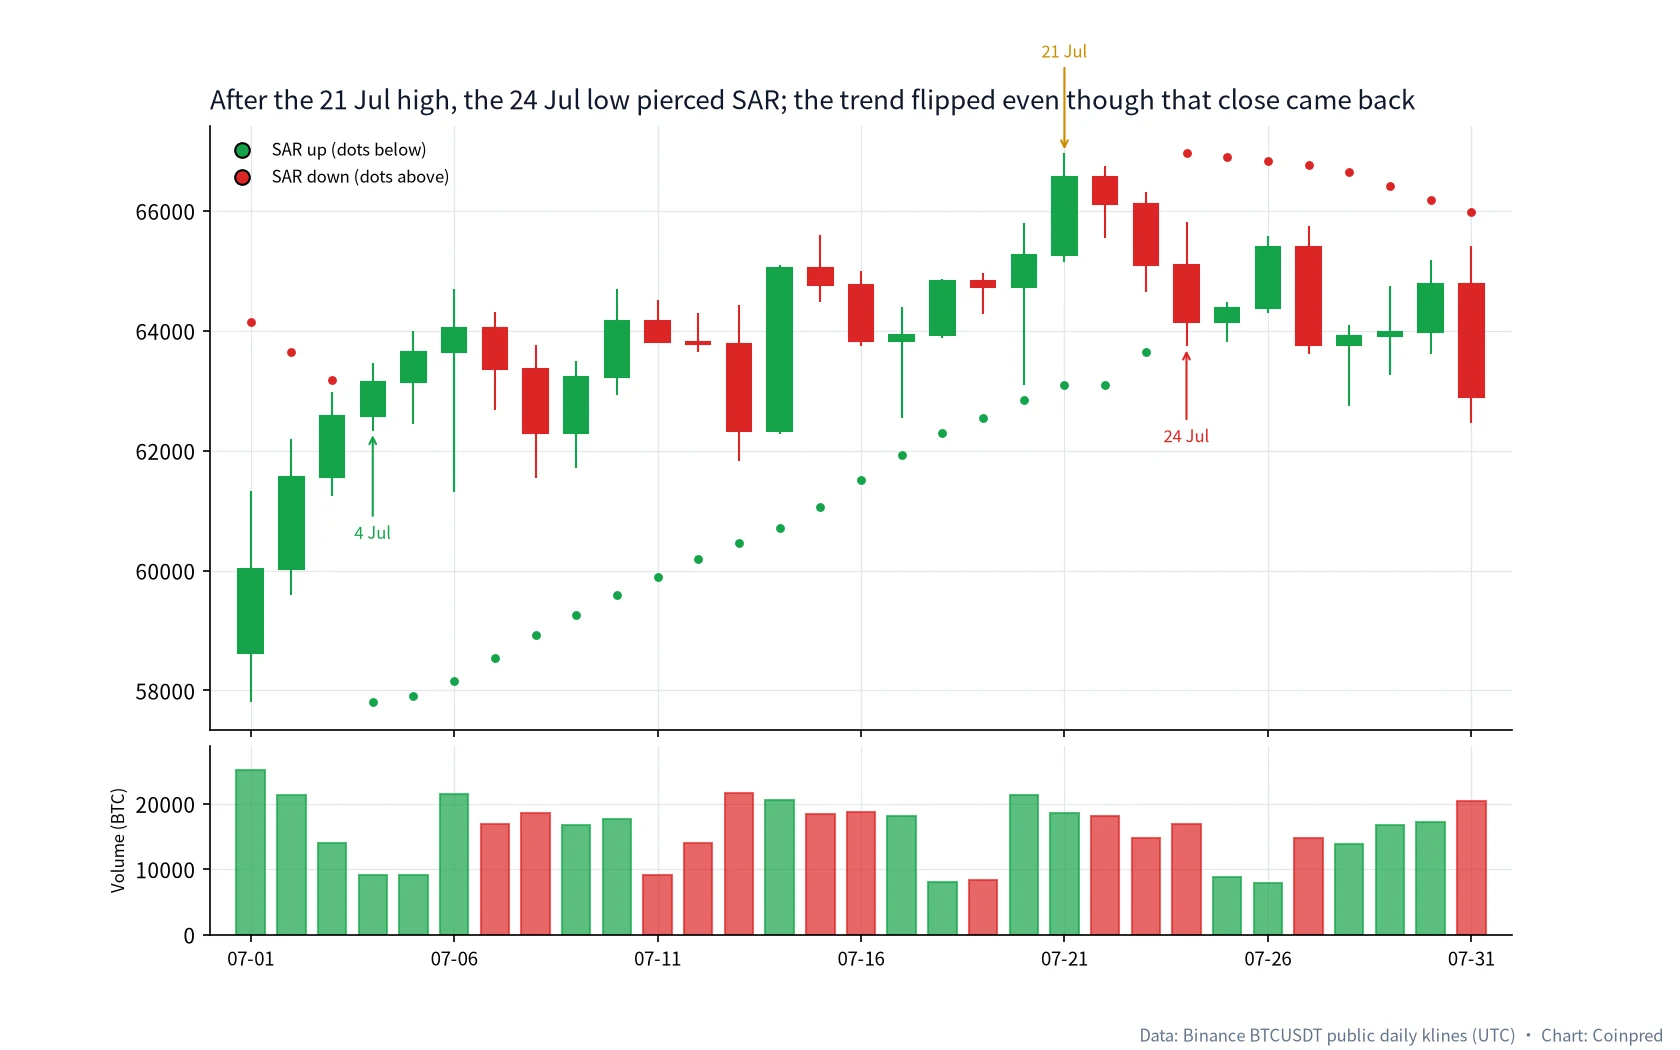
July is not about whether SAR “took you out on the high.” It is about whether the flip was decided by the close or by the wick.
| Date (UTC) | Open | High | Low | Close | Change | SAR | Side | AF | Volume |
|---|---|---|---|---|---|---|---|---|---|
| 07-04 | 62,583.26 | 63,461.99 | 62,328.24 | 63,144.01 | +0.90% | 57,800.19 | Up | 0.02 | 9,140 |
| 07-21 | 65,255.51 | 66,956.15 | 65,148.75 | 66,556.16 | +1.99% | 63,100.00 | Up | 0.14 | 18,618 |
| 07-22 | 66,556.15 | 66,739.89 | 65,553.67 | 66,114.49 | −0.66% | 63,100.00 | Up | 0.14 | 18,075 |
| 07-23 | 66,114.50 | 66,313.14 | 64,650.00 | 65,098.97 | −1.54% | 63,639.86 | Up | 0.14 | 14,698 |
| 07-24 | 65,098.98 | 65,808.59 | 63,739.75 | 64,139.99 | −1.47% | 66,956.15 | Down | 0.02 | 16,821 |
The 21 July high of 66,956.15 is the high of the July stretch and became the extreme of that up-run. The close that day was 66,556.16, SAR was still at 63,100.00, and AF had already reached 0.14. The dots had tightened, but they still sat about 3,856 below the high. The line is not obliged to reverse on the day of the peak.
The actual reversal is 24 July. Projecting the prior dot forward, the pre-flip SAR comes out near 64,104.14. The session low of 63,739.75 undercut that line, so the trend flipped down; the new SAR was placed on the prior extreme of 66,956.15, and AF reset to 0.02. The detail worth a sentence of its own is the close: 64,139.99, which had already come back above the pre-flip line. If you brought SuperTrend’s close-only rule across, this bar would not look confirmed. For SAR, the wick was enough.
That same close, 64,139.99, was still inside the Keltner Channel, and it had not met SuperTrend’s flip condition either. Writing 24 July as “every trailing tool flipped short together” would not be true.
4. Mid-August: the channel is still tight, and SAR has already changed sides three times
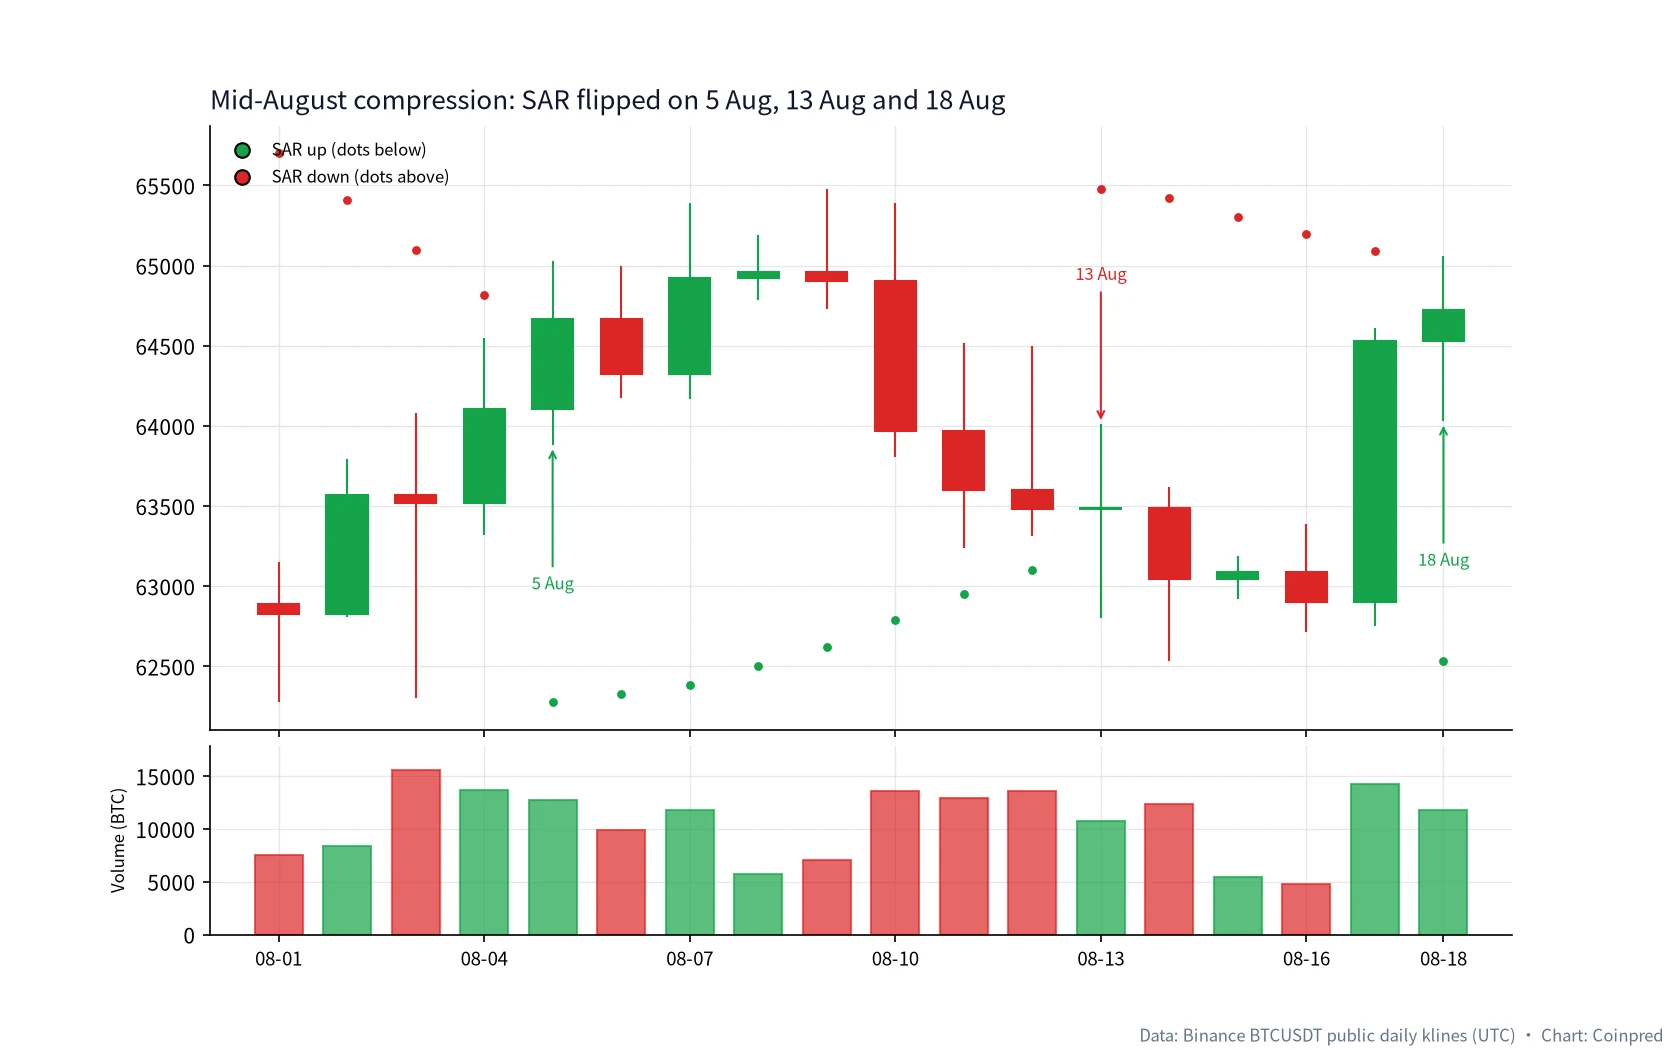
The first half of August is the narrowest stretch of true range in this window. In the companion Keltner Channel tutorial, the channel width on 16 August is only about 4,451, with ATR(10) near 1,113. SAR does not become “more accurate” in a place like that. It simply becomes easier for a wick to tag.
| Date (UTC) | Close | Change | SAR | Side | AF | Note |
|---|---|---|---|---|---|---|
| 08-05 | 64,665.23 | +0.87% | 62,275.00 | Up | 0.02 | Flip to up; the new dot sits on the prior low of 62,275.00 |
| 08-13 | 63,490.86 | +0.02% | 65,474.46 | Down | 0.02 | Flip back down eight days later, on an almost flat close |
| 08-15 | 63,086.01 | +0.07% | 65,305.59 | Down | 0.04 | Volume only 5,405; range still shrinking |
| 08-16 | 62,900.00 | −0.29% | 65,194.77 | Down | 0.04 | Around the narrowest Keltner width in the window |
| 08-18 | 64,725.42 | +0.30% | 62,535.24 | Up | 0.02 | Flip to up again, just before the volume expansion |
On 13 August the close was only 0.02% above the prior day, and the trend had already flipped down. On 18 August the close was up just 0.30%, and it flipped back. If you turned each of those three flips into an entry or an exit, you would have been chopped around 63,000 before the later breakout had even started. That is not a math error. It is what SAR does in a tight range.
Our own reading is to check first whether ATR and channel width have contracted. If they have, we treat a cluster of flips as “the dots are easy to tag,” not as a settled direction.
5. Late August: the acceleration factor rises, and the dots finally tighten
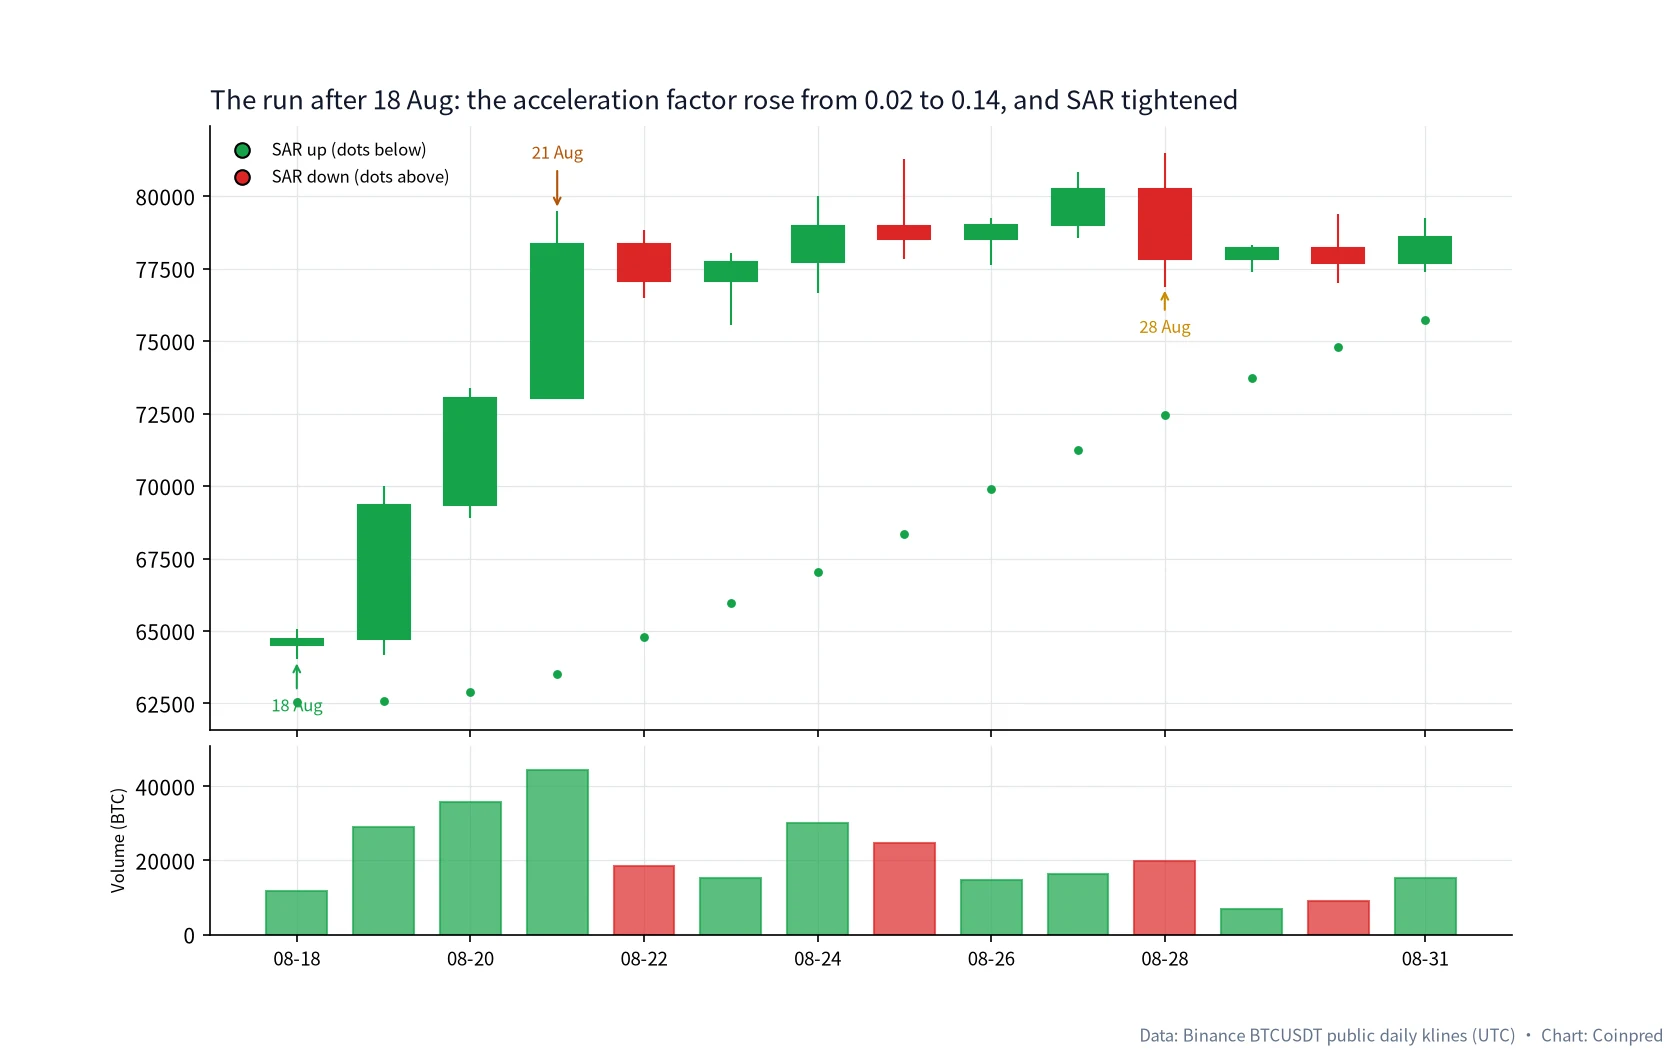
After the 18 August up-flip, the market is no longer chopping in a narrow band. On 19 August the close was 69,334.79, up 7.12%, on volume of 29,054; on 21 August the close was 78,338.03, up another 7.28%, on volume of 44,340. Those three sessions lifted the price out of the prior compression.
| Date (UTC) | Close | High | SAR | AF | Extreme | Volume |
|---|---|---|---|---|---|---|
| 08-18 | 64,725.42 | 65,058.81 | 62,535.24 | 0.02 | 65,058.81 | 11,790 |
| 08-19 | 69,334.79 | 70,000.00 | 62,585.71 | 0.04 | 70,000.00 | 29,054 |
| 08-21 | 78,338.03 | 79,500.00 | 63,513.35 | 0.08 | 79,500.00 | 44,340 |
| 08-25 | 78,539.14 | 81,272.62 | 68,346.25 | 0.12 | 81,272.62 | 24,773 |
| 08-28 | 77,845.87 | 81,478.87 | 72,463.66 | 0.14 | 81,478.87 | 19,756 |
| 08-31 | 78,581.29 | 79,250.00 | 75,744.69 | 0.14 | 81,478.87 | 15,304 |
Look at 28 August. The high of 81,478.87 became the extreme of the run and AF reached 0.14, but the close had already fallen back to 77,845.87, down 3.00%. SAR was still in an uptrend that day, with the dot at 72,463.66, and the close remained above it. A larger acceleration factor only means the dots have tightened. It does not mean the line must flip on the day of the high. The side changes when a later wick actually tags it.
In this stretch SAR did what it is built to do: once the market had left the compression, the dots followed the new highs higher. That later run should not be used to excuse the three mid-August flips, and those flips should not be used to dismiss the run.
6. September: a two-day whip, and only then the window high
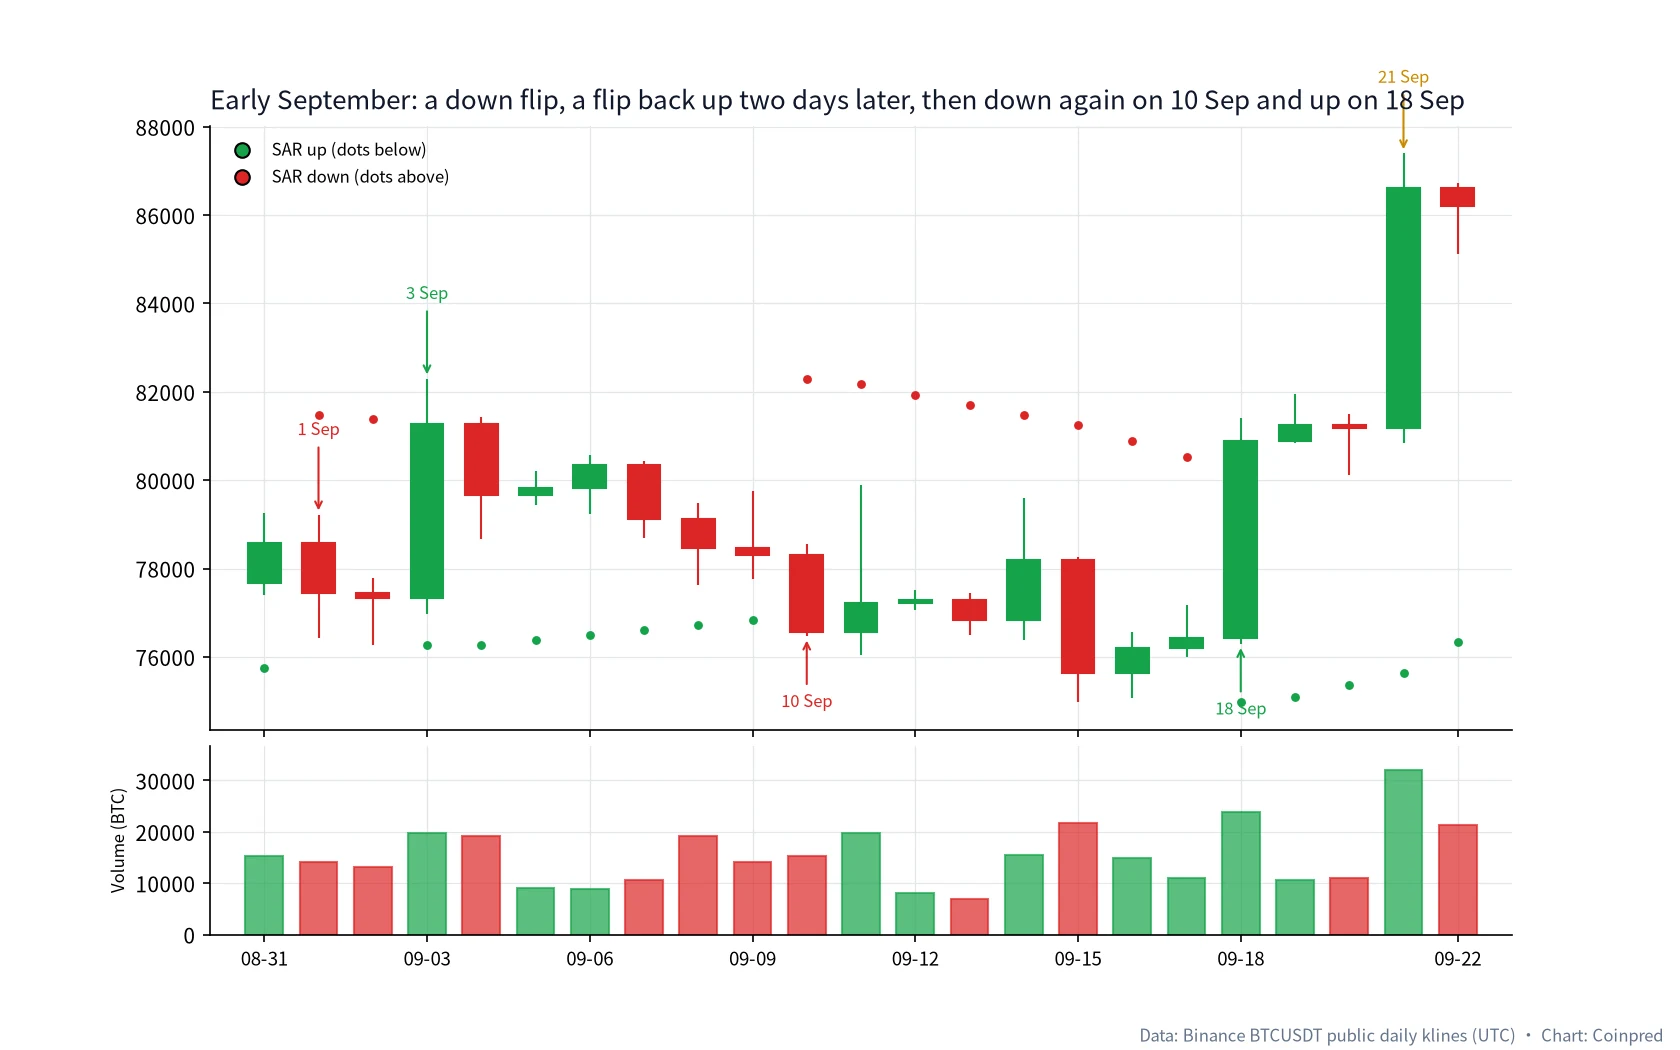
The first half of September puts a wick flip and a short whip on the same page.
| Date (UTC) | Open | High | Low | Close | Change | SAR | Side | AF | Volume |
|---|---|---|---|---|---|---|---|---|---|
| 09-01 | 78,581.30 | 79,220.61 | 76,420.00 | 77,439.00 | −1.45% | 81,478.87 | Down | 0.02 | 14,131 |
| 09-02 | 77,439.01 | 77,792.00 | 76,264.00 | 77,340.01 | −0.13% | 81,377.69 | Down | 0.04 | 13,071 |
| 09-03 | 77,340.01 | 82,300.00 | 76,968.00 | 81,270.37 | +5.08% | 76,264.00 | Up | 0.02 | 19,806 |
| 09-10 | 78,306.43 | 78,564.39 | 76,464.00 | 76,568.72 | −2.22% | 82,300.00 | Down | 0.02 | 15,320 |
| 09-15 | 78,189.20 | 78,250.46 | 74,967.97 | 75,644.48 | −3.25% | 81,258.77 | Down | 0.06 | 21,683 |
| 09-18 | 76,417.01 | 81,400.00 | 76,296.00 | 80,883.87 | +5.85% | 74,967.97 | Up | 0.02 | 23,908 |
| 09-21 | 81,178.01 | 87,395.67 | 80,850.22 | 86,620.00 | +6.70% | 75,633.99 | Up | 0.06 | 31,963 |
1 September is another wick flip. The pre-flip SAR comes out near 76,547.48. The session low of 76,420.00 undercut it, so the trend flipped down; the close of 77,439.00 had already come back above that pre-flip line. Two days later, 3 September closed up 5.08%, the high of 82,300.00 tagged the down-SAR, and the side flipped back. The downtrend had lasted two sessions.
SAR flipped down again on 10 September. On 15 September the low reached 74,967.97 and the close was 75,644.48. If “a down flip means you must be out” were a hard rule, you would have left six days before the window high. What actually followed: 18 September closed up 5.85%, SAR flipped up again, and the new dot sat on the 15 September low of 74,967.97. Three days later, on 21 September, the high printed 87,395.67, the close was 86,620.00, and volume was 31,963. That new up-run lasted through 6 October, 19 sessions in all.
Those September whips should not be rewritten by the later high, and the 18 September run should not be dismissed because of the 1 September flip. They only say that near a high, SAR can still be tagged once by a wick before the next leg.
7. October and November: a three-day up-flip, then a persistent downtrend
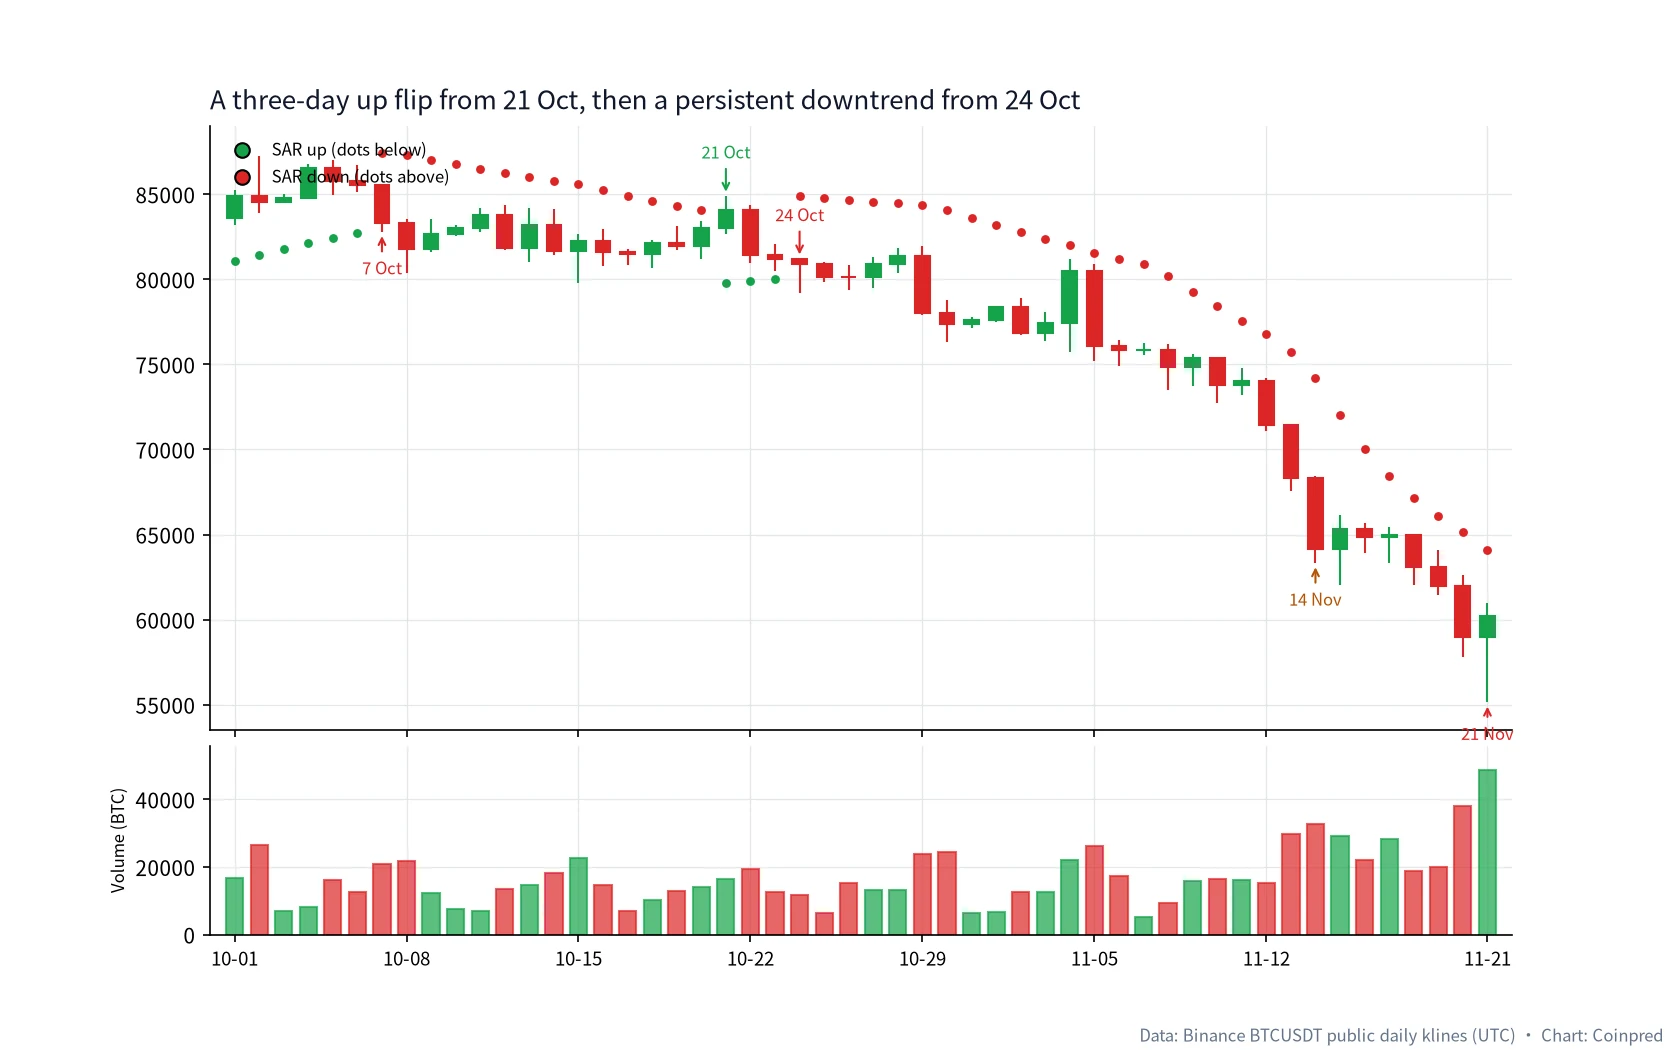
On 7 October the close was 83,321.81, and the low of 82,787.25 tagged the up-SAR that was still sitting near 87,395.67, so the trend flipped down. The new dot was placed on the 21 September window high. That was also a day when price came back to the 20-day exponential average — a moving-average story, which belongs in the companion note.
The sequence that deserves a slower look is 21–24 October.
| Date (UTC) | Open | High | Low | Close | Change | SAR | Side | AF | Volume |
|---|---|---|---|---|---|---|---|---|---|
| 10-20 | 81,938.39 | 83,439.00 | 81,200.00 | 83,028.15 | +1.33% | 84,046.38 | Down | 0.06 | 13,955 |
| 10-21 | 83,028.14 | 84,898.00 | 82,635.32 | 84,093.42 | +1.28% | 79,800.00 | Up | 0.02 | 16,545 |
| 10-22 | 84,093.42 | 84,377.21 | 80,939.54 | 81,416.09 | −3.18% | 79,901.96 | Up | 0.02 | 19,476 |
| 10-23 | 81,416.09 | 82,060.88 | 80,513.00 | 81,189.43 | −0.28% | 80,001.88 | Up | 0.02 | 12,469 |
| 10-24 | 81,189.44 | 81,213.64 | 79,220.74 | 80,888.16 | −0.37% | 84,898.00 | Down | 0.02 | 11,720 |
| 10-29 | 81,343.51 | 81,971.00 | 77,910.00 | 77,991.89 | −4.12% | 84,352.53 | Down | 0.04 | 23,832 |
| 11-14 | 68,314.01 | 68,446.21 | 63,320.00 | 64,150.00 | −6.10% | 74,217.49 | Down | 0.20 | 32,675 |
| 11-21 | 58,951.51 | 60,996.00 | 55,130.00 | 60,215.77 | +2.14% | 64,080.80 | Down | 0.20 | 48,558 |
On 21 October the high of 84,898.00 tagged the down-SAR and the trend flipped up, with a new dot at 79,800.00. It lasted three days. 22 October already closed down 3.18%. On 24 October the pre-flip SAR comes out near 80,099.80, and the session low of 79,220.74 pierced it; the close of 80,888.16 was once again back above the pre-flip line, and the side still changed. The new down-SAR was placed at 84,898.00 — the extreme of that short-lived up-flip three days earlier.
The downtrend was not interrupted after that. On 29 October the close fell 4.12% on volume of 23,832, and SuperTrend only completed its own down flip that same day — another case of “something changed on the same date,” not “both tools started the downtrend on the same date.” On 14 November the close was 64,150.00, down 6.10%, on volume of 32,675; AF touched 0.20 for the first time, and SAR at 74,217.49 sat about 10,067 above the close. On 21 November the low reached 55,130.00, the close was 60,215.77, and volume was 48,558; the dot was still at 64,080.80, with AF parked at the cap. From 24 October through the end of the window, that down-run lasted 29 sessions.
AF at 0.20 only means the dots have used the full acceleration and are tight. It is not a signal that the decline is over, and it is not a reason to add. On 21 November the close was still below the line, and that is where the window stops.
8. A five-step habit of our own
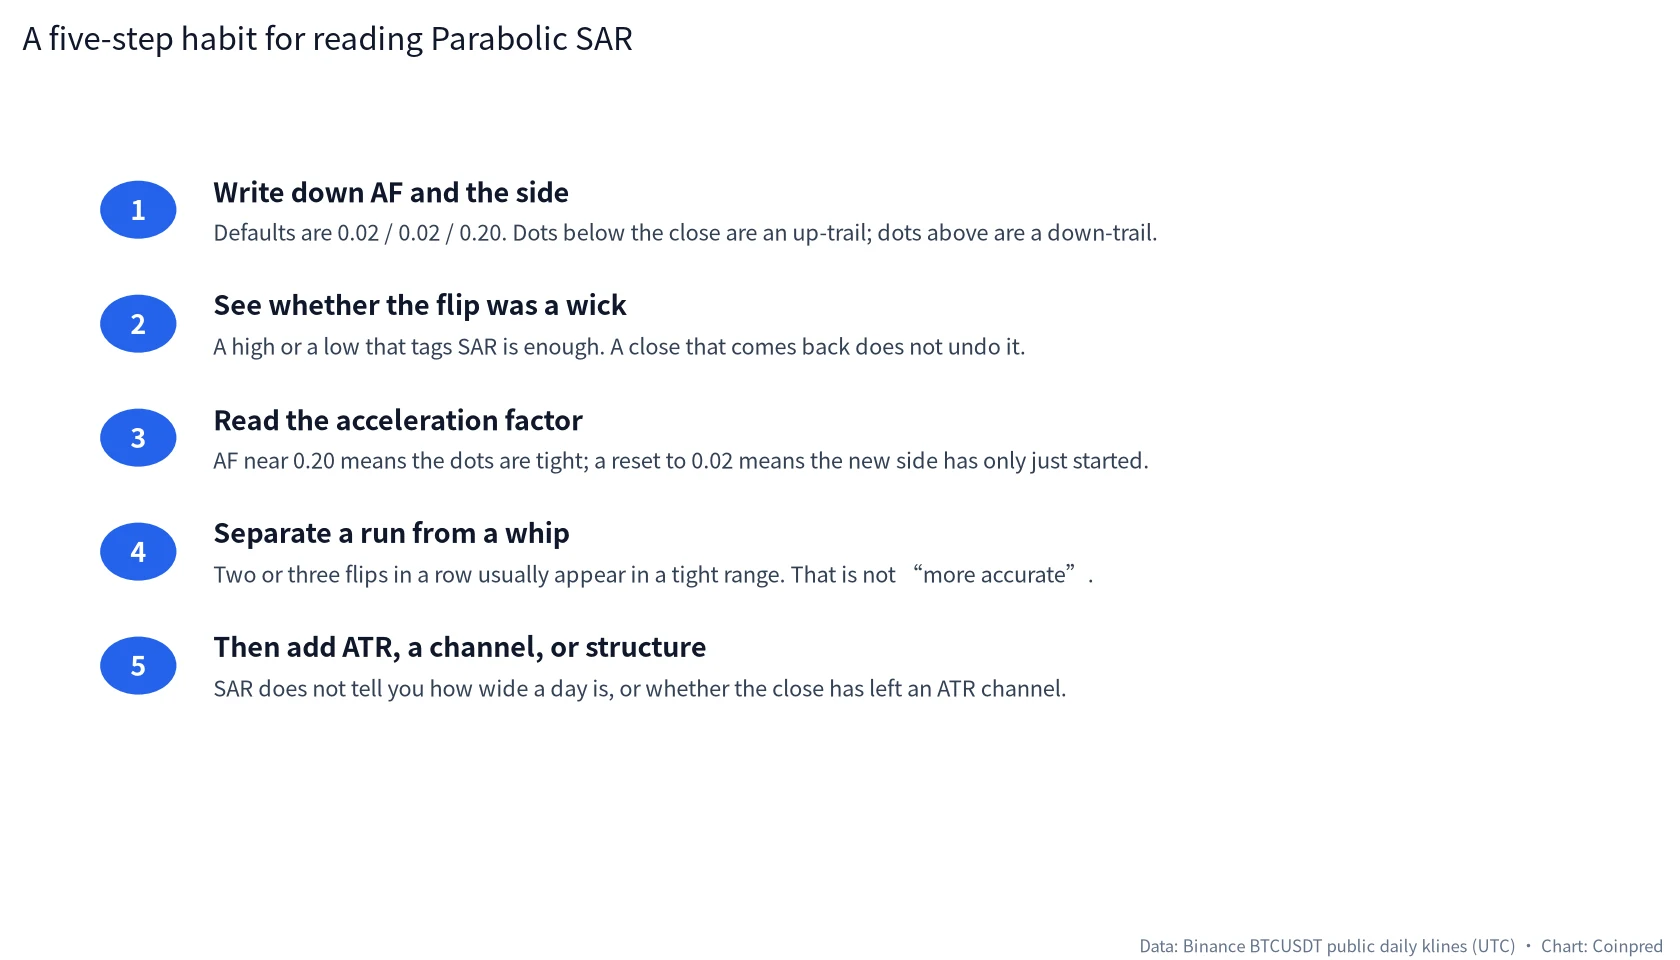
When we read Parabolic SAR on a daily chart, we usually go in this order, rather than starting with “should I trade”:
- Write down the settings and the side. The defaults are 0.02 / 0.02 / 0.20. Dots below the close are an up-trail; dots above it are a down-trail. A different acceleration set is a different series of dots.
- See whether the flip was a wick or a close. On 24 July, 1 September and 24 October, the close came back above the pre-flip line, and the trend still changed. Do not overwrite SAR with SuperTrend’s close-only rule.
- Read the acceleration factor. AF near 0.20 means the dots are already tight, as they were after 14 November; a reset to 0.02 only means the new side has just started, as on 24 October itself.
- Separate a run from a whip. 5–18 August, 1–3 September, and 21–24 October are short flips. The 14 sessions after 18 August, and the 29 sessions after 24 October, are the sustained runs.
- Then add ATR, a channel, or structure. ATR tells you how wide a typical day is, Keltner Channels tell you whether the close has left that width, and support and resistance tell you where you are. SAR does not replace them.
If we keep only one sentence: ask first whether the flip was a wick through the line, then whether it printed inside a compression or in a move that had already left one, and only then decide whether today’s reversal is worth writing down on its own.
9. What we will not do with Parabolic SAR
- Treat a close that comes back after a wick tag as if the flip had been cancelled. 24 July and 24 October both argue against that rewrite.
- Execute two or three flips in a row as entries and exits inside a range where ATR has already contracted, without first looking at how narrow the channel is.
- Call SAR “wrong” because SuperTrend flips less often, or call SuperTrend “too slow to be useful” because SAR flipped down earlier. Their confirmation rules are different by design.
- Write AF reaching 0.20 as the end of a trend, or as a reason to add. After 14 November, when the cap was hit, the price was still moving lower.
- Copy a daily flip date onto a 15-minute decision, or the other way around.
- Turn SAR by itself into a trading system. You can write rules, but you then have to write down whether you wait for the close, how you handle a tight range, and how spot differs from perpetual futures. We do not do that here.
FAQ
Can Parabolic SAR and SuperTrend confirm each other?
They can be compared. They cannot confirm each other. SuperTrend uses an ATR width and flips only on a close; SAR accelerates toward an extreme and flips when a high or a low tags the line. When SuperTrend flipped up on 21 July, SAR had already been in an uptrend for more than two weeks. When SAR entered its persistent downtrend on 24 October, SuperTrend did not flip down until 29 October. A change on the same date only means both questions happened to be touched that day. It is not a mutual guarantee.
Why does the side sometimes change even though the close is back on the other side of the line?
Because the trigger is the high or the low, not the close. On 24 July the close of 64,139.99 was above the pre-flip line near 64,104.14; on 24 October the close of 80,888.16 was above the pre-flip line near 80,099.80. For SAR, those closes “coming back” do not undo a tag that has already happened.
Can I change the 0.02 / 0.02 / 0.20 acceleration set?
Yes. A higher start, a larger step, or a lower cap will pull the dots in faster and produce more flips. No exchange requires bitcoin to use this set. We use the common default so you can recompute the same numbers. Do not retune halfway through to make 1 September look cleaner.
If SAR flips several times in mid-August, should I just turn it off?
You do not have to turn it off, but you should change how you read it. Check first whether ATR and the Keltner Channel have clearly contracted. When the channel is already down around 4,500, being tagged back and forth is what you should expect. We write those flips down. We do not treat them as a settled direction.
Does this also apply to a 15-minute or 1-hour BTC chart?
The formula can be moved. The conclusions and the dates cannot. On a 1-hour chart, the extremes and the acceleration are computed from hourly bars, not from the 24 July daily candle. Our own order is still daily first: write down the daily flips and the AF, then decide whether to drop to a lower timeframe.
Can I build a trading system from Parabolic SAR alone?
You can write one. You then have to define whether you wait for the close, whether you pause in a tight range, and how the tool sits next to candlesticks and structure. On this stretch of BTC dailies, taking every flip as a reverse entry would have chopped you in mid-August and early September; ignoring a wick because the close came back would have skipped 24 July and 24 October. That is the failure mode. This article is for study and review only.
Can SAR tell me which event contract to pick, or which way JEV will lean?
Only indirectly. Event contracts have their own expiry, settlement index and payout rules; if that is the product you are studying, start with the BTC event contract note. JEV is a separate five-bucket directional reading, and its confidence is not a win rate. Parabolic SAR can be market context we pass to a model, and it can be context we use when we read a chart ourselves. It is not a settlement forecast.
Data and references
- Candles: Binance’s public API, BTCUSDT daily klines, UTC, main window 2026-07-01 through 2026-11-21. 22 November was still an incomplete session when this was written, so it is not treated as a full day. Volume is the base BTC quantity returned by that endpoint.
- Indicator: Parabolic SAR, Wilder method, starting AF 0.02, step 0.02, cap 0.20. The extreme in an uptrend is the run’s highest high; in a downtrend it is the run’s lowest low. The clamps are the prior two lows and the prior two highs. After a flip, the new SAR equals the prior extreme and AF resets to 0.02.
- Parabolic SAR was introduced by J. Welles Wilder in New Concepts in Technical Trading Systems (1978) and is commonly used as a trailing stop and a side marker. The implementation above matches a common charting default and is not an exchange’s internal specification.
- Adjacent tutorials already in this series: candlesticks, support and resistance, moving averages, RSI, MACD, Bollinger Bands, volume, Fibonacci, Stochastic, ATR, ADX, Ichimoku, VWAP, SuperTrend, and the companion Keltner Channels.
All charts were drawn by Coinpred from the public data above. If a date or a figure does not match your own recomputation, write to us through the author page or the contact listed there (@constcaoq). Trading involves risk; please judge independently and size positions with care. This article is for study only and is not investment advice. Coinpred does not provide services to users in mainland China.