On coinpred.com this is the nineteenth piece in our indicator tutorial series. We are the Coinpred editorial team — the same group that maintains the guides and the author page. After the volume, moving average and ATR notes, one common question was still sitting on the desk: volume tells you how much participated, a moving average tells you where the close sits relative to a simple mean, and ATR tells you how wide a typical day is. None of them answers a slightly different question — since a chosen moment, where is the volume-weighted average price?
Volume Weighted Average Price (VWAP) is built for that question. It looks like a moving average, but it is not “the closes averaged one more time.” It weights each bar’s typical price by that bar’s volume. People who search for “how to use VWAP” or “should I short if price loses VWAP” usually get the formula right and the job description wrong. They treat a session VWAP and an anchored VWAP as the same line, or they treat every reclaim or break as an order ticket.
Every figure below is computed from Binance’s public BTCUSDT daily klines, in UTC. Typical price is (high + low + close) ÷ 3, and volume is the BTC quantity returned by that endpoint. The main window is 2026-07-01 through 2026-11-20. 21 November was still trading when we drafted this, so that unfinished session is not treated as a complete day. The three main anchored VWAP lines start on 1 July, 19 August and 21 September. When a longer view helps, we also show the year-to-date line anchored on 1 January 2026. You can download the same series and recompute. This is a reading guide, not a trading system, and it is not investment advice.
1. Session VWAP and anchored VWAP are not the same line
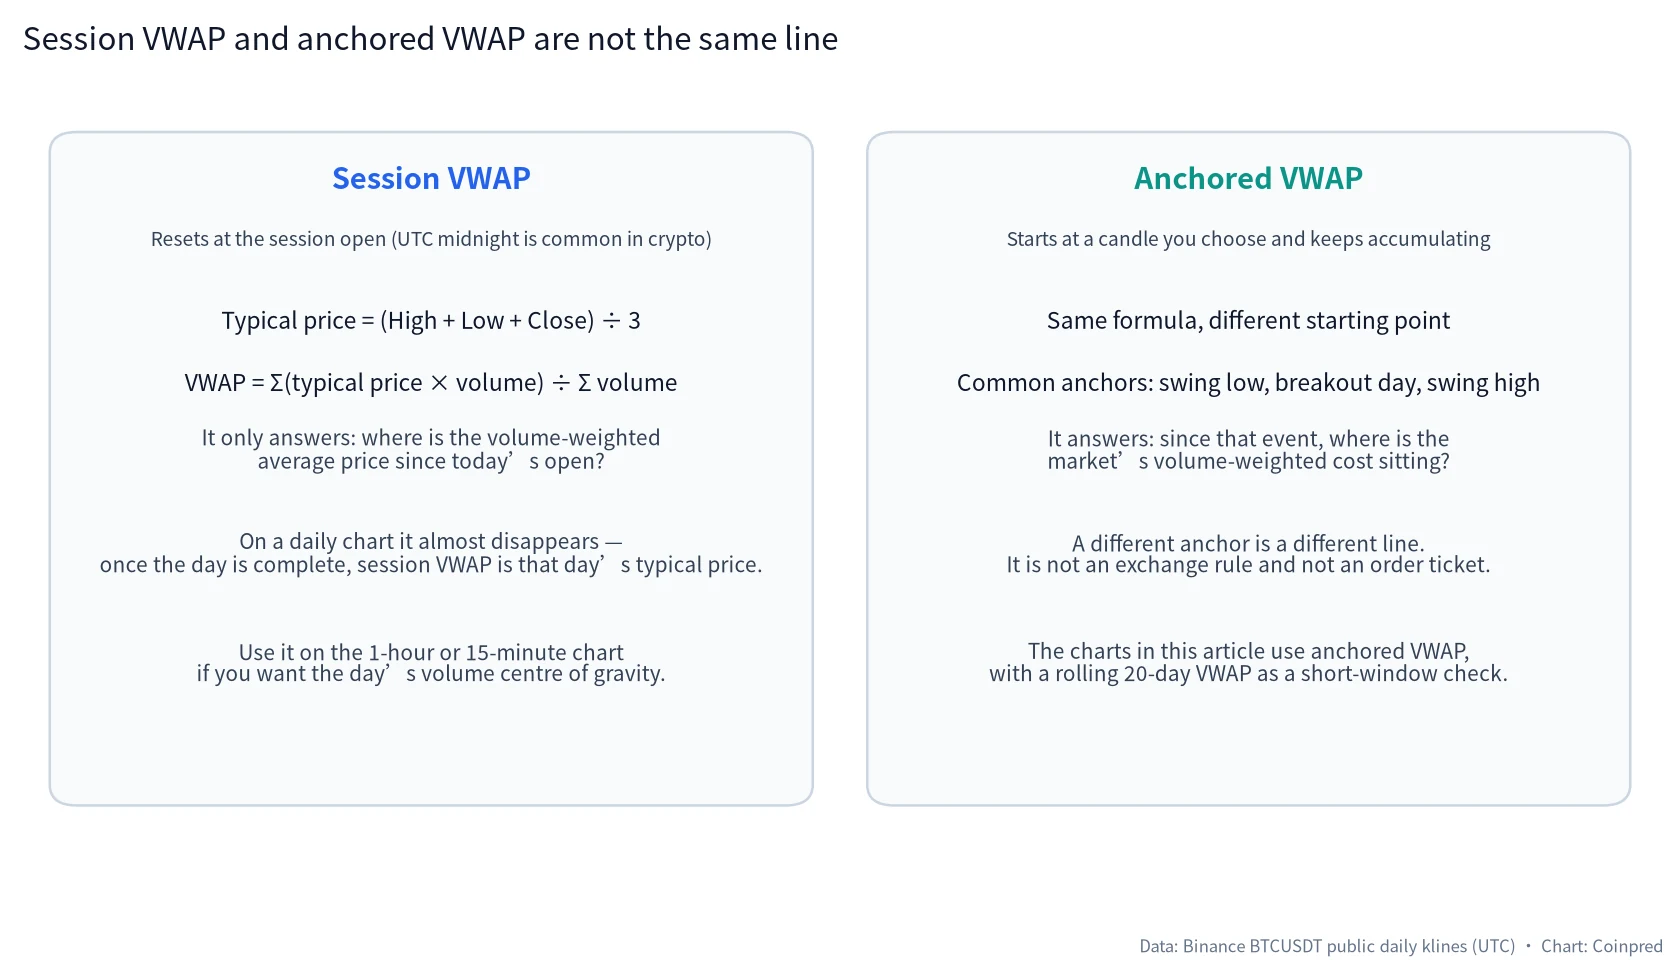
Start with the formula. The typical price of a bar is:
Typical price = (high + low + close) ÷ 3
Then:
VWAP = Σ(typical price × volume) ÷ Σ volume
The only real disagreement is where that sum starts, and where it stops.
- Session VWAP resets at the start of each session. In equities that is usually the cash-market open. Crypto trades around the clock, so the common practical cut is 00:00 UTC. It only answers: since today’s open, where is the volume centre of gravity?
- Anchored VWAP starts at a candle you choose and keeps accumulating through today. The anchor can be a swing low, a volume breakout, or a swing high. A different anchor is a different line.
On a daily chart, session VWAP almost disappears: once the day is complete, that session’s VWAP is simply that day’s typical price. If you care about where today’s volume has traded, the 1-hour or 15-minute chart is the better place to look. The main charts in this article use anchored VWAP, because on the daily it can keep a running volume-weighted cost after an event. A rolling 20-day VWAP appears as a short-window check. It is not an exchange rule either.
This is also not a relabelled simple moving average. A moving average usually averages closes, and it usually weights each day the same. VWAP lets the heavier days pull the line harder. The three large, high-volume days from 19 to 21 August lift the anchored VWAP that starts on 19 August quite visibly. That is the formula doing its job, not a charting effect.
2. First, the full picture from July to November
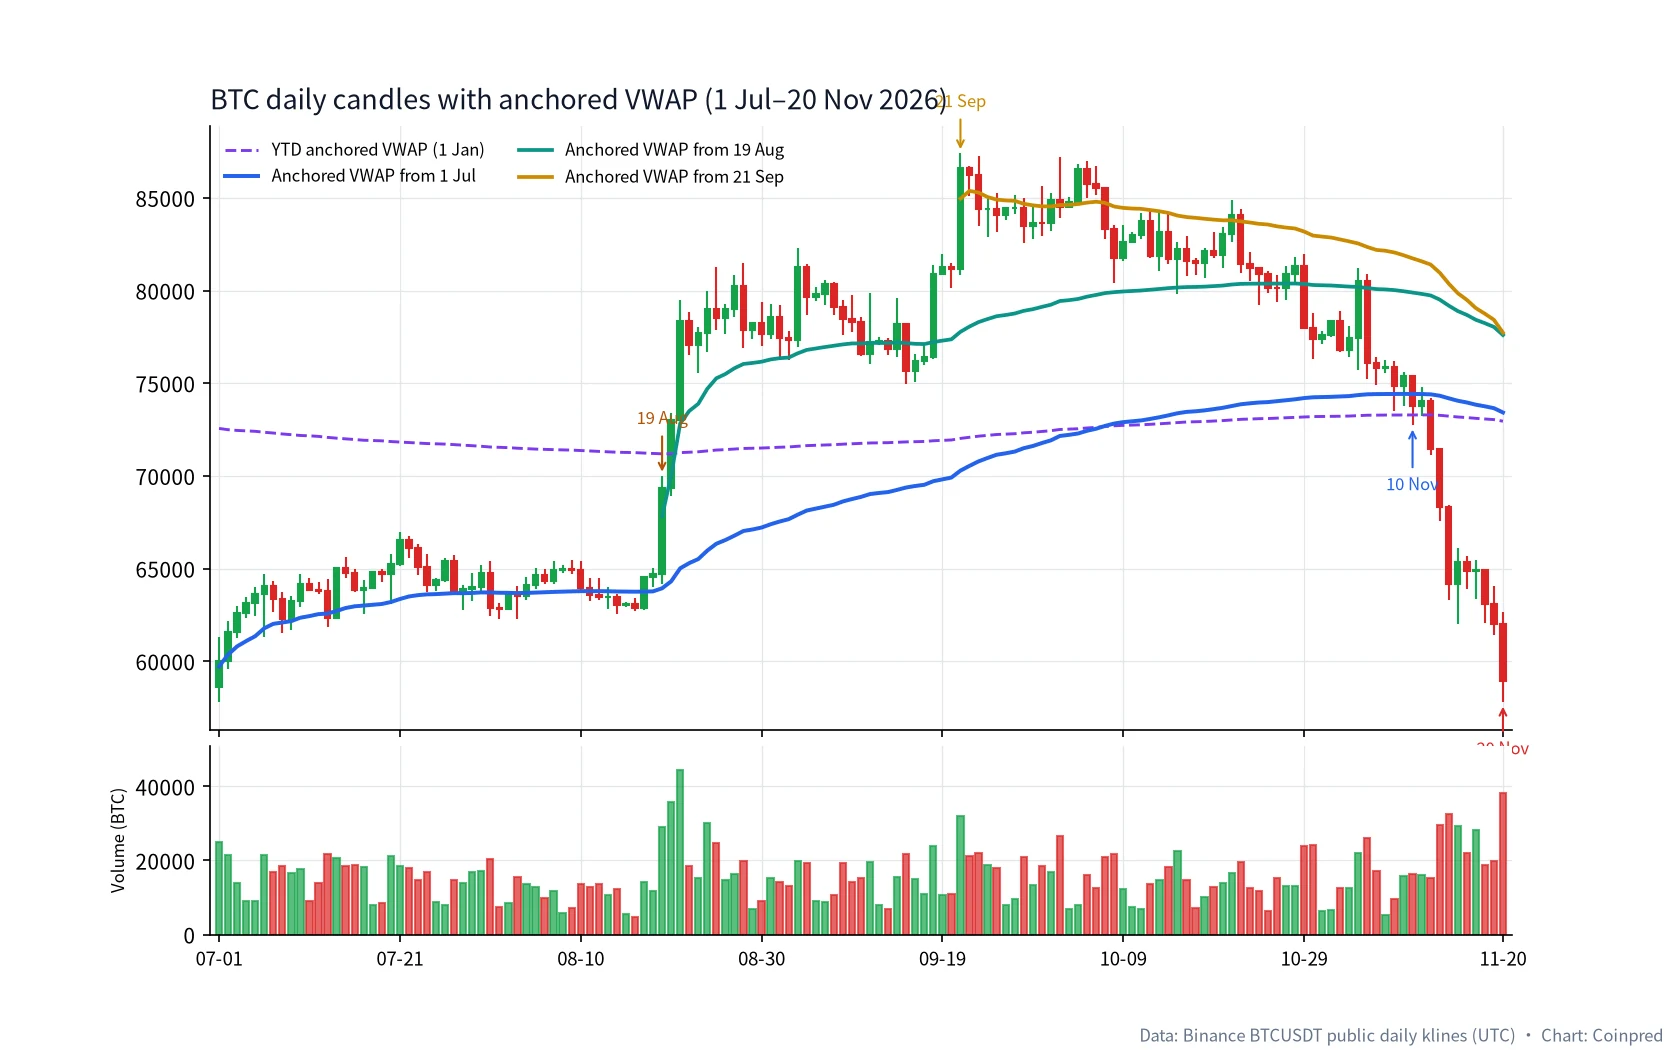
The window has 143 complete daily bars. The close was 60,024.00 on 1 July and 58,951.51 on 20 November. The window low is the last day’s 57,778.35; the window high is 87,395.67 on 21 September. The start and the end are not far apart. The path in between is a fairly complete advance and retreat — which is exactly why it is useful to ask where three different anchored lines sit on the same path.
| Anchor (UTC) | Why we chose it | Line on 20 Nov | Closes above it in the window | 20 Nov close vs the line |
|---|---|---|---|---|
| 2026-01-01 | A longer year-to-date view | 72,951.63 | 84 of 143 days; in this window the close only recaptured it on 20 Aug, then lost it again on 12 Nov | −19.19% |
| 2026-07-01 | Start of the window, and close to a swing low | 73,421.99 | 121 of 143 days | −19.71% |
| 2026-08-19 | The volume breakout day | 77,599.53 | 65 of the 94 days since the anchor | −24.03% |
| 2026-09-21 | The window high | 77,727.29 | only 8 of 61 days | −24.16% |
Do not read this table as a long or short recommendation. It only says one thing: the anchor decides whose cost the line is measuring. Start near the early-July low, and the line sits in the middle of the advance. Start at the 21 September high, and the later closes spend most of their time underneath. Both calculations are correct. They are different questions.
3. Mid-August: a weave around the 1 July line, then a high-volume leave
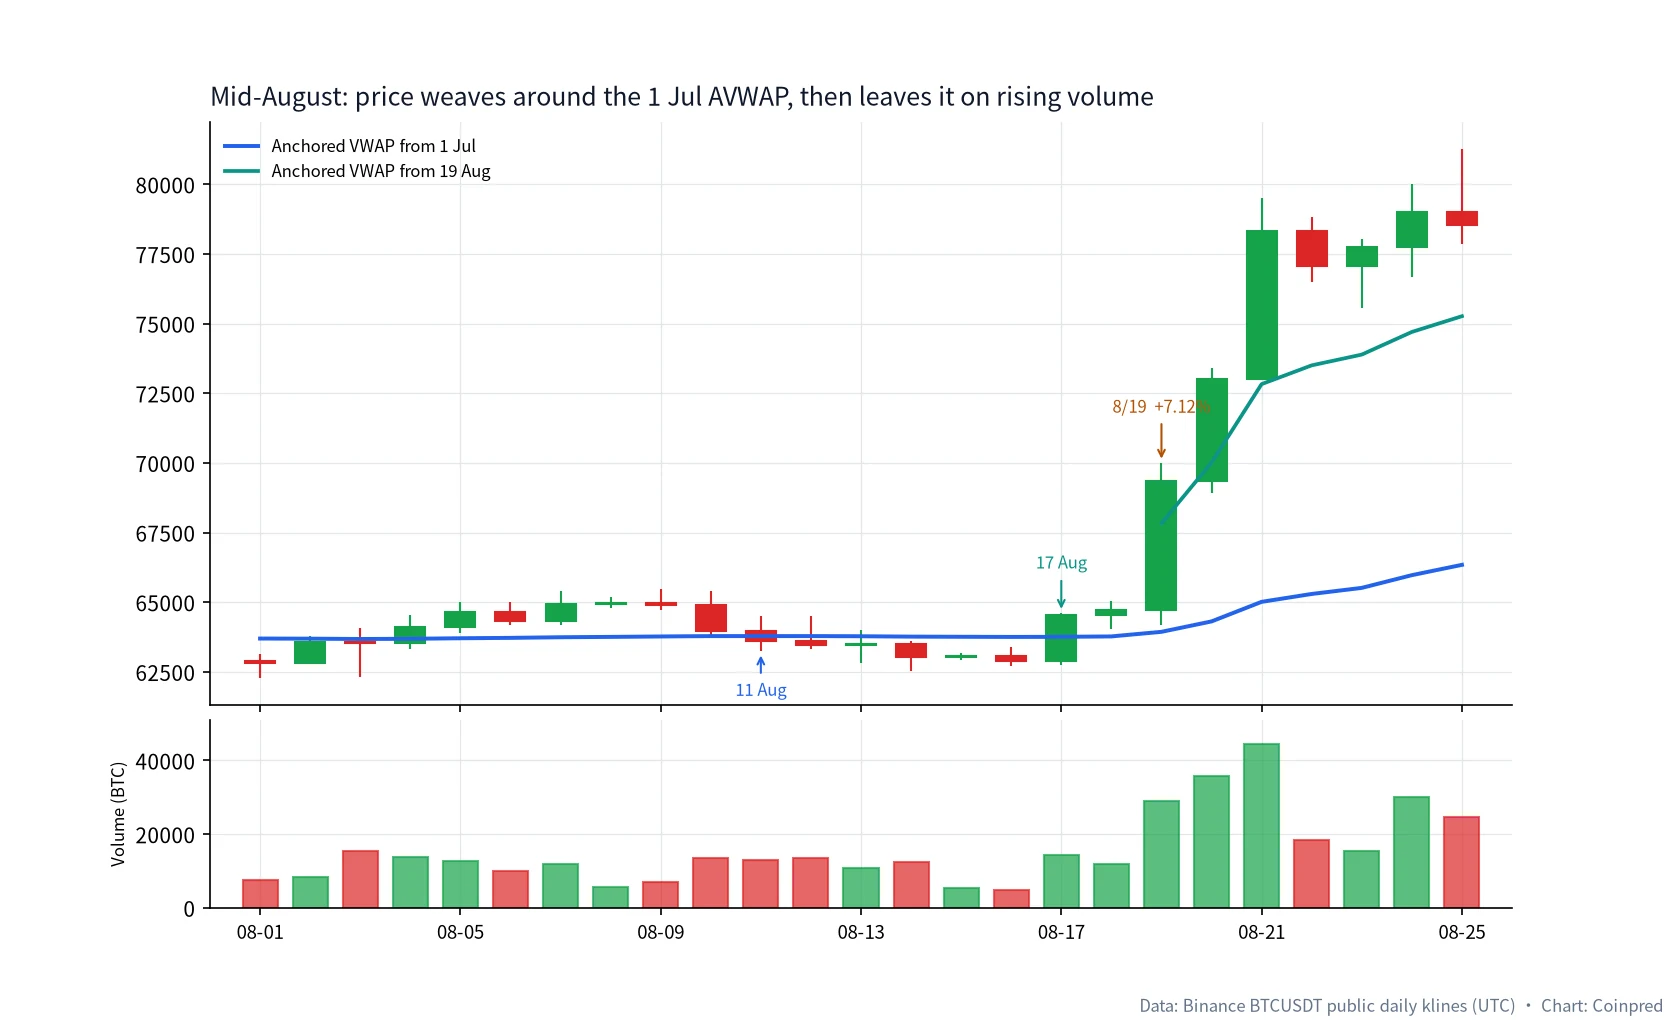
The 1 July anchored VWAP is not a line that, once recaptured, is never lost again. In the first half of the window the close crossed it several times:
| Date (UTC) | Close | 1 Jul AVWAP | Side | Change | Volume (BTC) |
|---|---|---|---|---|---|
| 07-13 | 62,334.52 | 62,576.03 | below −0.39% | −2.27% | 21,683 |
| 07-14 | 65,043.98 | 62,712.49 | above +3.72% | +4.35% | 20,552 |
| 07-31 | 62,887.88 | 63,710.40 | below −1.29% | −2.92% | 20,476 |
| 08-04 | 64,106.56 | 63,687.40 | above +0.66% | +0.92% | 13,690 |
| 08-11 | 63,600.00 | 63,784.64 | below −0.29% | −0.58% | 12,892 |
| 08-17 | 64,532.10 | 63,758.07 | above +1.21% | +2.59% | 14,256 |
| 08-19 | 69,334.79 | 63,937.01 | above +8.44% | +7.12% | 29,054 |
On 11 August the close was only 184.64 below the line. When it recaptured the line on 17 August, the gap was barely more than one percent. If you had treated every break as a reversal, those days would have spun you around. They look more like this: the volume-weighted cost since 1 July was still nearby, and price had not yet decided to leave it.
The leave is 19 August. The high reached 70,000.00, the low was 64,166.00, the close was 69,334.79, the gain was +7.12%, and volume was 29,054 BTC — well above the window median of about 15,228. The next day closed at 73,025.15 (+5.32%, volume 35,905). The day after that closed at 78,338.03 (+7.28%, volume 44,340, the heaviest day in the window). Those three large up days carried price away at once. The 1 July line was still only climbing through the mid-64,000s. It does not jump to a new high with a single large candle, because it is still carrying every session since 1 July.
That is also why we are willing to plant a second anchor on 19 August: from that day, the market rewrote a stretch of cost with much heavier volume. The new line, measured from 19 August itself, sat at 67,833.60 on that first day — already about 3,900 above the 1 July line. Both lines are true. Their windows are just different lengths.
4. A different anchor is a different line
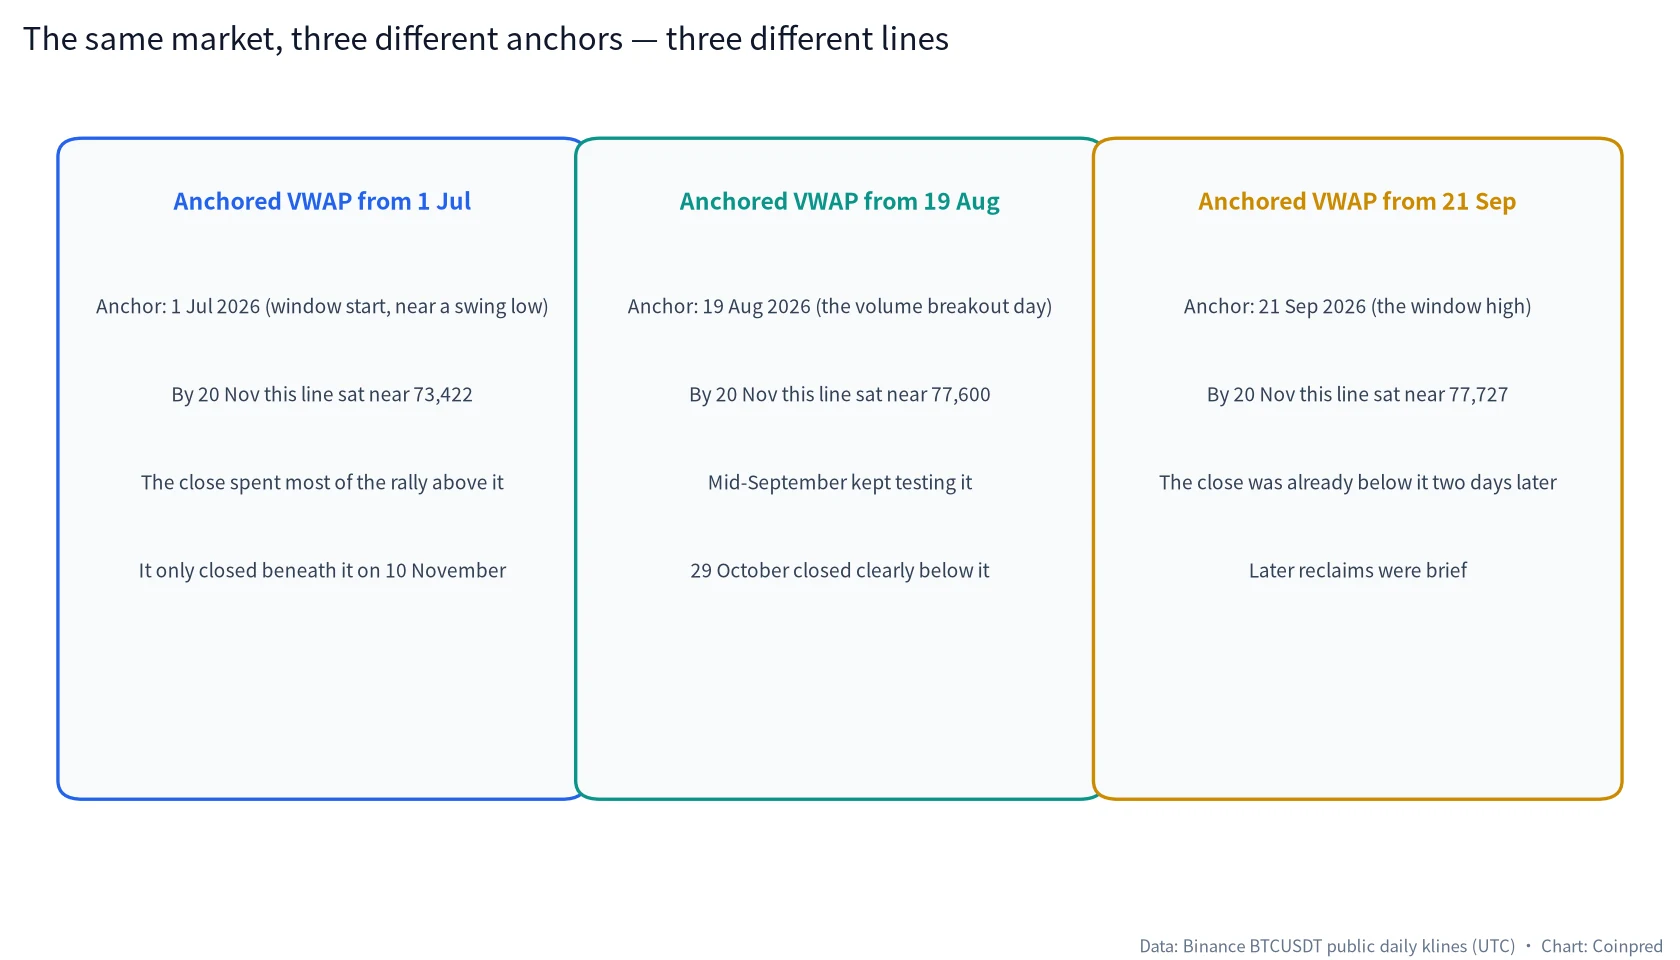
You can plot all three anchored lines on the same BTC daily chart. That does not make them a “confluence signal.”
- The 1 July line measures cost since the area of the window low. During the advance it sits relatively low; a deep November decline has to travel a long way before it even reaches it.
- The 19 August line measures cost since the breakout day. The heavy volume that follows lifts it quickly into the 75,000–80,000 region, so later pullbacks meet this line first.
- The 21 September line measures cost since the window high. The typical price of that day itself is already about 84,955.30. Unless price keeps making new highs on meaningful volume, this line tends to hang overhead rather than act as a floor.
Stacking the three lines is not an exercise in waiting until they “agree.” It is a reminder to ask which stretch of cost you are actually measuring. That is the same discipline we use in the support and resistance note: define the levels you are looking at, then talk about where price sits relative to them.
The longer year-to-date line has its own place in this window. On 19 August, with the close at 69,334.79, that line was still up at 71,191.76. The close only moved back above it on 20 August, at 73,025.15, when the YTD line was about 71,196.62. In other words, the mid-to-late August push did not just leave the July cost behind; it was also the first time in this window that the close returned above the year’s volume-weighted average. That is still not a buy ticket. It is what you see when the observation window gets longer.
5. September: several tests of the 19 August line, then the window high
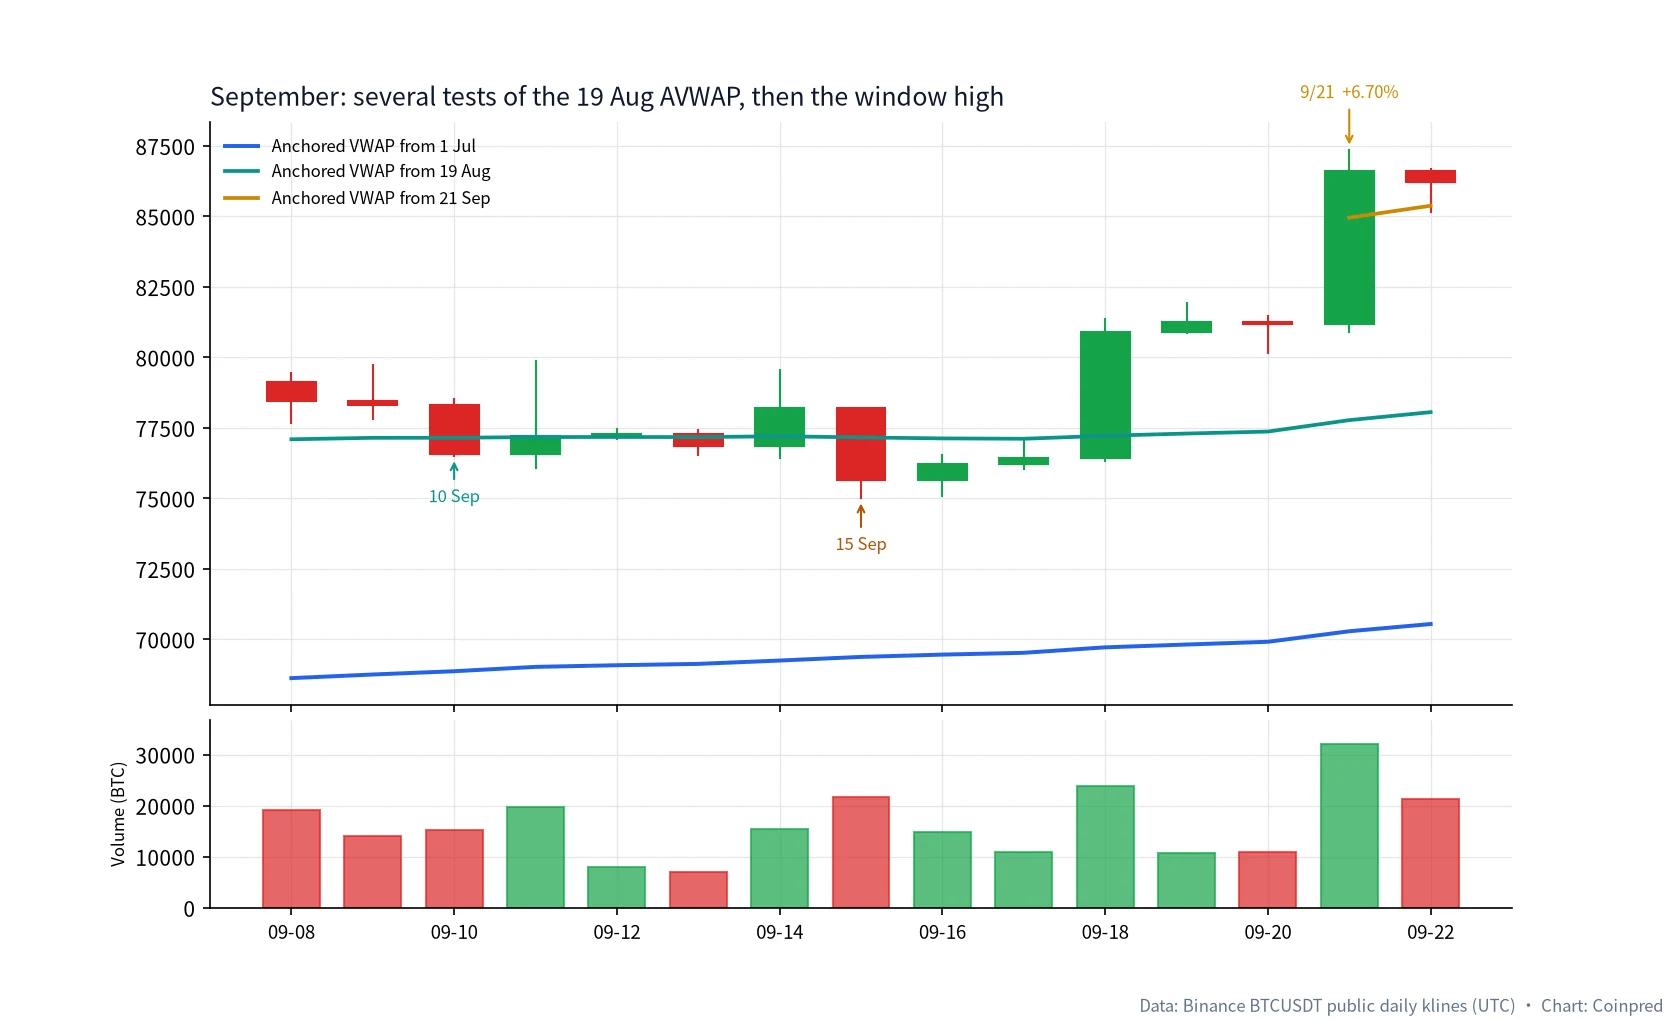
After the breakout, the 19 August line did not immediately become a rail that bounced every test. In mid-September the close came back to it several times, and even slipped underneath:
| Date (UTC) | Close | 19 Aug AVWAP | Side | Change | Note |
|---|---|---|---|---|---|
| 09-10 | 76,568.72 | 77,148.79 | below −0.75% | −2.22% | First clear close under the line |
| 09-11 | 77,225.70 | 77,174.23 | above +0.07% | +0.86% | Recaptured almost on the line |
| 09-13 | 76,842.01 | 77,172.41 | below −0.43% | −0.57% | Slightly under again |
| 09-14 | 78,189.21 | 77,201.27 | above +1.28% | +1.75% | Back above |
| 09-15 | 75,644.48 | 77,161.28 | below −1.97% | −3.25% | A deeper test; the low was 74,967.97 |
| 09-18 | 80,883.87 | 77,219.16 | above +4.75% | +5.85% | Left on rising volume |
| 09-21 | 86,620.00 | 77,773.85 | above +11.37% | +6.70% | High 87,395.67, the window high |
The 15 September close was almost two percent below the 19 August anchored VWAP, on volume of 21,683 — not a quiet day. If “lose the breakout-day average” had been a short rule, you would have been out four days before the window high. The fact on the page is narrower: the volume-weighted cost since 19 August was still near 77,100, price tested it a few times, and then left again on 18 and 21 September with heavier volume.
21 September itself traded 31,963 BTC. Its typical price planted a new anchored VWAP near 84,955.30. Two days later, on 23 September, the close was 84,397.60, already below that new line (about 85,284.80 that day). An average anchored at a high often starts life overhead. That is not a broken indicator. It is the question you asked: cost since the high, measured downwards.
6. October: the 21 September line goes first; the 19 August line breaks on 29 October
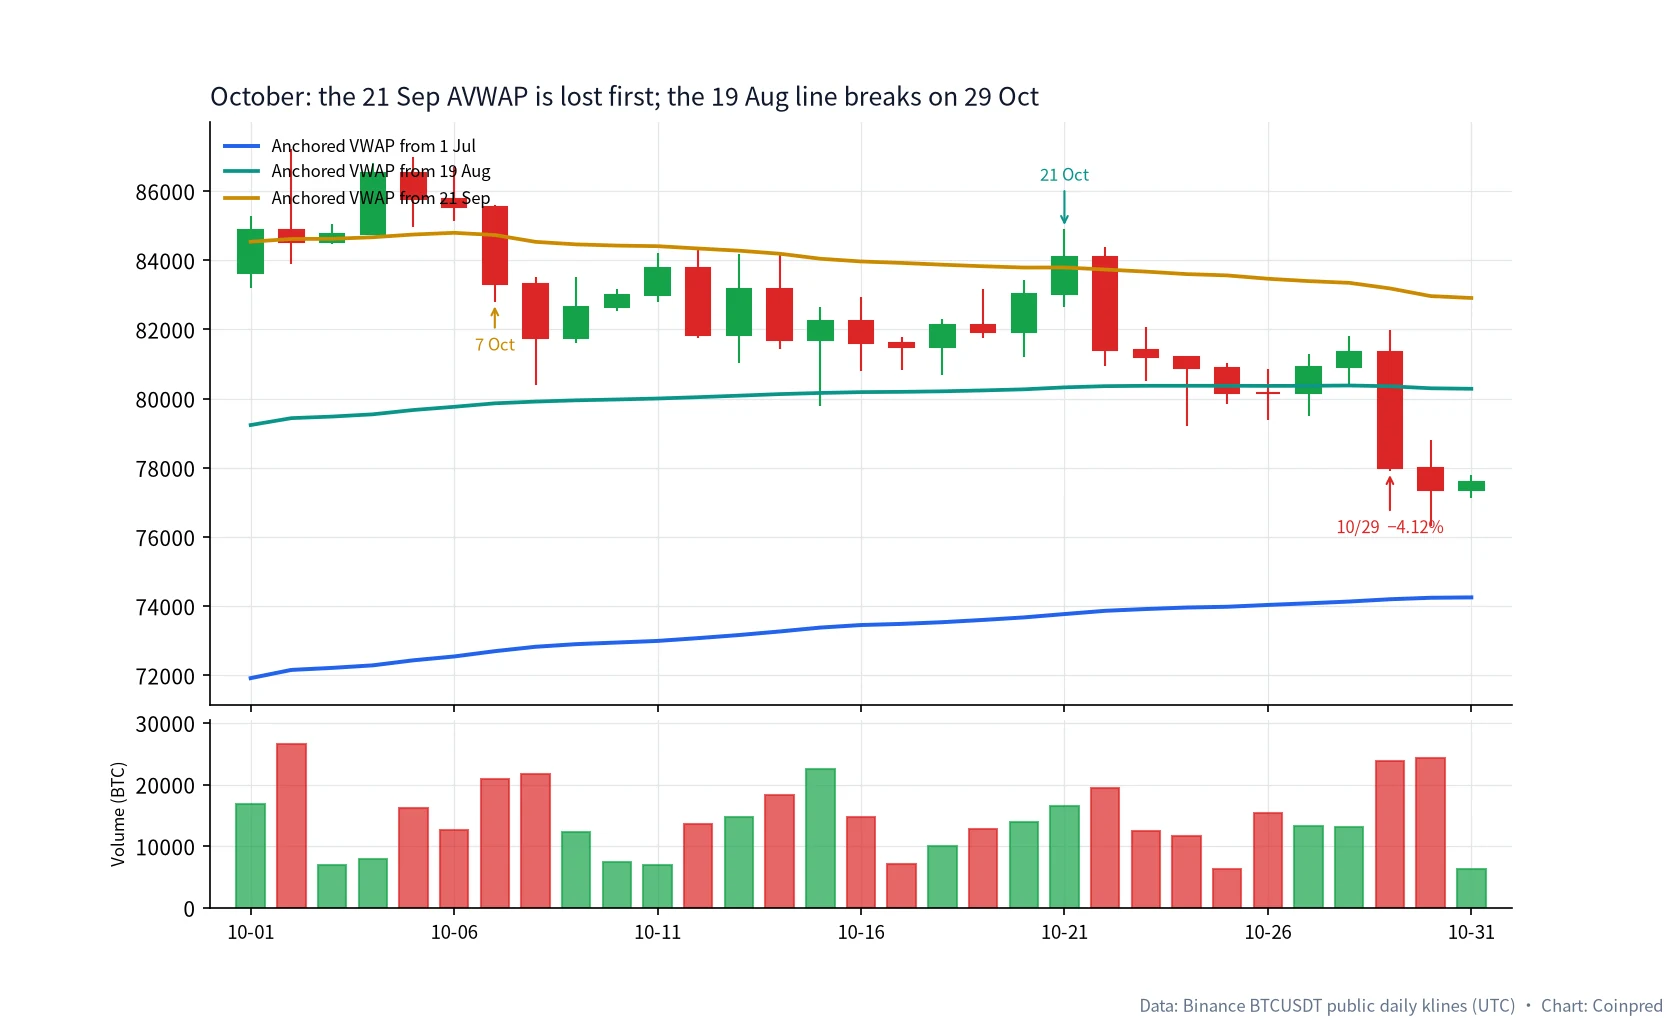
October is not about whether a new high is still coming. It is about whether price can recapture the cost measured from the high, and whether the earlier 19 August line can still hold.
| Date (UTC) | Close | 19 Aug line | 21 Sep line | Change | How we read it |
|---|---|---|---|---|---|
| 10-07 | 83,321.81 | 79,863.46 | 84,729.12 | −2.60% | Another clear close under the 21 Sep line |
| 10-21 | 84,093.42 | 80,324.83 | 83,791.26 | +1.28% | A brief recapture of the 21 Sep line |
| 10-22 | 81,416.09 | 80,359.78 | 83,731.34 | −3.18% | Lost again the next day |
| 10-25 | 80,154.09 | 80,370.70 | 83,561.40 | −0.91% | A slight close under the 19 Aug line, on only 6,253 of volume |
| 10-27 | 80,909.77 | 80,369.66 | 83,396.90 | +0.95% | Slightly back above the 19 Aug line |
| 10-29 | 77,991.89 | 80,356.81 | 83,185.12 | −4.12% | A decisive close under the 19 Aug line, on 23,832 of volume |
The 21 October recapture of the 21 September line lasted a single day. It looks a little like the mid-August weave around the 1 July line, but the structure is not the same. In August, price was still hesitating around its then-current cost. By late October the 21 September line was already an overhead reference. Slipping back above it for one session does not restore the cost advantage measured from that high.
We would not write the light 25 October dip up as “the trend is over.” The day that actually clarifies the 19 August line is 29 October: the close was 77,991.89, about 2.94% below the line, on volume of 23,832. The same session, in the companion SuperTrend tutorial, is also the down flip. The two tools ask different questions and happened to change on the same day. That is worth noting. It is not a mutual guarantee.
7. November: a brief trip back to the 19 August line, then the 1 July line gives way
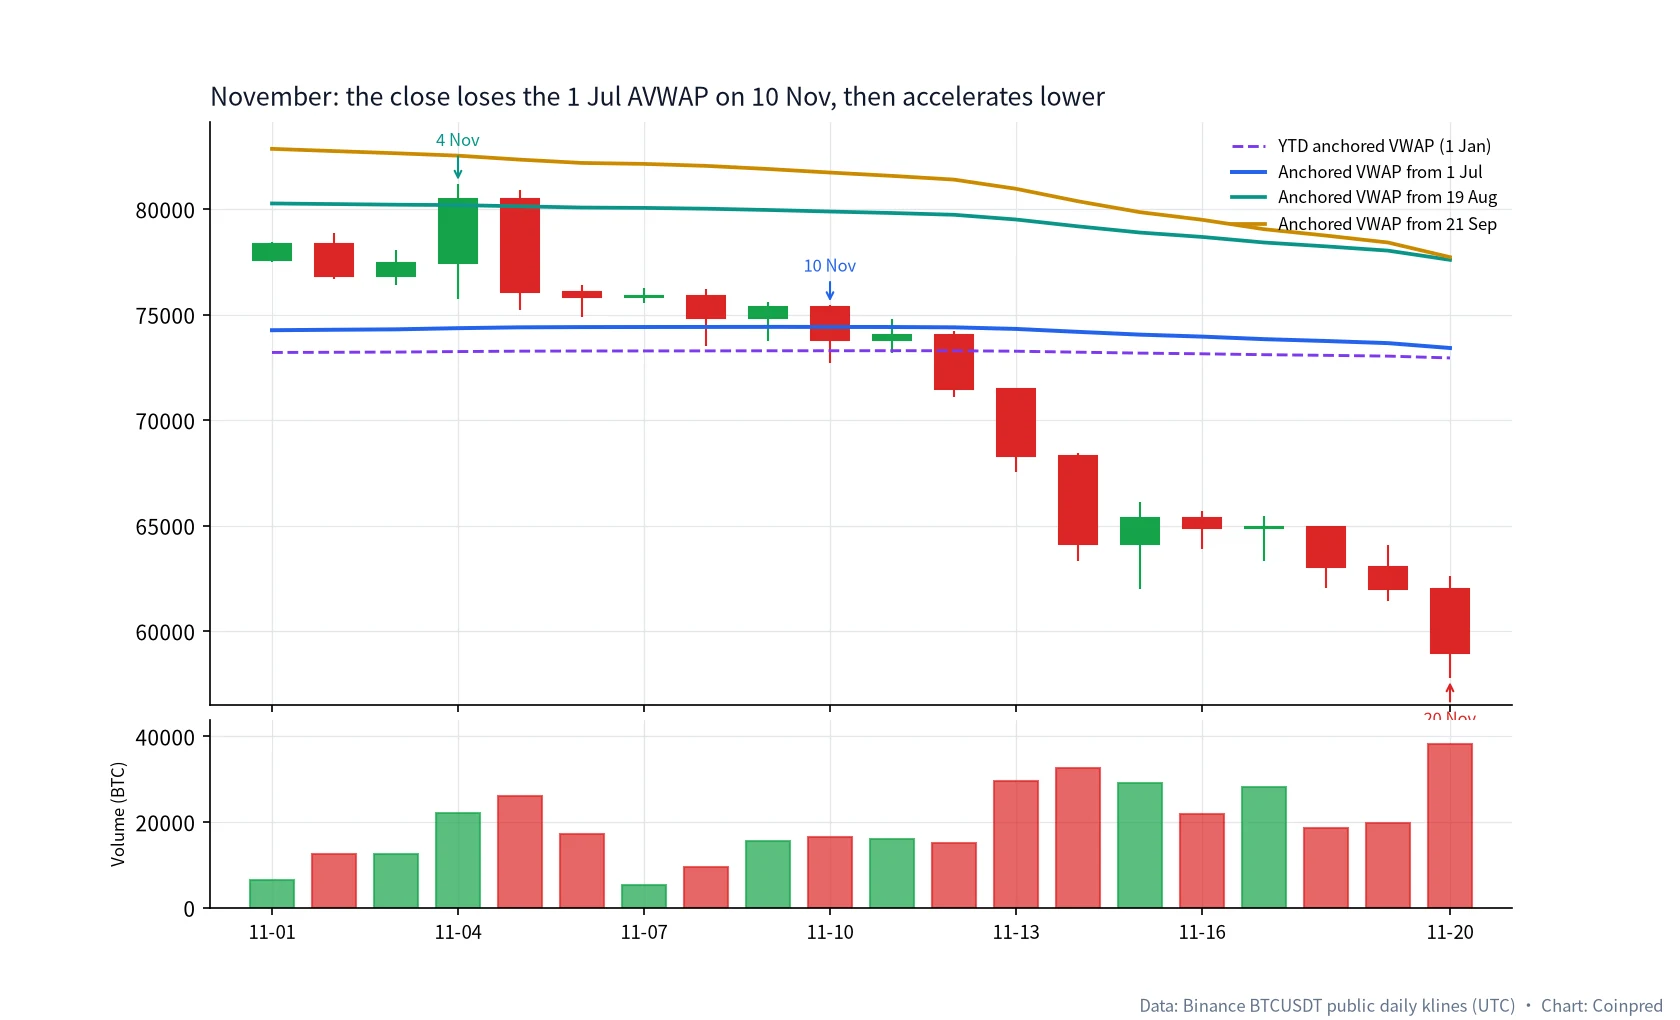
Early November still offers one bounce that is easy to over-read.
| Date (UTC) | Open | High | Low | Close | Change | 1 Jul line | 19 Aug line | Volume |
|---|---|---|---|---|---|---|---|---|
| 11-04 | 77,453.85 | 81,196.01 | 75,736.38 | 80,504.01 | +3.94% | 74,362.27 | 80,193.70 | 22,140 |
| 11-05 | 80,504.01 | 80,918.01 | 75,208.42 | 76,088.01 | −5.49% | 74,402.63 | 80,136.75 | 26,060 |
| 11-10 | 75,368.41 | 75,442.01 | 72,727.27 | 73,796.06 | −2.09% | 74,420.24 | 79,889.44 | 16,466 |
| 11-12 | 74,015.20 | 74,217.49 | 71,113.06 | 71,460.00 | −3.45% | 74,401.10 | 79,735.58 | 15,228 |
| 11-14 | 68,314.01 | 68,446.21 | 63,320.00 | 64,150.00 | −6.10% | 74,187.45 | 79,187.51 | 32,675 |
| 11-20 | 61,986.73 | 62,639.52 | 57,778.35 | 58,951.51 | −4.90% | 73,421.99 | 77,599.53 | 38,126 |
On 4 November the close was 80,504.01, just back above the 19 August line at 80,193.70, on volume of 22,140. It looks like a recapture of cost. It lasted one day. On 5 November the close was 76,088.01, about five percent lower. That bounce should not be mixed with the mid-September weave around the same line. The September tests still had the window high in front of them. This one arrived after the 21 September line had already been lost, and after the clearer 29 October break.
The session that actually speaks to the window’s starting line is 10 November. The close was 73,796.06, under the 1 July anchored VWAP at 74,420.24. Two days later, on 12 November, the close at 71,460.00 also lost the year-to-date line (about 73,291.84). What followed was not “the break equals the end.” It was an acceleration: 14 November fell 6.10% on volume of 32,675; 20 November traded as low as 57,778.35 and closed at 58,951.51 on volume of 38,126. By then the close was about 19.7% below the 1 July line, and about 24% below both the 19 August and 21 September lines.
One coincidence is worth a sentence of its own. On 14 November, SuperTrend sat at 74,198.36 and the 1 July anchored VWAP sat at 74,187.45 — two completely different calculations almost on top of each other — while the close was already at 64,150.00. Overlapping references do not automatically become support. They only tell you that, by that point, both the volume-weighted cost since July and an ATR trail had been left far overhead. The trail itself is the subject of today’s companion piece.
8. A five-step reading habit
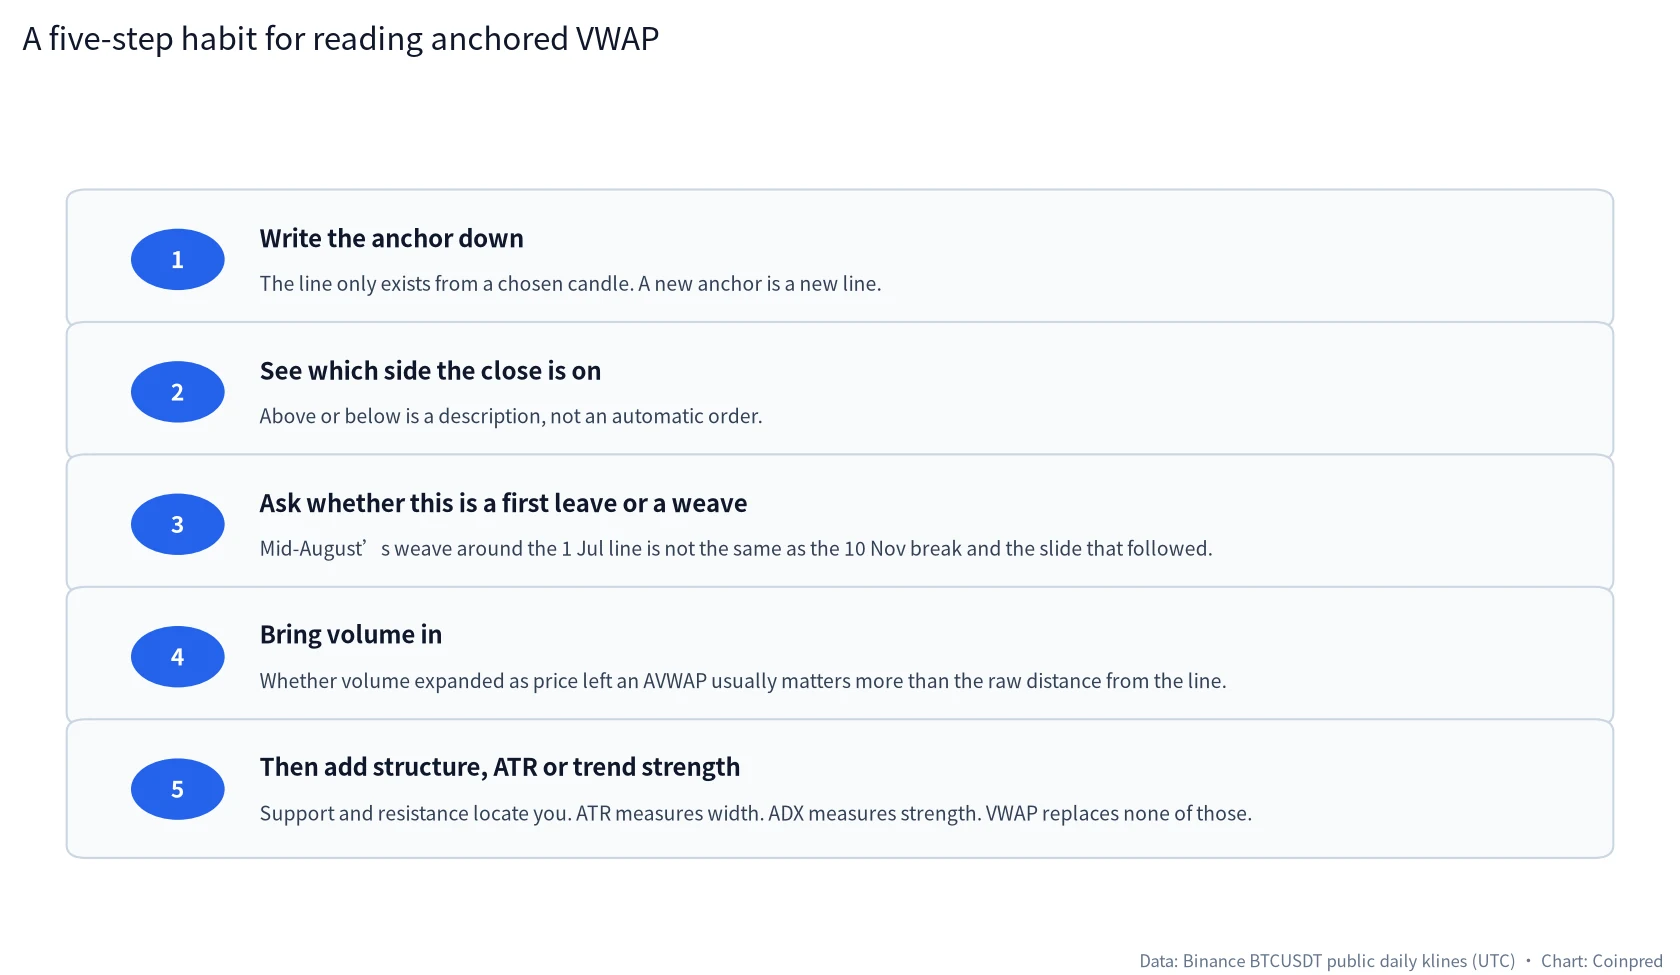
When we sit down with the daily chart, we usually follow this order, rather than hunting for a trade first:
- Write the anchor down. The line only exists from a chosen candle. A new anchor is a new line. 1 July, 19 August and 21 September can all be on the chart at once; they still answer different questions.
- See which side the close is on. Above or below is a description, not an automatic order. A wick through the line, with the close still on the other side, does not carry the same weight as a close that has itself moved through.
- Ask whether this is a first leave or a weave. Mid-August’s weave around the 1 July line is not the same as the 10 November break and the slide that followed. A one-day recapture such as 21 October also has to be kept apart from a reclaim such as 17 August, which still sat in front of a leave.
- Bring volume in. Whether volume expanded as price left an AVWAP usually matters more than the raw distance from the line. 19 August and 25 October both involve the area around the 19 August line; they are not even close in volume.
- Then add structure, ATR or trend strength. Support and resistance locate you. ATR measures width. ADX measures strength. VWAP replaces none of those.
If you only keep one sentence: first ask which stretch of cost the line is measuring, then which side the close is on, and only then decide whether today’s crossing is worth writing down.
9. What we will not do with VWAP
- Plot a session VWAP and an anchored VWAP on the same daily chart, leave the starting point unlabelled, and then complain that “our line does not match someone else’s.”
- Treat every close under an anchored VWAP as a mandatory short. 11 August and 15 September are enough to show how that turns a weave into a conclusion.
- Anchor a line at a swing high, notice that price spends most of its time underneath, and call that “VWAP being accurately bearish.” That is the question you chose to ask.
- Use a rolling 20-day VWAP to “confirm” a four-month anchored line. A short window and a long window can both be true without proving each other.
- Lift a daily anchored VWAP into a 15-minute trading decision, or the other way around.
- Treat VWAP as a substitute for Bollinger Bands or moving averages, just because it also happens to be a line in the middle of the chart.
- Use VWAP as a stand-alone system. You can write rules if you want; you then have to define failure, costs, and the difference between spot and perpetual. We are not doing that here.
FAQ
Should I use session VWAP or anchored VWAP on the BTC daily chart?
On the daily we mainly use anchored VWAP. Session VWAP resets every UTC day; once the daily candle is complete, it is just that day’s typical price, and there is almost no continuous daily line to read. If you want the day’s volume centre of gravity, look at session VWAP on the 1-hour or 15-minute chart. The formula is the same. The starting point and the reset rule are not, so do not compare the two numbers as if they were the same object.
Why typical price as (high + low + close) ÷ 3, rather than the close?
That is the most common convention, and it is the one we use throughout, so the figures are checkable. Some people use (high + low) ÷ 2, or they weight by quote volume instead of base volume. Those choices will move the same day’s VWAP. No exchange requires a particular “Bitcoin VWAP.” Pick one, write it on the chart, and do not retune it mid-review so that 15 September looks tidier.
Should the anchor be a low, a breakout day, or a high?
Any of the three can be useful, as long as you can say what you are asking. A low-area anchor looks back at the cost of a whole advance. A breakout-day anchor looks at cost after a high-volume leave. A high-area anchor asks whether the volume centre of gravity since that high is still nearby. We plotted all three in this article precisely to show that they are not the same line. Do not keep moving three anchors until the chart shows the support you already wanted.
If price closes under an anchored VWAP, should I just stay flat?
Not in our work. On 11 August the close was only 0.29% below the 1 July line; a few days later price left on heavy volume and went on to a new high. On 15 September it was almost two percent below the 19 August line, with the window high still ahead. After 10 November, when the 1 July line was lost, the decline did continue — but that reading puts the break next to volume, the earlier 29 October break, and the acceleration that followed. It is not a verdict delivered by the word “break” itself. If you need a single sentence: treat it as a rewrite of that cost line, not as a closed market.
If price is a long way from VWAP, will it get pulled back?
It has no such duty. On 20 November the close was already about 19.7% below the 1 July line. Distance only says that recent trade has moved far from the volume-weighted centre since that anchor. The line will not suck price back for you. If you care how wide the days have become, that is ATR. If you care how strong the decline is, that is ADX.
Can a rolling 20-day VWAP stand in for an anchored VWAP?
No. A rolling 20-day VWAP only ever sees the last twenty bars, and the window slides forward by itself. An anchored VWAP pins the starting point, and every later session keeps its weight. From late October into November, the 20-day line follows price down much faster than the 1 July anchored line. Looking at both can sometimes show that the short-term centre has already moved while a longer stretch of cost is still overhead. That is still a description, not a system.
Can I use this article on a 15-minute or 1-hour BTC chart?
You can reuse the formula. You cannot reuse the dates or the conclusions. An anchored VWAP on the 1-hour chart starts at a particular hourly candle, not at the 19 August daily bar. Session VWAP only really has a continuous shape on those lower time frames. Our own order is still daily first: write the daily anchor down, then decide whether to drop into a smaller chart.
Can VWAP alone be turned into a trading system?
You can write one. You then have to define how the anchor is chosen, whether a break waits for the close, what volume threshold you will accept, and how the line works with candlesticks and structure. On this BTC daily sample, a “short every break” rule would have taken you out on 11 August and 15 September; a “buy every reclaim” rule would have treated the one-day returns of 21 October and 4 November as a new trend. Those are the failure modes. This article is for study and review only.
Can VWAP tell me how to pick an event contract, or what direction JEV will print?
Only indirectly. Event contracts have their own expiry, settlement index and payout rules; if that is the product you are studying, start with the BTC event-contract note. JEV is a separate five-bucket directional read, and its confidence is not a win rate. Anchored VWAP can be one piece of market context we feed a model, or one piece of context we use when we read the chart ourselves. It is not a settlement forecast.
Data and references
- Candles: Binance’s public BTCUSDT daily endpoint, UTC, main window 2026-07-01 through 2026-11-20. 21 November was still an open session when this was written, so it is not treated as a complete day. Volume is the BTC quantity returned by that endpoint.
- Indicator: typical price = (high + low + close) ÷ 3; anchored VWAP = from the anchor date inclusive, Σ(typical price × volume) ÷ Σ volume. Comparison lines include the 1 January 2026 year-to-date anchored VWAP and a rolling 20-day VWAP.
- VWAP as a volume-weighted average price is a standard idea in institutional execution and transaction-cost analysis. The implementation above follows common chart defaults; it is not a broker’s or an exchange’s internal definition.
- Adjacent tutorials already in this series: candlesticks, support and resistance, moving averages, RSI, MACD, Bollinger Bands, volume, Fibonacci, Stochastic, ATR, ADX, Ichimoku, and the companion SuperTrend tutorial.
All charts were drawn by Coinpred from the public data above. If a date or a figure does not match your own recalculation, write to us via the author page or the contact listed there (@constcaoq). Trading involves risk; make your own decisions and size them carefully. This article is for education only and is not investment advice. Coinpred does not provide services to users in mainland China.