On coinpred.com this is the twentieth piece in our indicator tutorial series. We are the Coinpred editorial team — the same group that maintains the guides and the author page. The companion ATR tutorial asked how wide a typical day is. ADX asked how strong a trend is. One more tool still gets used as if it were a direction switch: turn ATR into a trailing band, and only change sides when the close crosses it.
That is SuperTrend. In many charting packages the defaults are an ATR period of 10 and a multiplier of 3, and those are the settings used throughout this article so the figures are checkable. The picture looks clean: a line under the close is an up-trail, a line above it is a down-trail. The usual mistake is not the formula. It is treating a wick through the line as a flip, or expecting the line to take you out on the day of the high. It will not do the latter. Lag is part of the design.
Every figure below is computed from Binance’s public BTCUSDT daily klines, in UTC. ATR is Wilder-smoothed — a simple average of the first ten true ranges, then a 10-day RMA — the same method we used in the ATR note, only the period is 10 rather than 14. The main window is 2026-07-01 through 2026-11-20. 21 November was still trading when we drafted this, so that unfinished session is not treated as a complete day. You can download the same series and recompute. This is a reading guide, not a trading system, and it is not investment advice.
1. Start with a mid-price and a width, then ratchet the band
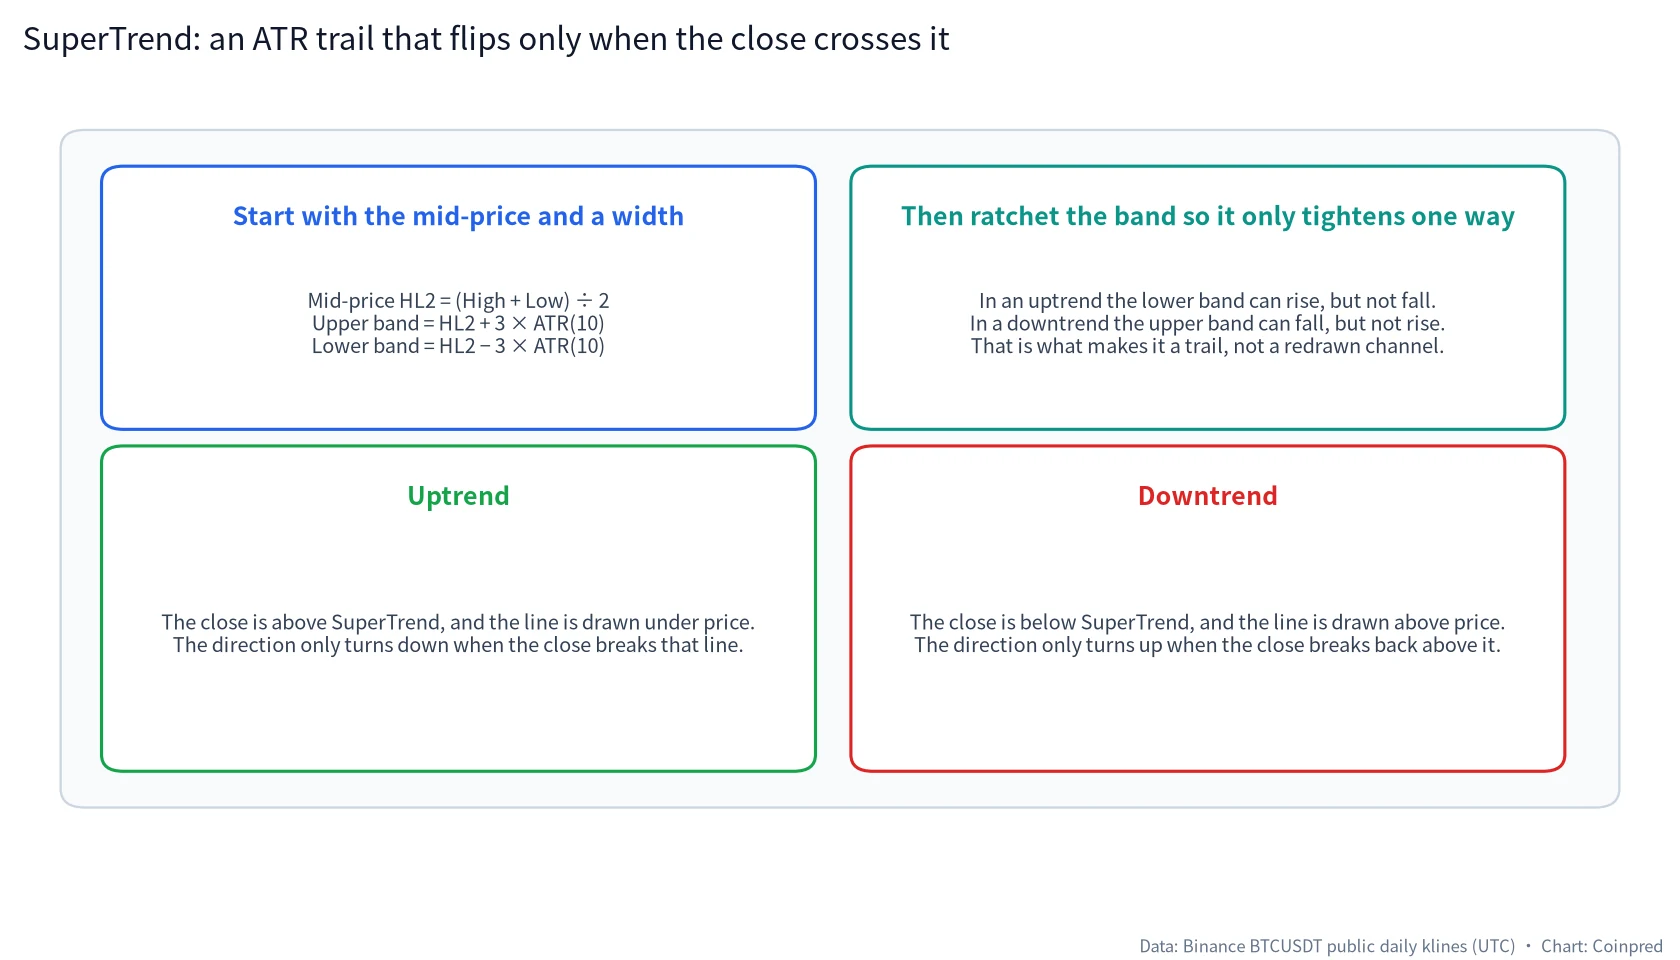
The raw material is still true range and ATR. The mid-price is not the close. It is the midpoint of the day’s high and low:
HL2 = (high + low) ÷ 2
Basic upper band = HL2 + 3 × ATR(10)
Basic lower band = HL2 − 3 × ATR(10)
If you redrew those two basic bands every day, you would have a channel that opens and closes with ATR. That is not yet SuperTrend. The next step is a one-way ratchet:
- In an uptrend the trail is the lower band: it may rise, but it may not fall, unless the previous close has already broken the previous lower band.
- In a downtrend the trail is the upper band: it may fall, but it may not rise, unless the previous close has already broken the previous upper band.
Direction itself is decided by the close:
- If the prior day was an uptrend and today’s close is still at or above the current lower band, the uptrend continues and SuperTrend is drawn under price.
- If today’s close breaks the current lower band, the direction turns down and SuperTrend is redrawn at the upper band.
- The downtrend rule is symmetric: the direction only turns back up when the close breaks above the current upper band.
A wick through the line does not change the direction if the close has not gone through. 20 July will make that almost too clear. The multiplier of 3 and the period of 10 are not exchange rules either; they are only the most common defaults. Changing the multiplier to 2 or 4 is the same as drawing a different, more or less sensitive, line.
2. First, the full picture from July to November
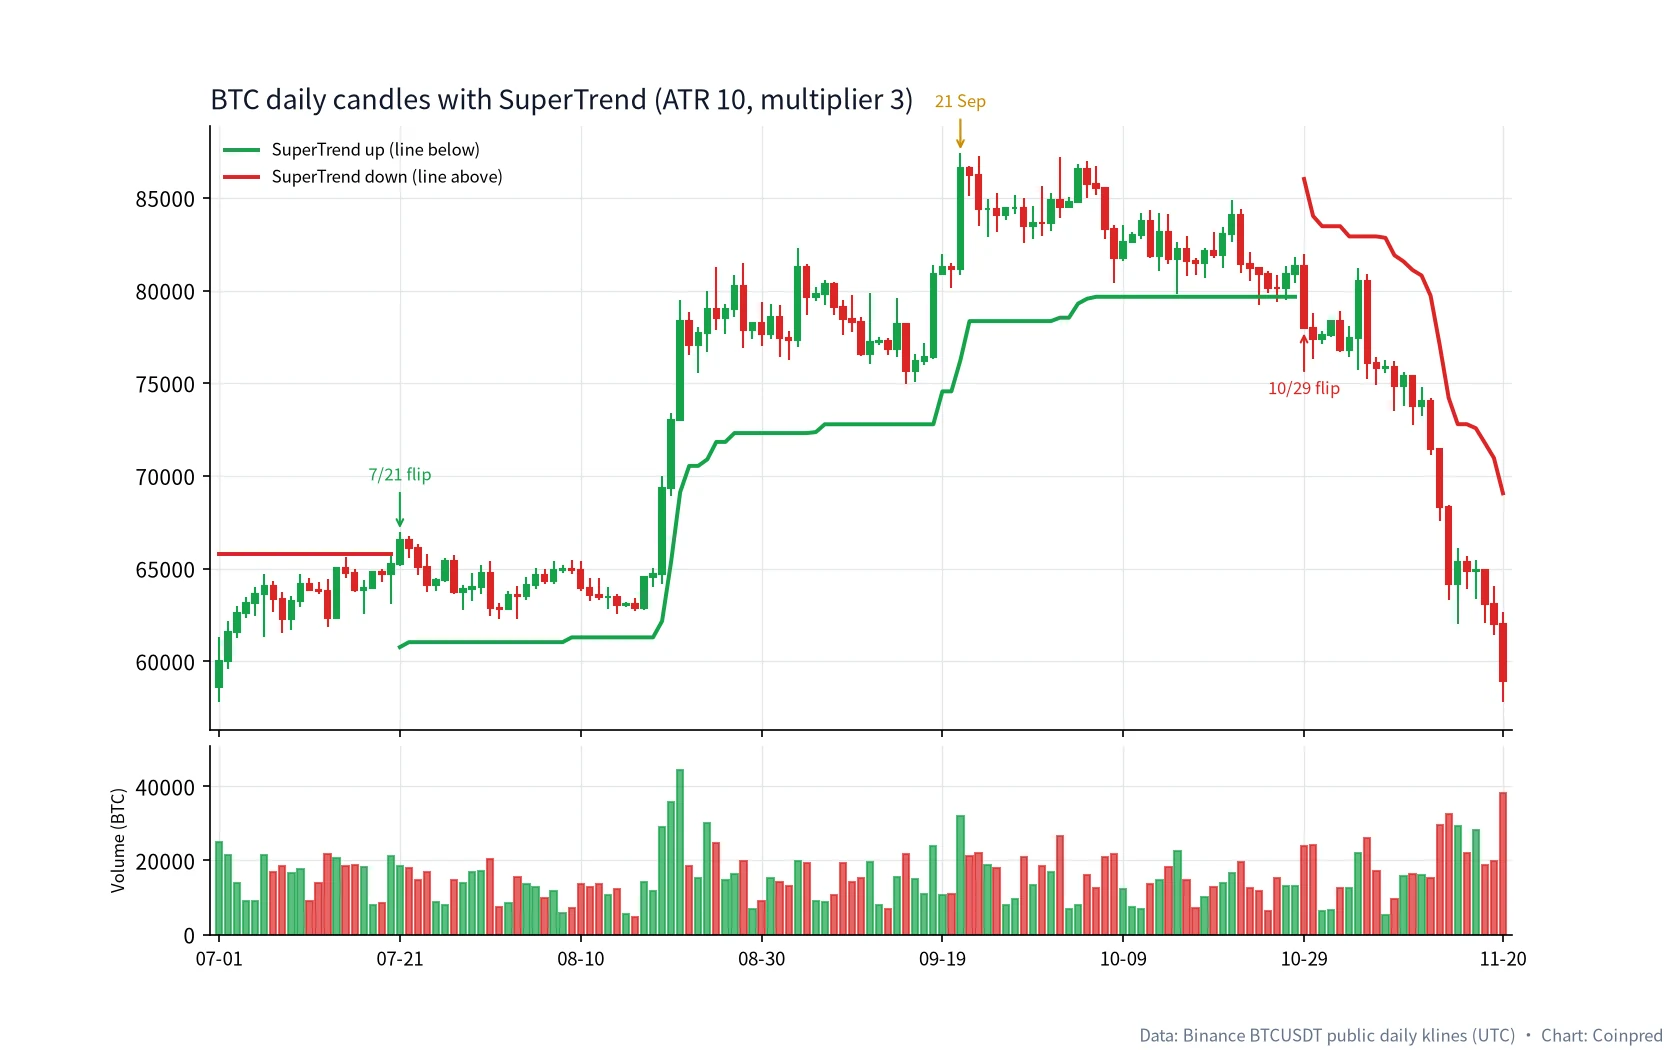
Across these 143 complete daily bars, the same settings flip only twice.
| Window (UTC) | Direction | Days | High / low in the stretch | Close and SuperTrend at the end |
|---|---|---|---|---|
| 07-01 to 07-20 | Down (line above) | 20 | High 65,799.00, low 57,800.19 | 20 Jul close 65,255.51, SuperTrend still at 65,800.77 |
| 07-21 to 10-28 | Up (line below) | 100 | High 87,395.67, low 62,275.00 | 28 Oct close 81,343.50, SuperTrend at 79,663.52 |
| 10-29 to 11-20 | Down (line above) | 23 | High 81,971.00, low 57,778.35 | 20 Nov close 58,951.51, SuperTrend at 69,061.86 |
The table is already a character sketch. With the default settings, SuperTrend is sticky. The August advance and the 21 September window high both happened inside an up-trail that had already been in place; the November decline happened after the 29 October flip. The line will not hand you a new direction on every pullback. If you treat it as an intraday switch, it will feel late. If you treat it as a trend filter, that stickiness is why it is built this way.
3. On 20 July the high almost tagged the line; the close only flipped the next day
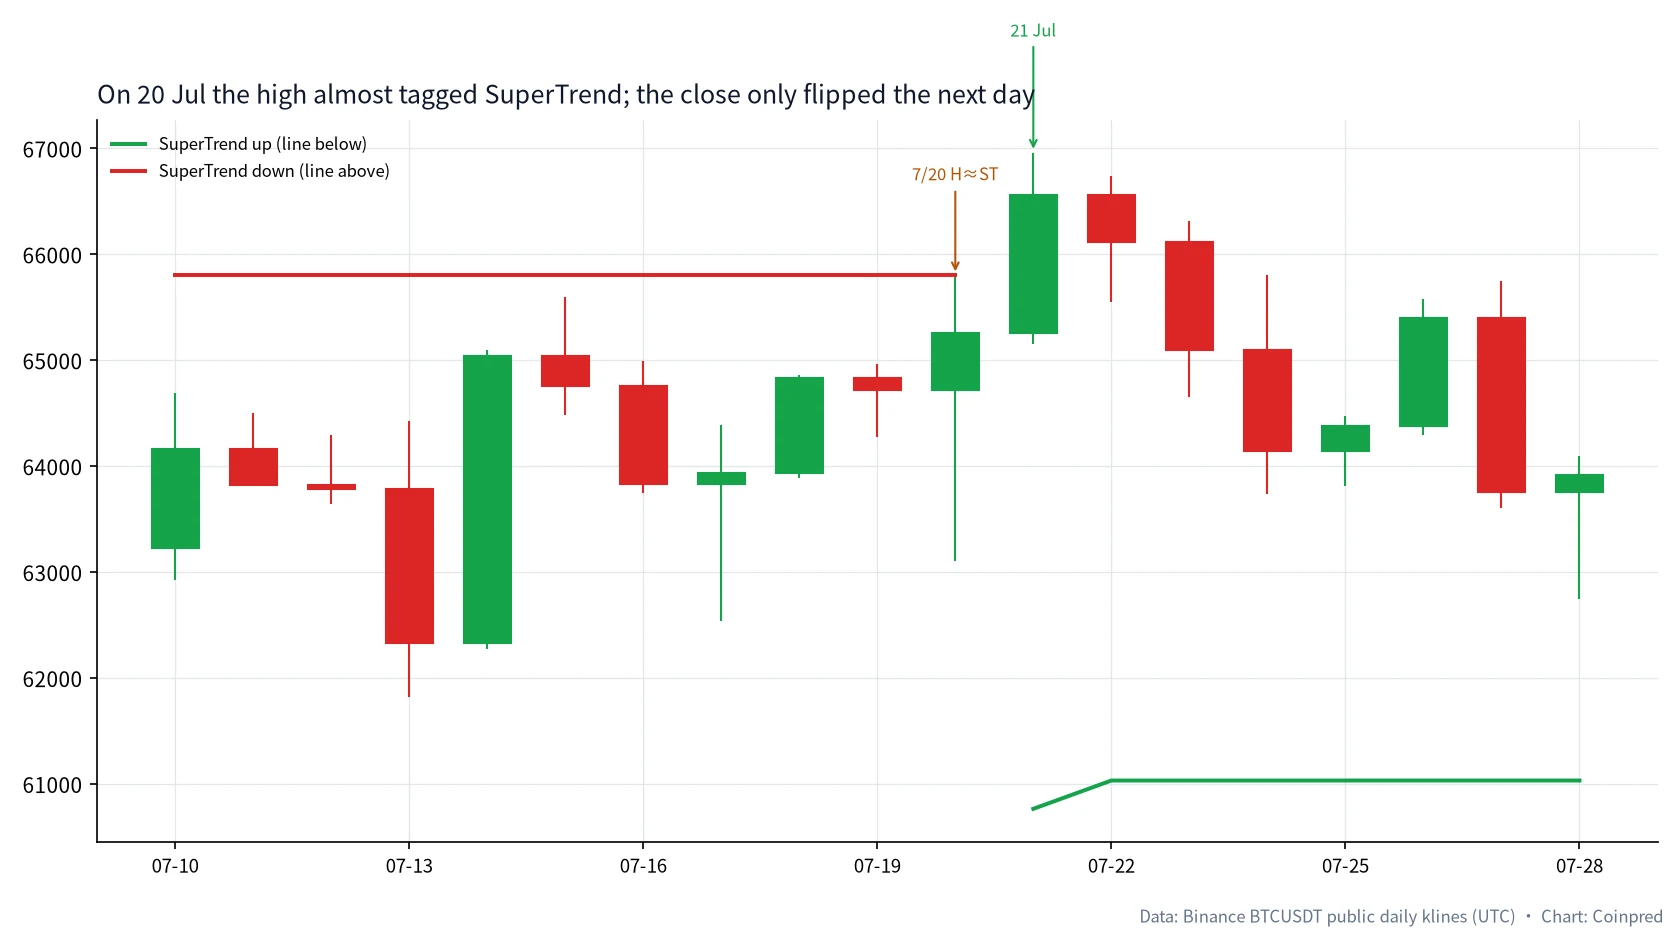
At the start of the window SuperTrend was in a downtrend, drawn above price, and had been sitting near 65,800.77 for a stretch. 20 July is the closest the market came to a flip without actually flipping.
| Date (UTC) | Open | High | Low | Close | Change | SuperTrend | Direction | ATR(10) |
|---|---|---|---|---|---|---|---|---|
| 07-19 | 64,834.21 | 64,967.25 | 64,280.00 | 64,722.54 | −0.17% | 65,800.77 | Down | 1,653.05 |
| 07-20 | 64,722.55 | 65,799.00 | 63,100.00 | 65,255.51 | +0.82% | 65,800.77 | Down | 1,757.64 |
| 07-21 | 65,255.51 | 66,956.15 | 65,148.75 | 66,556.16 | +1.99% | 60,764.59 | Up | 1,762.62 |
| 07-22 | 66,556.15 | 66,739.89 | 65,553.67 | 66,114.49 | −0.66% | 61,031.84 | Up | 1,704.98 |
On 20 July the high was 65,799.00 and SuperTrend was at 65,800.77 — a gap of 1.77. The wick almost tagged the line; the close remained at 65,255.51, so the direction did not change. The next day the close was 66,556.16, clearly through the prior upper band, and SuperTrend only then flipped to an uptrend, redrawn at the new lower band of 60,764.59.
That is why we are willing to write “wait for the close, not the wick” as a habit. If the 20 July wick had been treated as a flip, you would have been looking at an unfinished crossing rather than the close that actually confirmed it the next day. After a flip the line jumps to the opposite band, so SuperTrend often shows a gap on the chart. The data is not missing a day. The side being trailed has changed.
4. August: ATR widens, the lower trail lifts, and the direction does not change
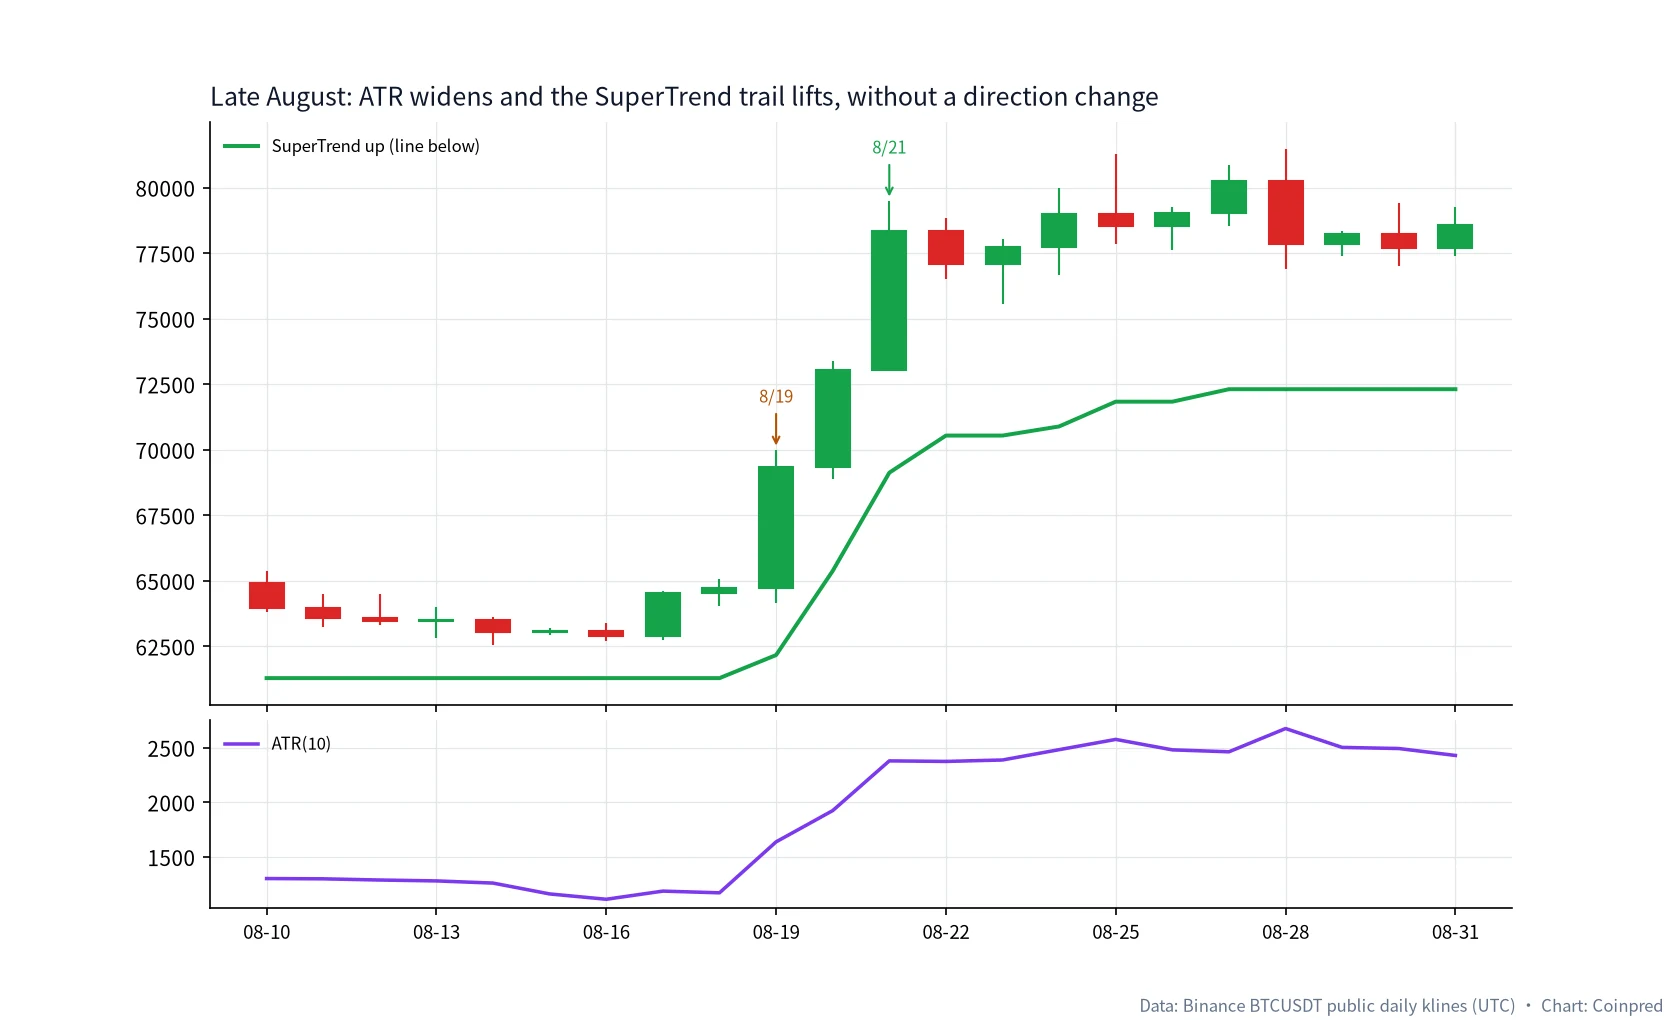
In mid-August, while price was still consolidating near 63,000, the SuperTrend lower band was sitting at 61,289.60 and ATR(10) was only about 1,100–1,300. Then three large, high-volume up days pulled volatility open at once.
| Date (UTC) | Close | Change | SuperTrend | ATR(10) | Volume (BTC) |
|---|---|---|---|---|---|
| 08-18 | 64,725.42 | +0.30% | 61,289.60 | 1,171.76 | 11,790 |
| 08-19 | 69,334.79 | +7.12% | 62,169.04 | 1,637.99 | 29,054 |
| 08-20 | 73,025.15 | +5.32% | 65,379.22 | 1,923.96 | 35,905 |
| 08-21 | 78,338.03 | +7.28% | 69,126.35 | 2,379.05 | 44,340 |
The direction did not change once. What changed was the width: ATR rose from about 1,172 to about 2,379, and the lower trail was lifted by nearly 8,000. That is the difference between SuperTrend and a fixed-percentage stop — when volatility expands, the trail is allowed to sit farther away; it only tightens when volatility contracts. We already said in the ATR note that a wider day is not an invitation to add size. The same point holds here. A higher lower band only means “it now takes a wider buffer to keep the up-trail intact.” It does not mean “the trend is safer, so you can add leverage.”
The same stretch, in the companion VWAP tutorial, is the 19 August leave of the 1 July anchored average on heavy volume. SuperTrend does not issue a new direction that day, because it has already been in an uptrend since 21 July. Two tools can both become more useful on the same session without both “giving a signal.”
5. In the mid-September pullback, the close stayed well above SuperTrend
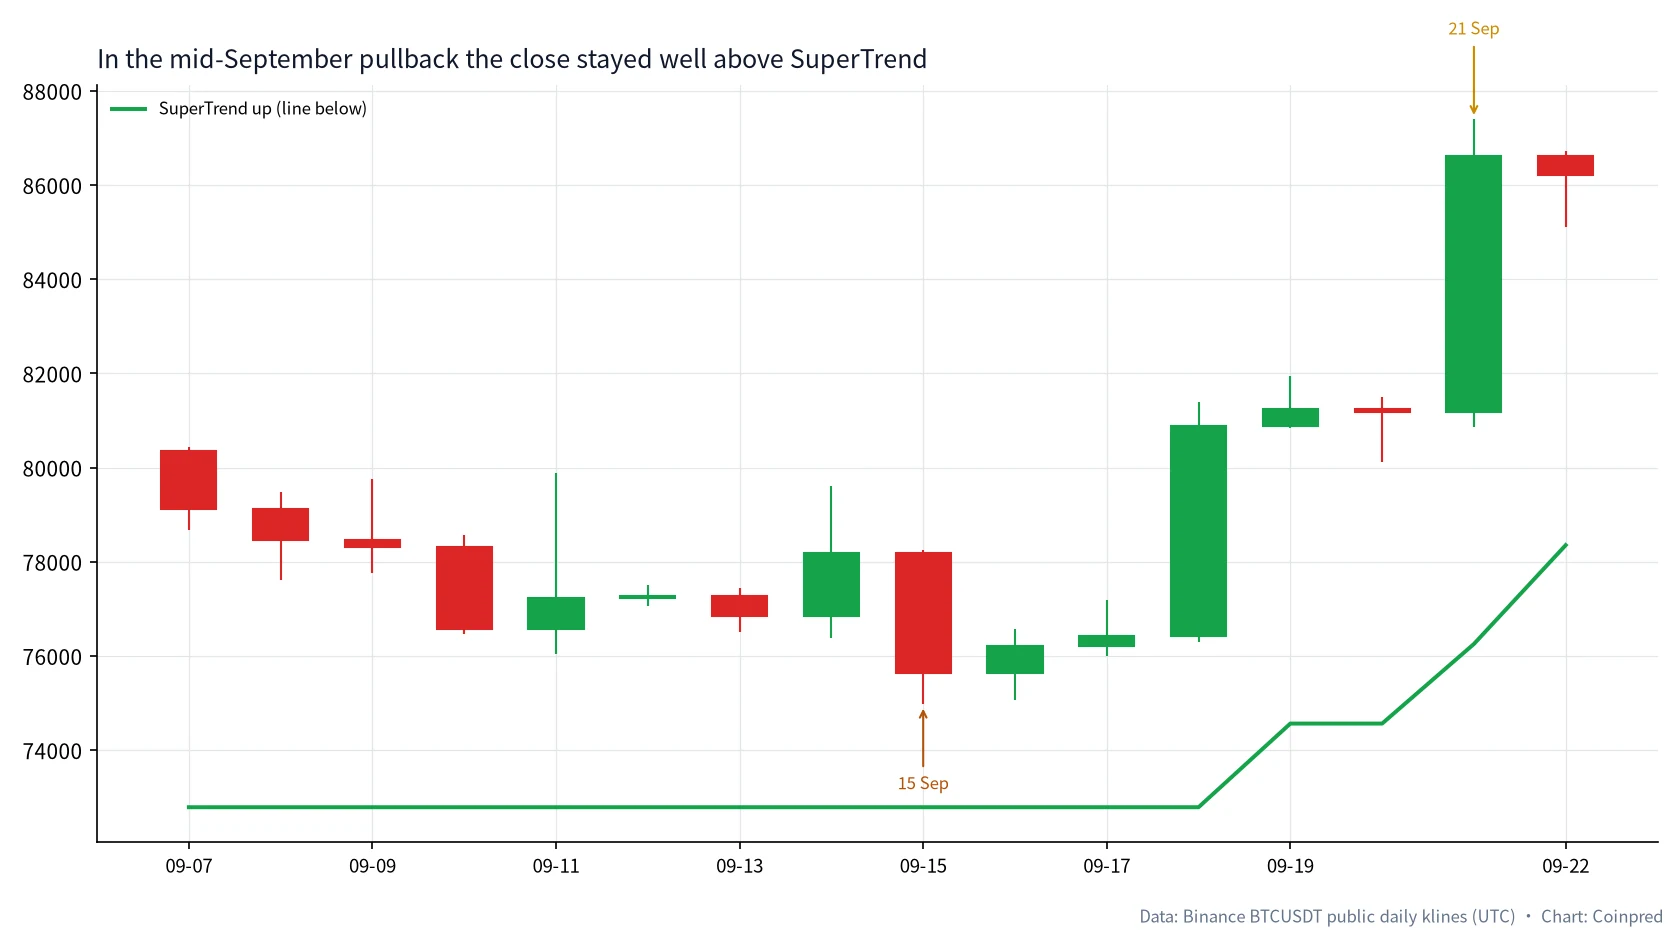
Mid-September includes a pullback that looks uncomfortable. On 15 September the close fell 3.25%, and the low reached 74,967.97. That is usually when people ask whether the trail is about to break.
| Date (UTC) | Close | Low | SuperTrend | Close above SuperTrend | Change |
|---|---|---|---|---|---|
| 09-10 | 76,568.72 | 76,464.00 | 72,786.11 | 3,782.61 | −2.22% |
| 09-15 | 75,644.48 | 74,967.97 | 72,786.11 | 2,858.37 | −3.25% |
| 09-18 | 80,883.87 | 76,296.00 | 72,786.11 | 8,097.76 | +5.85% |
| 09-21 | 86,620.00 | 80,850.22 | 76,252.54 | 10,367.46 | +6.70% |
On 15 September the low was still about 2,182 above SuperTrend, and the close was about 2,858 above it. With these settings, the pullback never touched the trail. On 21 September, when the high reached 87,395.67 and the close was 86,620.00, SuperTrend had only been lifted to 76,252.54. There were about 10,000 points between the new high and the trail.
That is the lag. SuperTrend is not there to tell you, on 21 September itself, that a top is in. What it was still confirming that day is simpler: the close remained far above a lower band that was still rising. If you want to ask whether an oscillator confirmed those highs, that is a Stochastic or RSI question. If you want to ask how strong the trend is, that is ADX. SuperTrend’s job on that day was only to keep trailing.
6. Late October: the close hugged the line for days and only flipped on 29 October
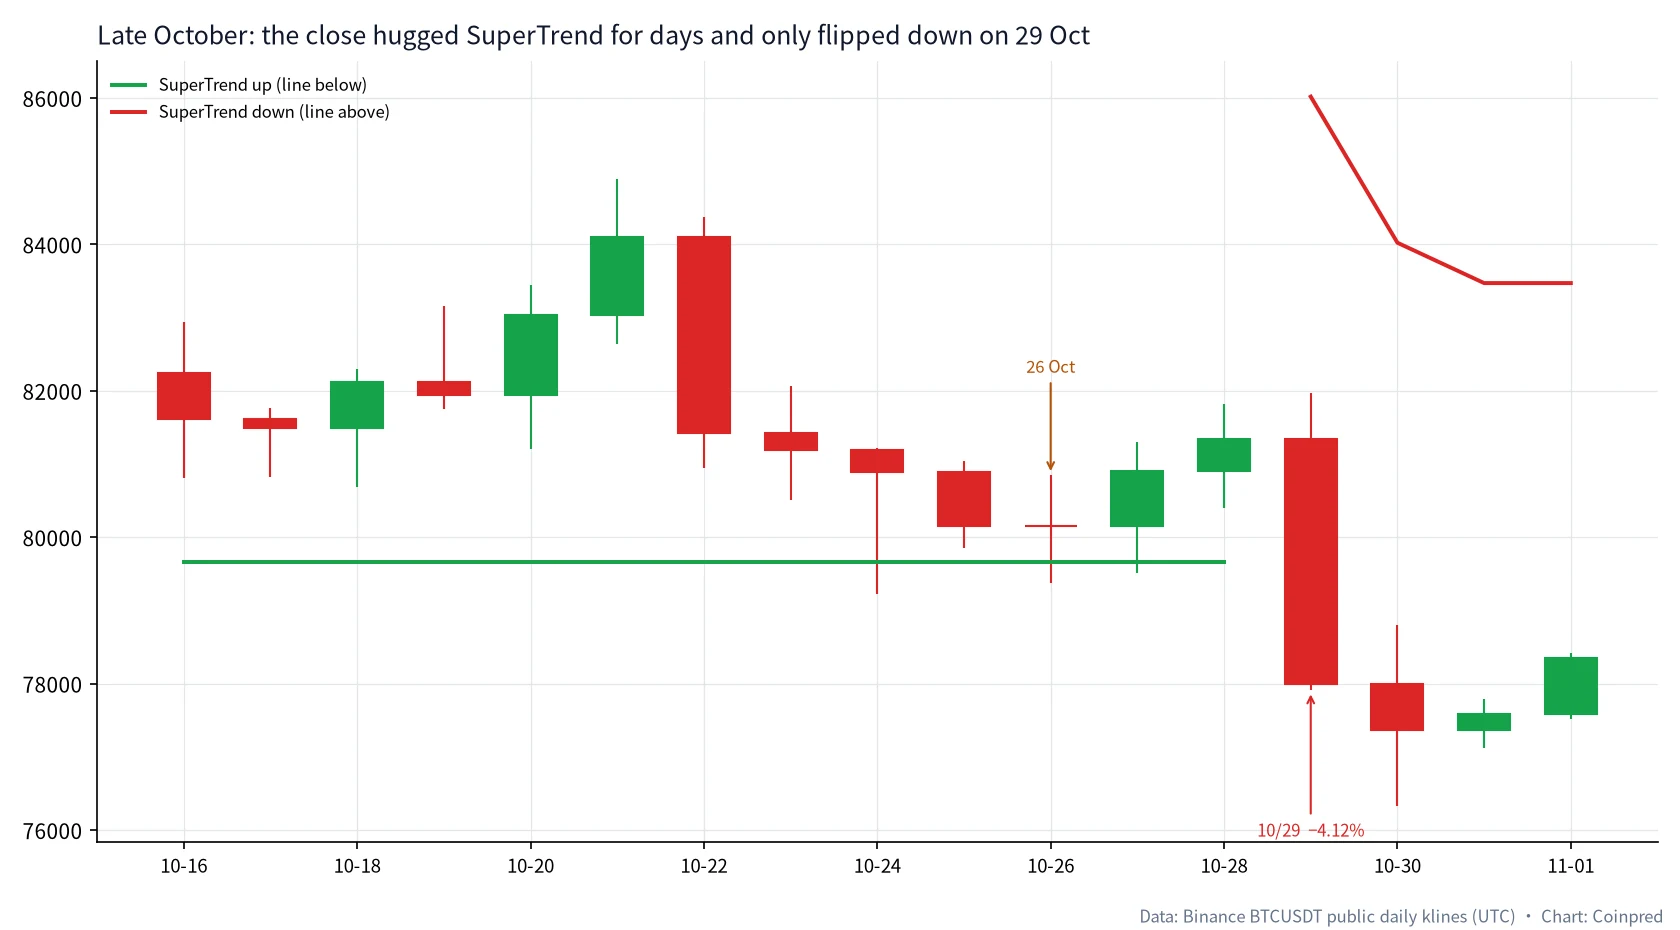
The real approach to a flip is late October. From 6 October the lower band stopped at 79,663.52 and stayed there for many sessions. The close began to sit close to it.
| Date (UTC) | Close | Low | SuperTrend | Close − SuperTrend | Change | Volume |
|---|---|---|---|---|---|---|
| 10-24 | 80,888.16 | 79,220.74 | 79,663.52 | 1,224.64 | −0.37% | 11,720 |
| 10-25 | 80,154.09 | 79,845.86 | 79,663.52 | 490.57 | −0.91% | 6,253 |
| 10-26 | 80,150.56 | 79,368.67 | 79,663.52 | 487.04 | 0.00% | 15,371 |
| 10-27 | 80,909.77 | 79,506.00 | 79,663.52 | 1,246.25 | +0.95% | 13,231 |
| 10-28 | 81,343.50 | 80,397.14 | 79,663.52 | 1,679.98 | +0.54% | 13,109 |
| 10-29 | 77,991.89 | 77,910.00 | 86,016.92 | — | −4.12% | 23,832 |
On 24 and 26 October the low had already pierced 79,663.52, but the close remained above it, so the direction was still up. On 26 October the close was only 487.04 above the line — about 0.61% of that day’s close. Hugging the line is not a flip.
The flip is 29 October. The close was 77,991.89, down 4.12%, on volume of 23,832, and it clearly broke the lower band that had been flat for weeks. SuperTrend turned down and jumped to the new upper band at 86,016.92. The same session, in the VWAP article, is also a decisive close under the 19 August anchored average. Two different questions happened to change on the same daily bar. That is worth writing down. It is not a reason to treat “double confirmation” as an order ticket.
The lag should be stated plainly as well. The window high was 87,395.67 on 21 September; the direction only flipped on 29 October, with the close already back at 77,991.89. With these settings you will not be taken out on the day of the high. That is the cost of the tool, not a calculation error.
7. November: the down-trail steps lower, and the bounce never reaches it
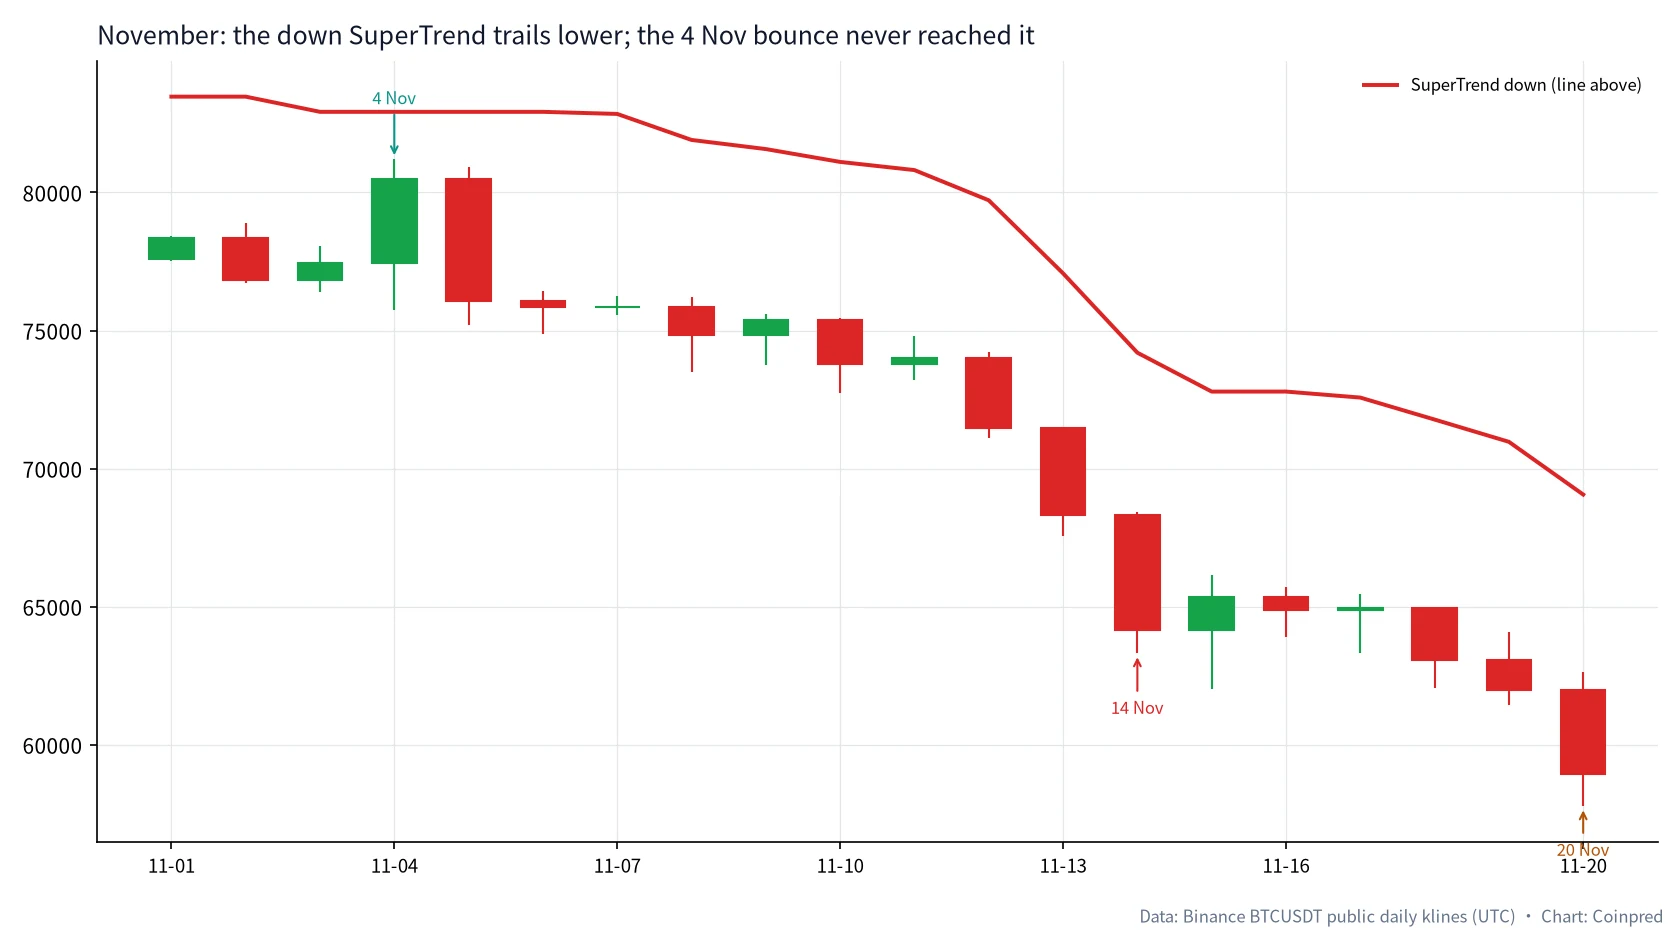
Once the line has flipped, the question becomes whether a bounce can recapture the trail now drawn overhead. 4 November is the closest approach in this window.
| Date (UTC) | Close | High | SuperTrend | SuperTrend − close | Change |
|---|---|---|---|---|---|
| 11-01 | 78,354.00 | 78,422.23 | 83,470.39 | 5,116.39 | +1.00% |
| 11-04 | 80,504.01 | 81,196.01 | 82,920.26 | 2,416.25 | +3.94% |
| 11-05 | 76,088.01 | 80,918.01 | 82,920.26 | 6,832.25 | −5.49% |
| 11-14 | 64,150.00 | 68,446.21 | 74,198.36 | 10,048.36 | −6.10% |
| 11-20 | 58,951.51 | 62,639.52 | 69,061.86 | 10,110.35 | −4.90% |
On 4 November the high reached 81,196.01, while SuperTrend sat at 82,920.26 — still about 1,724 away. The close at 80,504.01 was farther still. The next day fell 5.49%. Treating that bounce as “the downtrend is over” has no support under these settings: the line was still overhead, and the close never crossed it.
After that, SuperTrend stepped lower as ATR widened. On 14 November it sat at 74,198.36, almost on top of that day’s 1 July anchored VWAP (74,187.45), while the close was already at 64,150.00. On 20 November the close was 58,951.51, the low was 57,778.35, SuperTrend was still at 69,061.86, and ATR(10) had risen to 2,950.98. The line is following the decline, but the close remains a long way beneath it. That is not a cue to buy the dip. It only says the down-trail is still in force, and the buffer has been widened by volatility.
8. A five-step reading habit
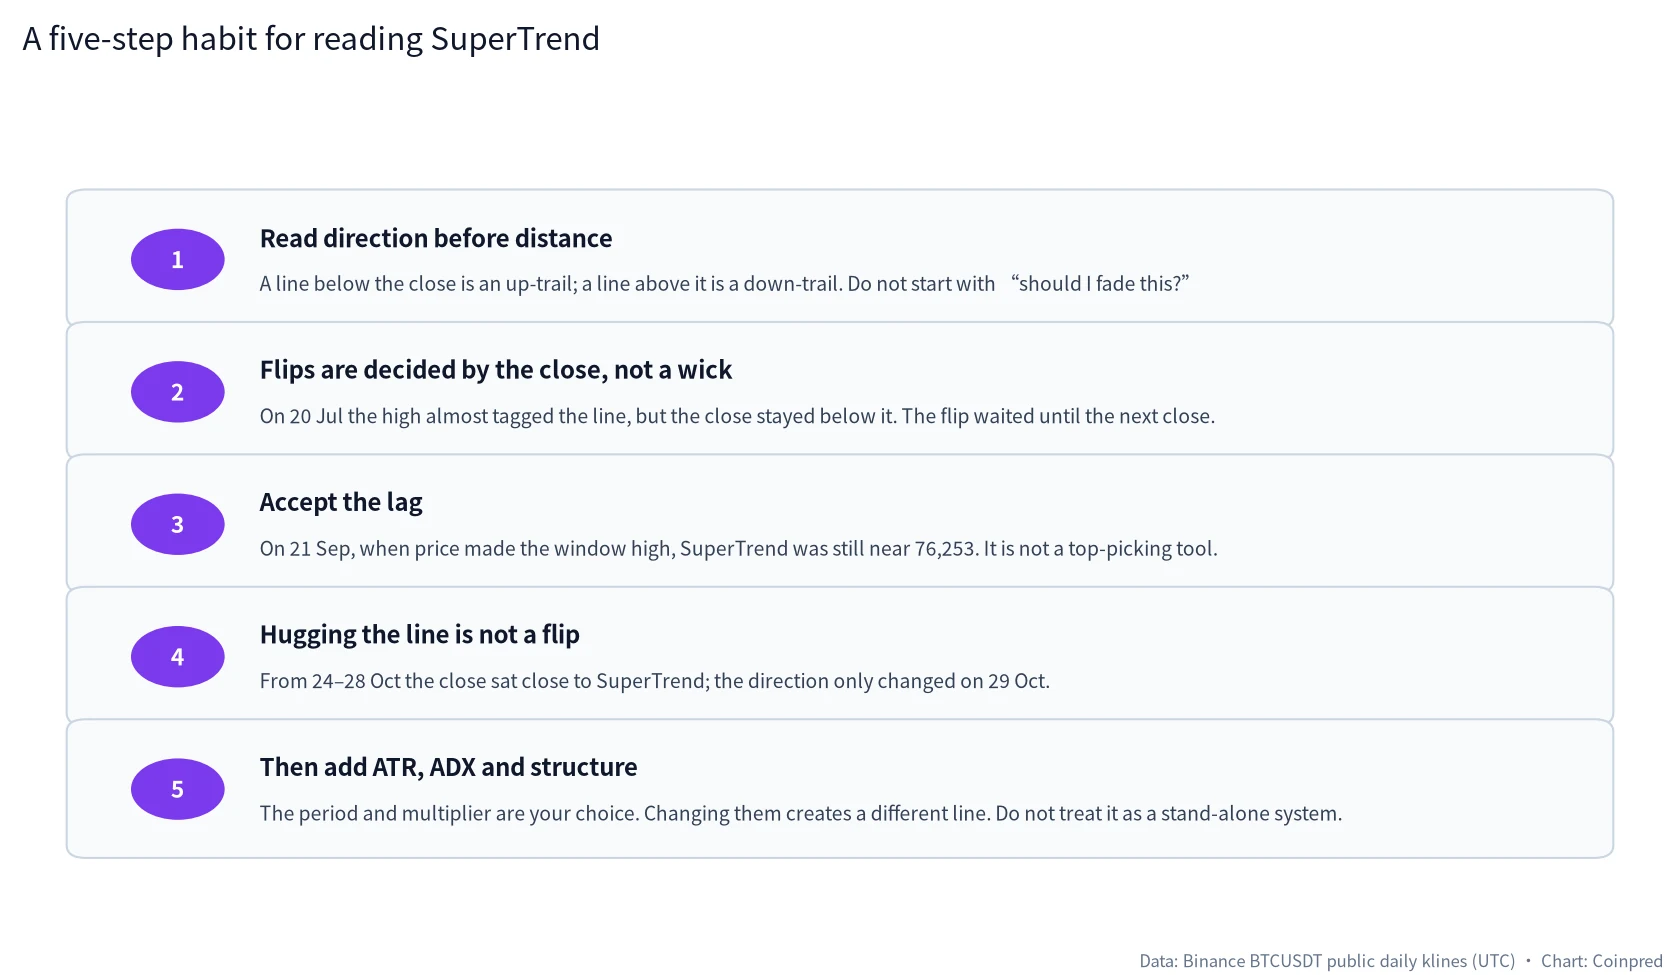
When we sit down with the daily chart, we usually follow this order:
- Read direction before distance. A line below the close is an up-trail; a line above it is a down-trail. Do not start with “should I fade this?”
- Flips are decided by the close, not a wick. On 20 July the high almost tagged the line, but the close stayed below it. On 24 and 26 October the lows had already pierced the line; the direction still waited for the 29 October close.
- Accept the lag. On 21 September, when price made the window high, SuperTrend was still near 76,253. It is not a top-picking tool, and it is not a bottom-picking tool.
- Hugging the line is not a flip. From 24 to 28 October the close sat close to 79,663.52. Writing “very near” as “already turned” would have produced the wrong conclusion a week early.
- Then add ATR, ADX and structure. The period and multiplier are your choice; changing them creates a different line. ATR explains where the width comes from, ADX explains how strong the trend is, and support and resistance explain where you are. SuperTrend replaces none of those.
If you only keep one sentence: first ask which side is being trailed, then whether the close has actually gone through, and only then decide whether today’s distance is worth writing down.
9. What we will not do with SuperTrend
- Treat a wick through the line as a flip, and then call the closing confirmation “already too late.”
- On a high such as 21 September, say “the indicator failed” because SuperTrend was far away. A large distance often just means ATR has widened and the trail has been lifted.
- Walk the multiplier from 3 to 2 to 1.5 until the late-October hug “signals earlier.”
- Lift a 15-minute flip into a claim that the daily direction has already changed.
- Use SuperTrend as a substitute for ATR when measuring stop distance, or as a substitute for moving averages when defining structure. It is a trail, not a universal ruler.
- Treat a same-day change in SuperTrend and anchored VWAP as a mandatory “double signal.”
- Use SuperTrend as a stand-alone system. You can write rules if you want; you then have to define the cost of lag, strings of losses, and the difference between spot and perpetual. We are not doing that here.
FAQ
What SuperTrend settings do you use on BTC daily, and are 10 and 3 too slow?
We used ATR(10) and a multiplier of 3 throughout, because those are the defaults most people actually have on a crypto daily chart, and because we wanted the numbers in this article to be checkable. A shorter period or a smaller multiplier will glue the line more tightly to price and will produce more flips. A larger multiplier will lag more, and might have delayed the 29 October flip even further. There is no “correct SuperTrend for Bitcoin.” Pick one set, write it down, and do not retune it mid-review so that the September pullback looks tidier.
If the high has already pierced SuperTrend, can I fade it early?
Not under the definition used in this article. On 20 July the high missed the line by 1.77 and the close stayed below it. On 26 October the low had already moved through 79,663.52 and the close stayed above it. Our own habit is to wait for the close. You can write a separate rule for wicks if you want, but that is no longer this SuperTrend, and you should not use the 21 July and 29 October closing flips as evidence for a wick-based rule.
If SuperTrend is a long way below or above price, is the trend almost over?
There is no such distance cap. On 21 September the close was about 10,367 above SuperTrend, and the up-trail was still in force afterwards. On 20 November the close was about 10,110 below the down SuperTrend, and as of this article’s cutoff the direction had not flipped again. A large distance first says that ATR has widened the buffer, or that price has travelled a long way from the trail. It is not a countdown.
Why did SuperTrend jump to 86,016.92 on the 29 October flip?
Because once the direction changes, the trail switches from the lower band to the upper band. Before 29 October the up-trail was the already-flat 79,663.52; after the flip, the down-trail is the upper band computed that day, so the chart shows a gap. That is the algorithm changing sides. It is not a price gap, and it is not a missing bar of data.
How should SuperTrend be used with ATR, ADX and moving averages?
ATR is the raw material; read ATR first if you want to know why the band suddenly widened or tightened. ADX answers how strong a trend is and does not draw a trailing stop. Moving averages answer where the close sits relative to an average, and they do not switch to a one-sided trail when crossed. Ichimoku is another structure again. They can all sit on the same chart. Do not let one of them vote on whether another is “valid.”
Can I use this article on a 15-minute or 1-hour BTC chart?
You can draw the same 10, 3 SuperTrend on any time frame. You cannot port the dates or the conclusions. Ten bars on the 1-hour chart are ten hours, not ten trading days. Flips will arrive more often; the lag will still be there, only shorter. Our own order is still daily first.
Can SuperTrend alone be turned into a trading system?
You can write one. You then have to define whether you only enter on a closing flip, how you cut size when ATR suddenly widens, and how you handle a stretch such as late October, when the close hugged the line for days. On this BTC daily sample, fading every close approach would have taken you out between 24 and 28 October; treating the 21 September “large distance” as a top would have faded an up-trail that was still in force. Those are the failure modes. This article is for study and review only.
Can SuperTrend tell me how to pick an event contract, or what direction JEV will print?
Only indirectly. Event contracts have their own expiry, settlement index and payout rules; if that is the product you are studying, start with the BTC event-contract note. JEV is a separate five-bucket directional read, and its confidence is not a win rate. SuperTrend can be one piece of market context we feed a model, or one piece of context we use when we read the chart ourselves. It is not a settlement forecast.
Data and references
- Candles: Binance’s public BTCUSDT daily endpoint, UTC, main window 2026-07-01 through 2026-11-20. 21 November was still an open session when this was written, so it is not treated as a complete day.
- Indicator: SuperTrend with ATR period 10 and multiplier 3. ATR is Wilder-smoothed (a simple average of the first ten true ranges, then an RMA). Basic bands = HL2 ± 3 × ATR, then ratcheted into a one-way trail; direction is decided by whether the close crosses the trail.
- SuperTrend is a common ATR-trail construction. Packages can differ slightly in how the basic bands are locked and whether the close is the only flip rule. The implementation above is the convention we used for the figures in this article; it is not a broker’s or an exchange’s internal definition.
- Adjacent tutorials already in this series: candlesticks, support and resistance, moving averages, RSI, MACD, Bollinger Bands, volume, Fibonacci, Stochastic, ATR, ADX, Ichimoku, and the companion VWAP tutorial.
All charts were drawn by Coinpred from the public data above. If a date or a figure does not match your own recalculation, write to us via the author page or the contact listed there (@constcaoq). Trading involves risk; make your own decisions and size them carefully. This article is for education only and is not investment advice. Coinpred does not provide services to users in mainland China.