On coinpred.com this is the fifteenth piece in our indicator tutorial series. We are the Coinpred editorial team — the same group that maintains the guides and the author page. After we published the RSI tutorial, a recurring question showed up in our own notes: if the Relative Strength Index already compresses momentum into a 0–100 line, why does Stochastic still sit on the same desk?
Because the two tools are not answering the same question. RSI asks how one-sided recent closes have been. Stochastic asks something more local: of the high–low box of the last 14 daily sessions, where did this close actually land? A market can print a strong RSI and a middling Stochastic at the same time, or the other way around. We keep both, and we read them ourselves before we ever lean on a model output.
Every figure below is computed from Binance’s public BTCUSDT daily klines, in UTC. The settings are the common slow Stochastic (14, 3, 3). The main window is 2026-07-01 through 2026-11-18. 19 November was still trading when we drafted this, so that unfinished session is not treated as a complete day. You can download the same series and recompute. This is a reading guide, not a trading system, and it is not investment advice.
1. What %K and %D are actually measuring
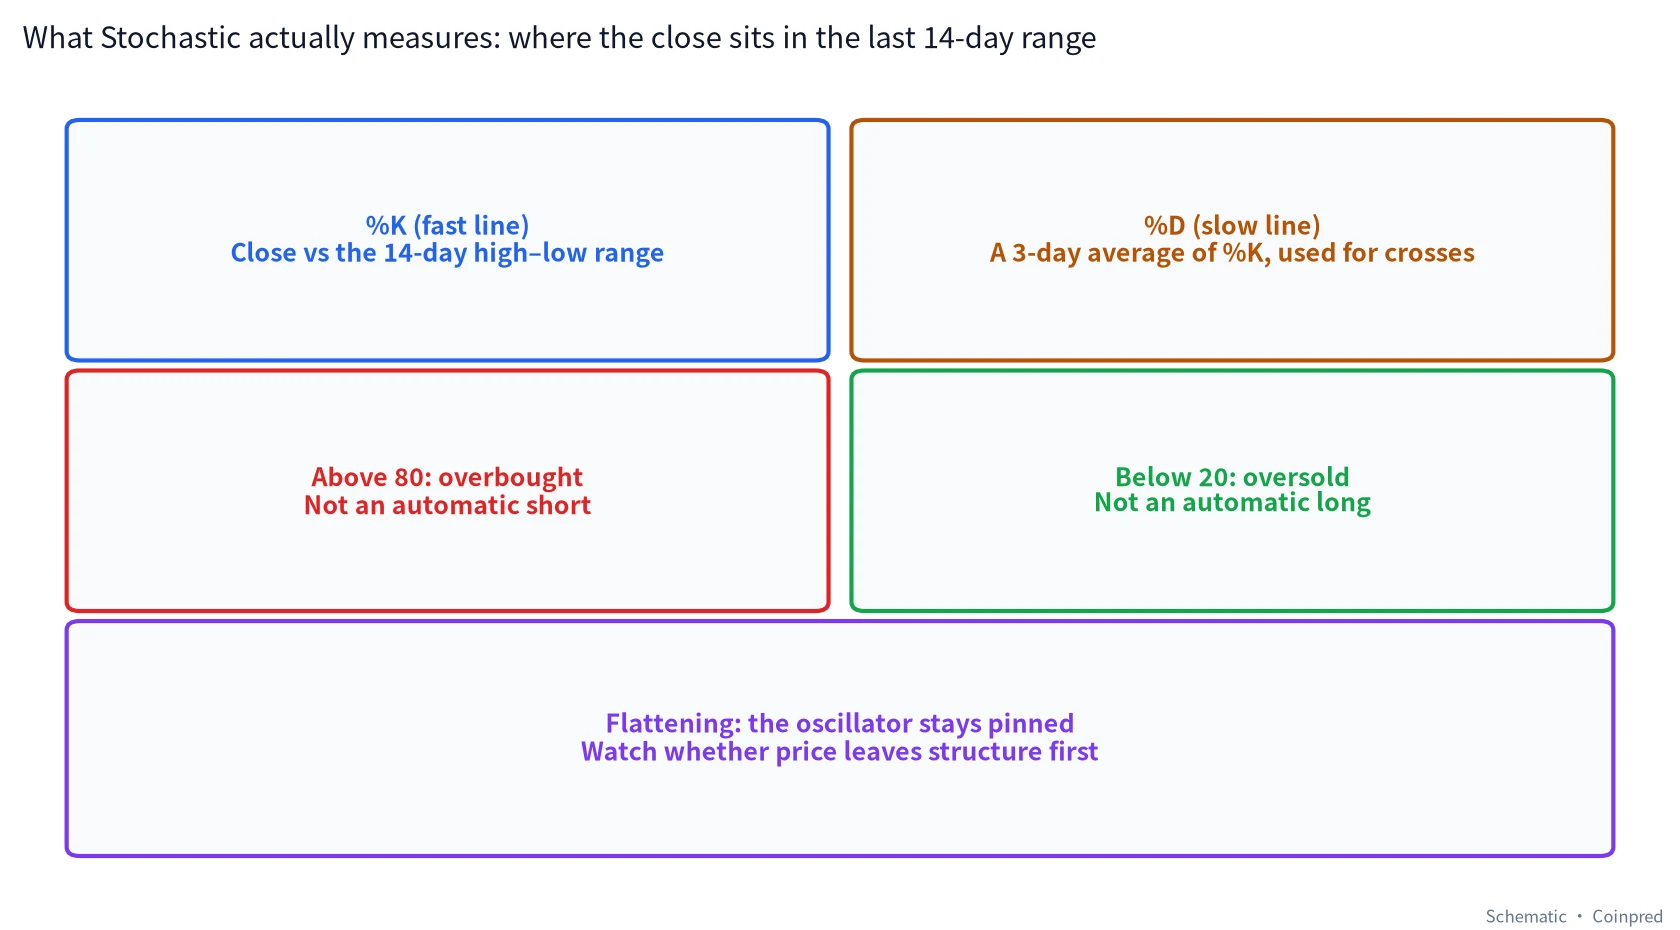
The raw ingredient is sometimes called Fast %K:
Fast %K = (Close − 14-day lowest low) / (14-day highest high − 14-day lowest low) × 100
If the denominator is zero — a 14-day stretch with no range at all, which almost never happens on BTC daily — we treat Fast %K as 0. The line we actually plot as %K is a 3-day simple average of Fast %K. %D is a 3-day simple average of that %K. That is the “(14, 3, 3)” you see on most crypto charts. It is the slow Stochastic, not the unsmoothed fast version.
A worked example from a day people still remember. On 19 August 2026 BTC closed at 69,334.79, after a session high of 70,000.00. The 14-day window from 6 Aug through 19 Aug had a highest high of 70,000.00 and a lowest low of 62,535.24. Plug those in:
Fast %K = (69,334.79 − 62,535.24) / (70,000.00 − 62,535.24) × 100 ≈ 91.09
The close was sitting near the top of its own two-week box. The smoothed %K on that same day was only 77.85, with %D at 56.28. The average had not fully caught the spike yet. That lag is not a bug. It is why we look at both lines instead of celebrating a single raw print.
We do not treat 80 as a short alarm or 20 as a long alarm. They are neighborhoods. Above 80 we say the close has been living near the top of its recent range — overbought language, not an automatic short. Below 20, the close has been living near the bottom of that box — oversold language, not an automatic bid. The more useful question, in our own reviews, is whether the oscillator stays pinned in that neighborhood while price keeps travelling. That pinned state is what we call flattening, and it is the part of Stochastic that trips people most often.
2. The July–November picture, in one chart
Here is BTC’s daily candle from 1 July through 18 November 2026, with %K, %D, and the 80 / 20 bands underneath:
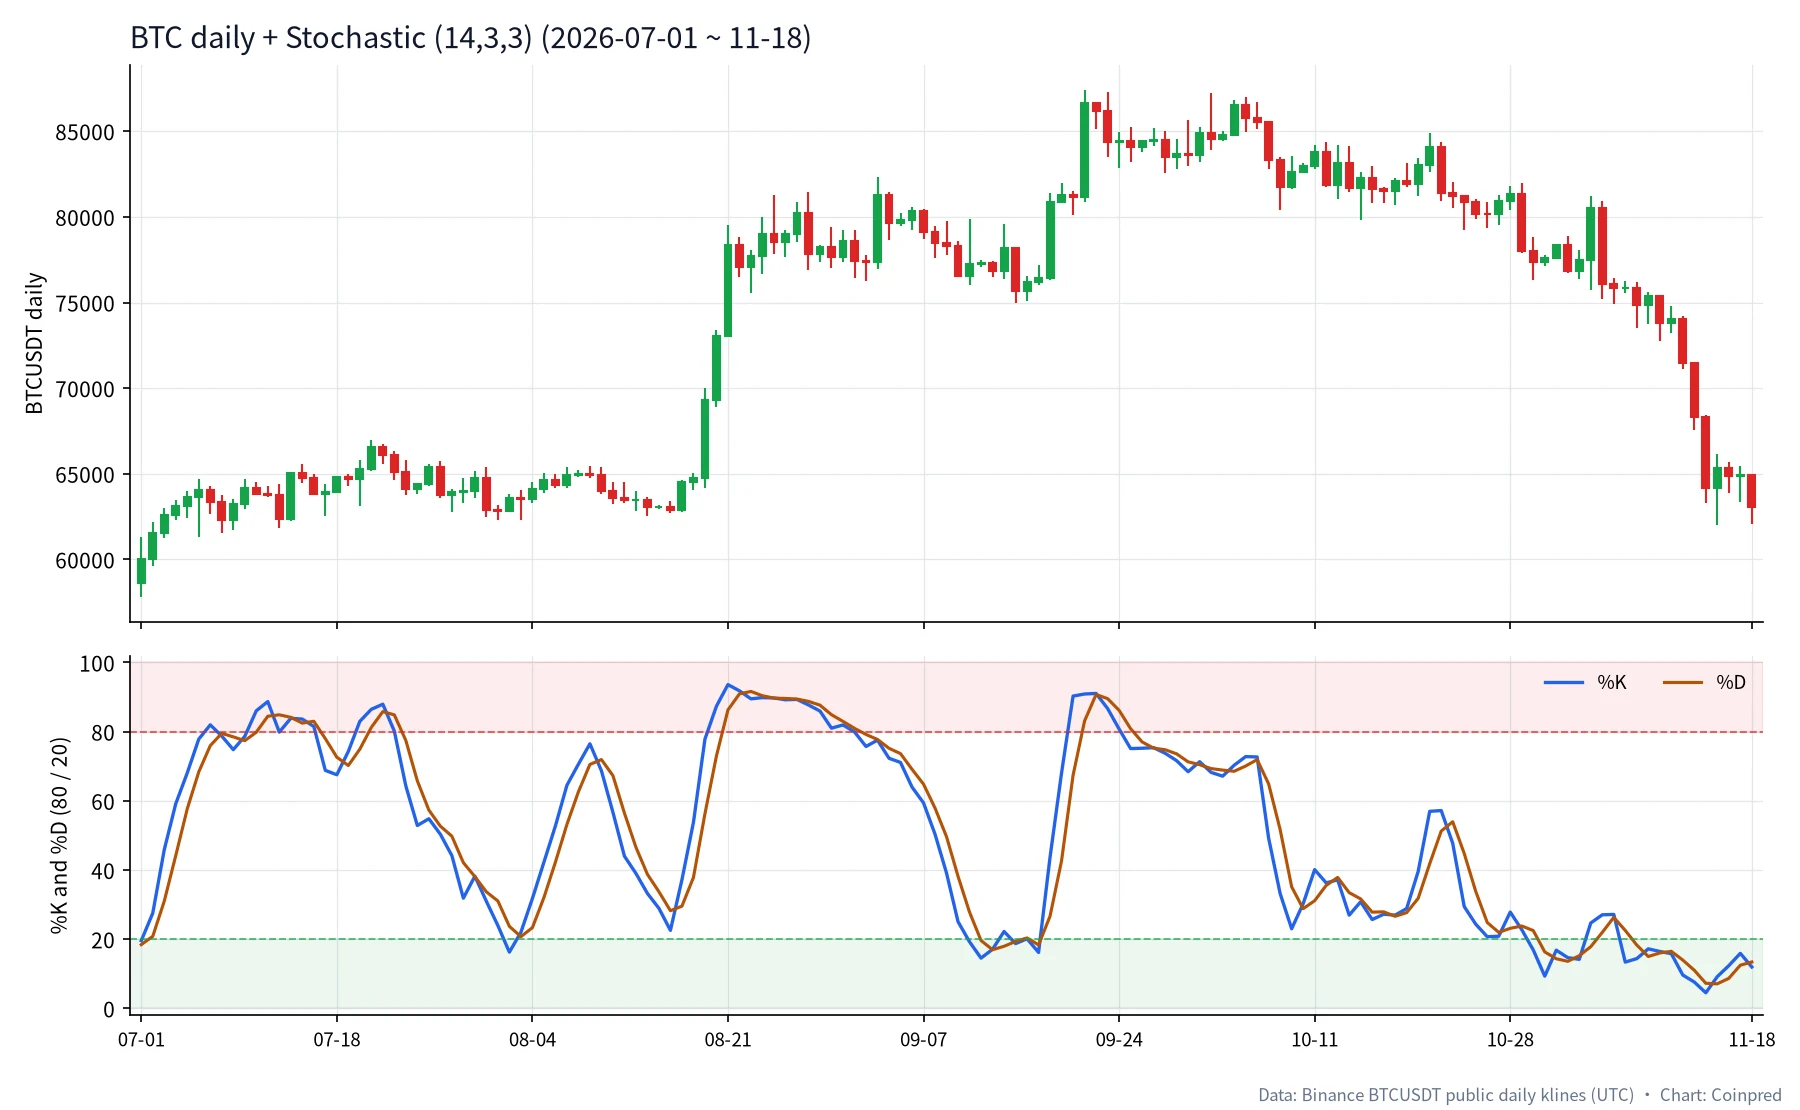
The path is not subtle. Early July still carried the leftover volatility of June’s slide, with the close near 60,024 on the 1st. Through mid-August the market spent most of its time in a rough 62k–66k band. Then mid-to-late August shoved price into the high 70s and, by 21 September, a session high of 87,395.67. October tried to revisit that neighborhood and failed to confirm it on the oscillator, which we will unpack below. November gave back a large part of the autumn rally: the 18 Nov close was 63,068.22.
Inside that 141-day window, %K spent 27 sessions at or above 80 and 24 sessions at or below 20. Two of those stays were long enough to be the real lesson of this article: 20–31 August, twelve sessions pinned in overbought while price was still grinding higher, and 7–18 November, twelve sessions pinned in oversold while price was still falling. If you only remember “buy 20, sell 80,” those two stretches will treat you poorly.
Support and resistance and the moving-average stack are still the frame we put around any oscillator. Stochastic tells us where the close sits in its recent box. It does not tell us whether that box itself is about to be abandoned.
3. Mid-August: a low-zone cross, then a run into overbought
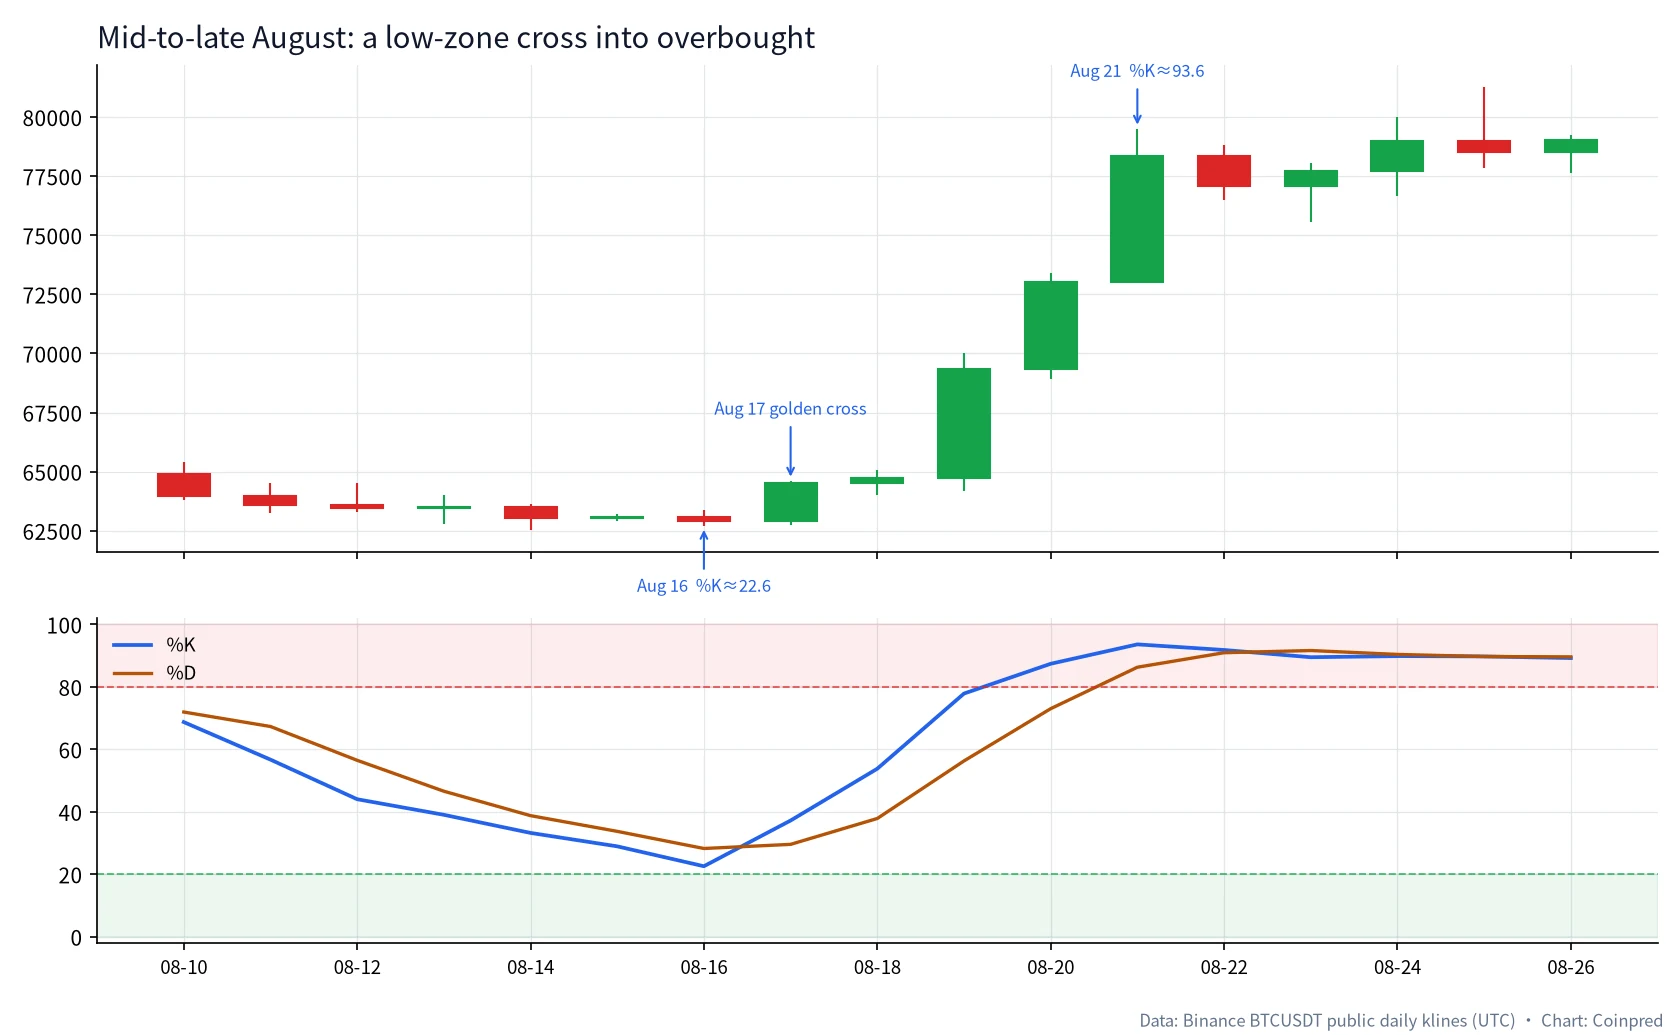
By mid-August the daily range had gone unusually quiet — the same stretch our Bollinger and volume notes already treated as a coiled period, and the same stretch the ATR companion to this article measures from the volatility side. On the Stochastic pane, the close had drifted toward the lower end of its 14-day box.
| Date (UTC) | Open | High | Low | Close | Change | %K | %D | Note |
|---|---|---|---|---|---|---|---|---|
| 08-15 | 63,043.56 | 63,187.98 | 62,920.00 | 63,086.01 | +0.07% | 28.93 | 33.73 | Still mid-low, quiet day |
| 08-16 | 63,086.01 | 63,390.00 | 62,716.00 | 62,900.00 | −0.29% | 22.56 | 28.24 | Closest approach to oversold |
| 08-17 | 62,900.00 | 64,610.01 | 62,751.10 | 64,532.10 | +2.59% | 37.20 | 29.56 | %K crosses above %D |
| 08-18 | 64,532.11 | 65,058.81 | 64,027.85 | 64,725.42 | +0.30% | 53.78 | 37.85 | Cross holds, range still modest |
| 08-19 | 64,725.42 | 70,000.00 | 64,166.00 | 69,334.79 | +7.12% | 77.85 | 56.28 | Close jumps toward the top of the box |
| 08-20 | 69,334.78 | 73,400.00 | 68,902.22 | 73,025.15 | +5.32% | 87.38 | 73.01 | Enters the overbought zone |
| 08-21 | 73,027.02 | 79,500.00 | 73,027.02 | 78,338.03 | +7.28% | 93.60 | 86.28 | Window peak for %K |
The 17 August cross happened around the low-to-mid 30s, not in a textbook oversold pit. That still mattered to us, because it was the first time in several sessions that %K had recaptured %D as the close was leaving the quiet mid-August shelf. On 21 August %K printed about 93.60, the highest reading in the whole July–November sample. A person who shorts “because Stochastic is overbought” would have been leaning against three of the most one-sided daily advances of the year.
We would not have taken that 17 August cross as a standalone entry even in hindsight. We would have asked whether the daily close was also leaving the range we had already marked, and whether volume was actually present. The oscillator was one weight on the table, not the vote.
4. How we handle Stochastic flattening: the 12-day August stall
This is the section people search for when they type “what to do when Stochastic stays overbought.” In Chinese trading slang the word is 钝化 — the line goes dull, pinned at an extreme, and stops being a timing toy.
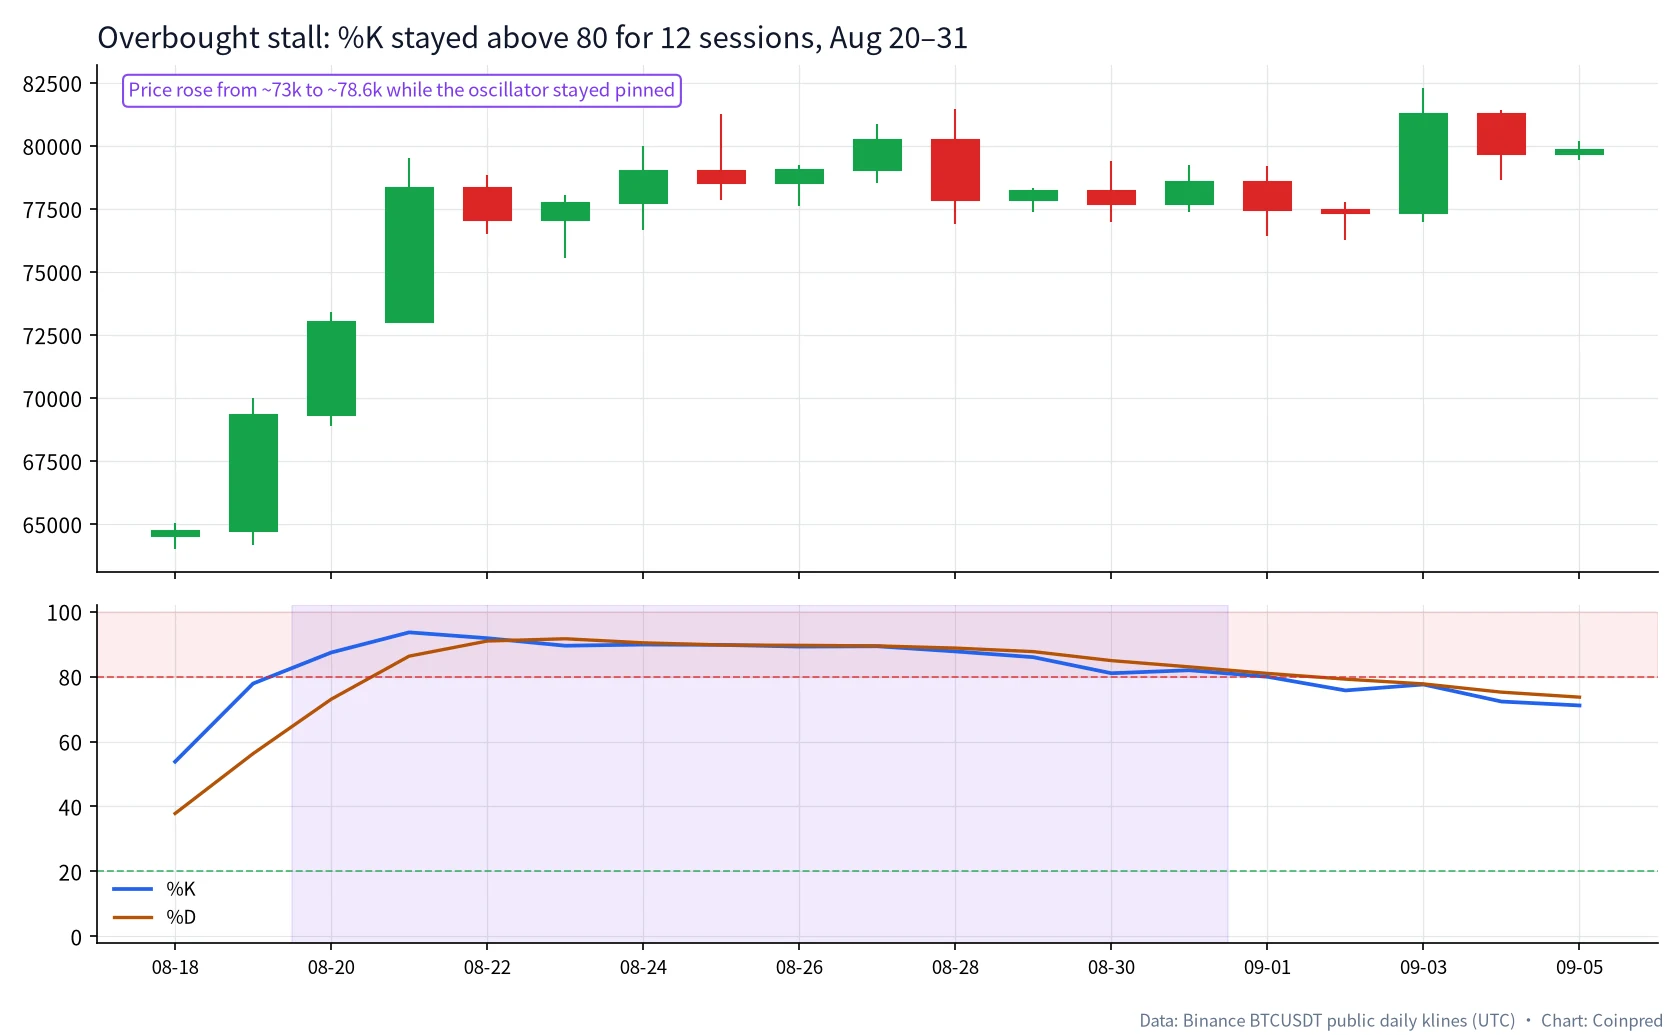
From 20 August through 31 August, %K stayed at or above 80 for twelve sessions. Price was not crashing. The 20 Aug close was 73,025.15; the 31 Aug close was 78,581.29. Inside that window the oscillator did what overbought oscillators do in a strong push: it wriggled, and it printed crosses inside the extreme.
- 23 August: %K slipped under %D while both were still near 90 (89.5 vs 91.6). A “death cross in overbought.”
- 25 August: a tiny recapture (89.74 vs 89.69). A “golden cross in overbought.”
- 26 August: another slip (89.2 vs 89.6).
If you fade every one of those crosses, you are trading noise at the top of a two-week box while the daily close is still holding the breakout. Our working rule, which is a habit rather than a law:
- Once %K has been sitting above 80 (or below 20) for several sessions, we stop treating the level itself as a trigger.
- Crosses that happen inside the extreme get a much lower weight than a cross that happens as the line is leaving the zone.
- We wait for the daily close to lose the structure that supported the move — a break back into the prior range, a decisive close under a level we already care about, or a similar tell from candlesticks and volume — before we talk about the stall being over.
Flattening is information about persistence. It is not a countdown timer. August did eventually cool; %K drifted back through 80 in early September. The useful lesson was not “short the first tick at 80.” It was “the oscillator can stay loud for a dozen days while price is still travelling.”
5. A messy oversold patch in mid-September
Trends do not only flatten at the top. Mid-September gave us a shorter, messier oversold patch that is worth sitting with, because the crosses inside it were not clean.
From 11 to 13 September, %K lived at or under 20. On 13 September it printed a golden cross so tight it is almost embarrassing to call it a cross: %K 17.13 vs %D 17.00, with a close of 76,842.01. Two sessions later, on 15 September, %K crossed back under %D, still in the oversold neighborhood (18.74 vs 19.35), and the session itself was heavy: open 78,189.20, low 74,967.97, close 75,644.48, about −3.25%.
Then the tape flipped. On 18 September %K recaptured %D in the mid zone (43.76 vs 26.69) and BTC closed 80,883.87, up about 5.85%, on a true range of more than 5,000 dollars. The mid-September oversold gold cross did not mark the low. The mid-zone recapture three days after a hard down day is the event that actually lined up with a change in the close.
We take a specific lesson from that week, and it is the same lesson as August, just upside down: an oversold golden cross is a location, not a filled bid. If you want a date where Stochastic was merely describing a cheap close inside a falling two-week box, 15 September is a clean one. If you want a date where the close and the cross moved together, look at the 18th, and still put a Fibonacci or structure overlay on that swing before you tell a story about “the oscillator calling the turn.”
6. Failed confirmation: September’s high, October’s retest
Textbook bearish divergence is usually taught as “price makes a higher high, the oscillator makes a lower high.” Real charts are sloppier than the textbook. We would rather describe this one honestly than force the label.
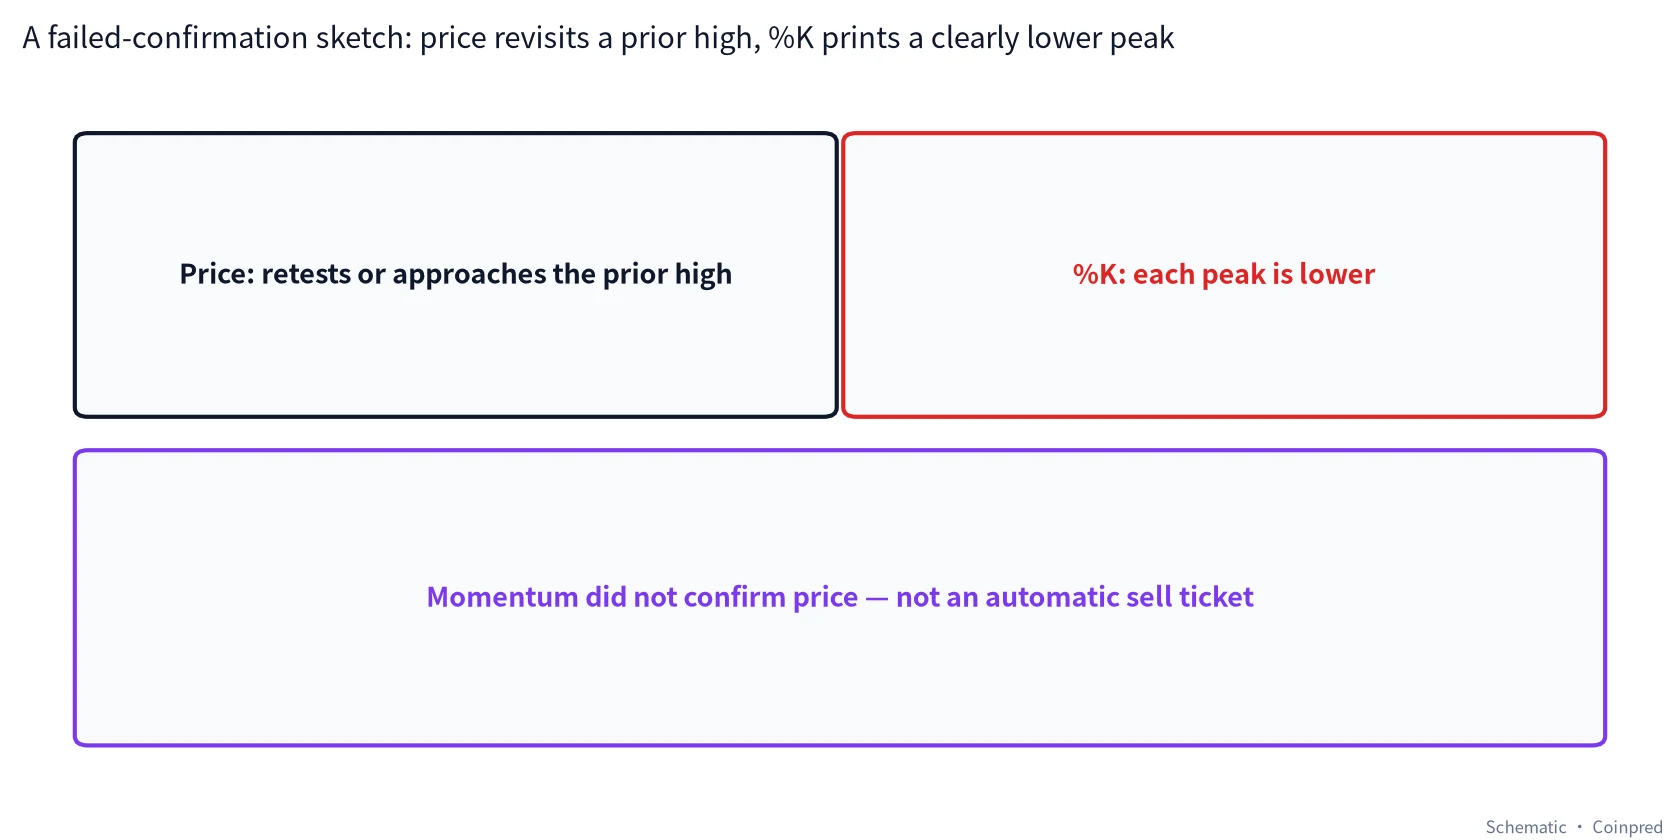
On 21 September BTC printed the highest intra-day print in our July–November window: 87,395.67, closing at 86,620.00, with %K at 90.88. The next day, %K ticked up one more notch to 91.05 even as the close slipped to 86,208.56. That is the oscillator’s local peak.
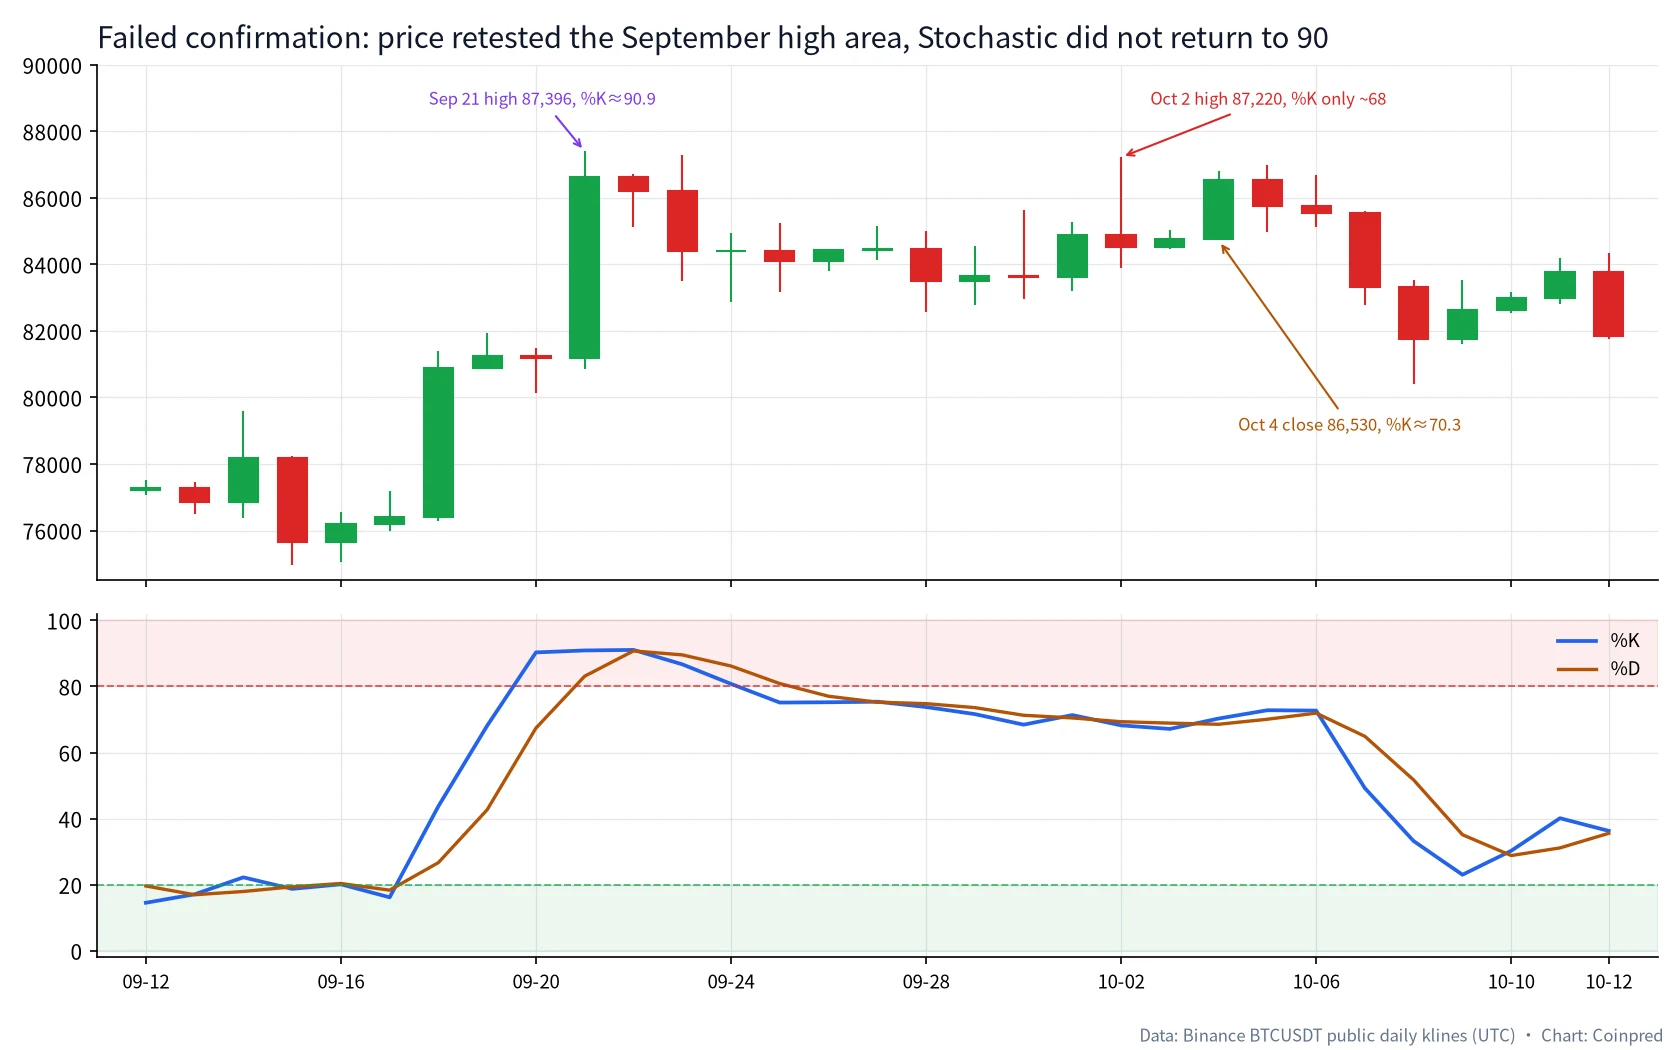
| Date (UTC) | High | Close | %K | %D | What we marked |
|---|---|---|---|---|---|
| 09-21 | 87,395.67 | 86,620.00 | 90.88 | 83.10 | Swing high, oscillator still in the 90s |
| 09-22 | 86,717.60 | 86,208.56 | 91.05 | 90.74 | %K peak |
| 10-02 | 87,220.00 | 84,518.01 | 68.22 | 69.32 | Almost a retest of the Sep 21 high; %K only in the high 60s |
| 10-04 | 86,800.00 | 86,530.00 | 70.28 | 68.54 | Close almost back to the Sep 21 close; %K only ~70 |
| 10-05 | 86,999.11 | 85,766.87 | 72.79 | 70.07 | Local %K high of the October bounce — still far from 90 |
| 10-07 | 85,598.22 | 83,321.81 | 49.19 | 64.89 | %K loses %D; close drops 2.60% |
The 2 October wick at 87,220 came within about 176 dollars of the 21 September high. It was not a higher high. It was a serious retest of the same neighborhood. The oscillator, however, only made it back to the high 60s on that day, and only to about 72.79 on 5 October. Price returned to the scene of the September high. Stochastic did not.
That is the reading we actually wrote in our notes: failed confirmation, not a textbook higher-high divergence. The practical effect is the same kind of caution. We lowered one-sided confidence that the autumn high was still being supported by the same kind of closes that printed it. On 7–8 October the close gave back more of the bounce. We still would not have treated 2 October as an automatic short ticket. We would have waited for the close to lose nearby structure, and we would have asked the MACD pane whether momentum agreed.
7. November: oversold flattening the other way
If August was the stall at the top, November was the stall at the bottom, and it was less forgiving for anyone who treats “%K under 20” as a reason to buy dips.
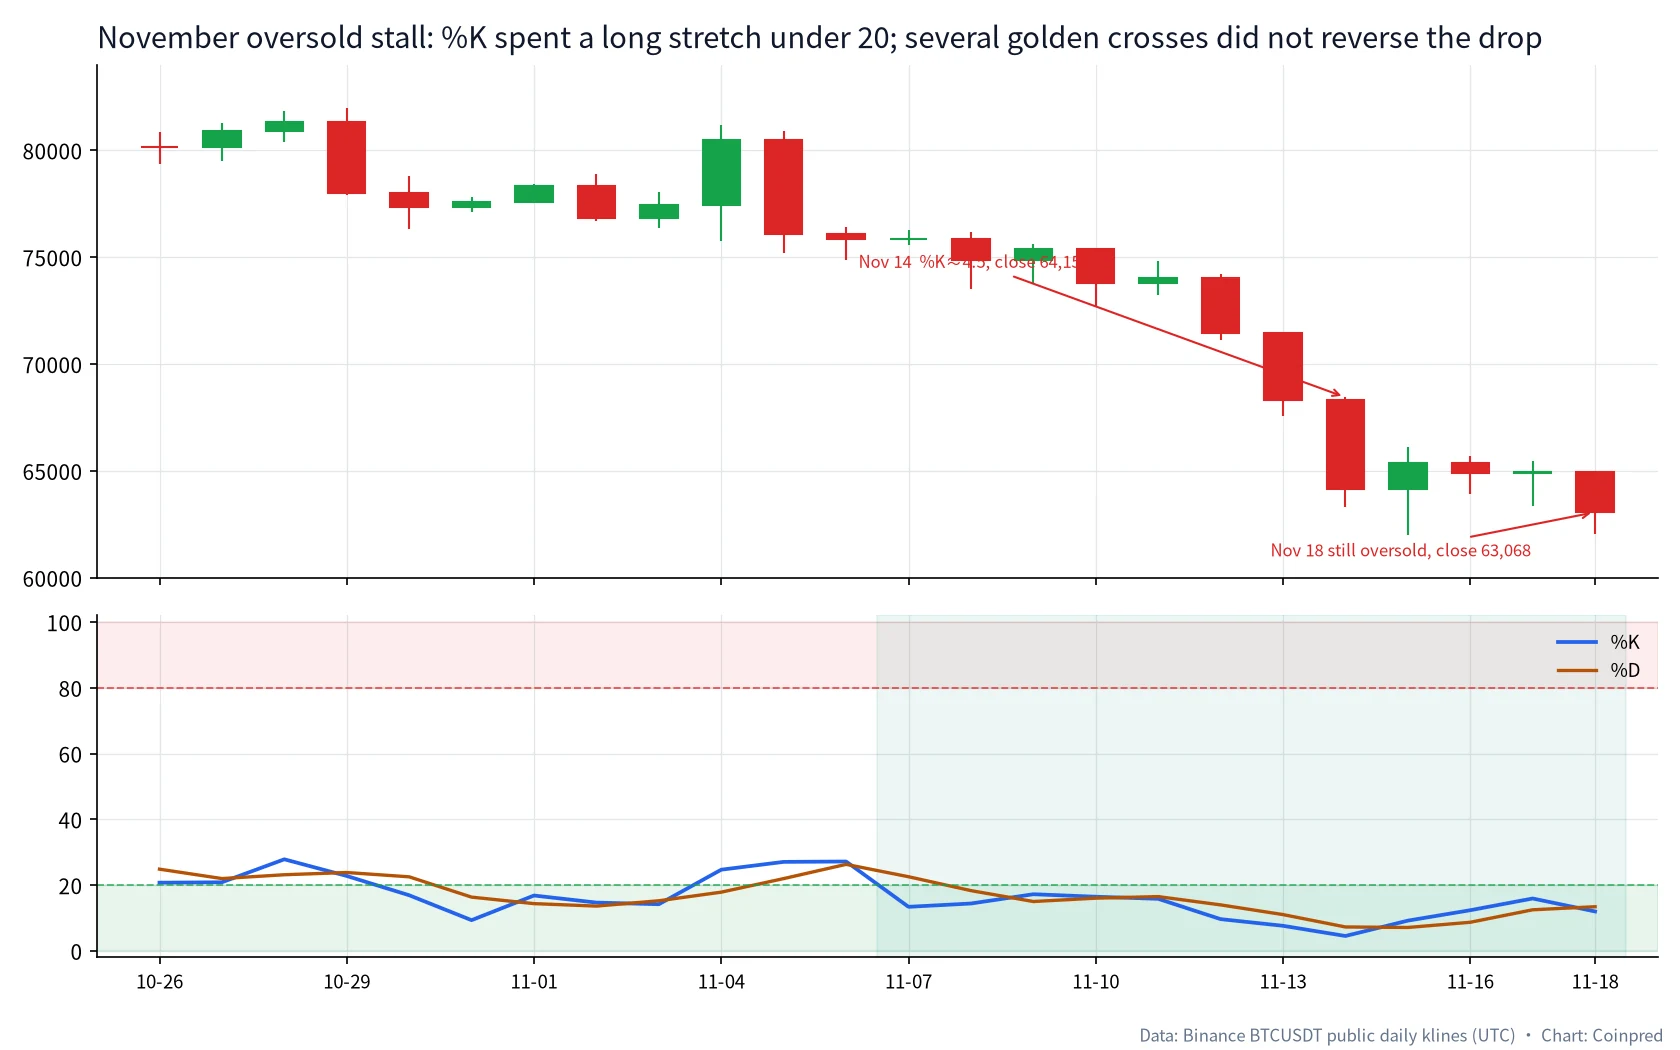
The slide did not start as a clean cliff. On 4 November BTC actually rallied hard: open 77,453.85, high 81,196.01, close 80,504.01, about +3.94%. Stochastic barely noticed in the way a dip-buyer hoped it would. %K only reached 24.68. The bounce never even lifted the oscillator out of the lower third of its scale. The next session, 5 November, gave almost all of it back: close 76,088.01, about −5.49%, on a true range of about 5,710.
From 7 November through 18 November, %K stayed at or under 20 for twelve sessions. Price kept travelling lower.
| Date (UTC) | Close | Change | %K | %D | Note |
|---|---|---|---|---|---|
| 11-04 | 80,504.01 | +3.94% | 24.68 | 17.85 | Bounce; oscillator stays heavy |
| 11-05 | 76,088.01 | −5.49% | 27.06 | 21.97 | Large down day after the bounce |
| 11-07 | 75,867.59 | +0.03% | 13.39 | 22.54 | Start of the 12-day oversold stay |
| 11-09 | 75,368.41 | +0.69% | 17.22 | 15.00 | Golden cross still inside oversold |
| 11-12 | 71,460.00 | −3.45% | 9.65 | 13.98 | %K under 10 |
| 11-13 | 68,314.00 | −4.40% | 7.62 | 11.03 | Still falling |
| 11-14 | 64,150.00 | −6.10% | 4.52 | 7.26 | Window low for %K; close 64,150 |
| 11-15 | 65,351.05 | +1.87% | 9.18 | 7.11 | Another oversold golden cross |
| 11-18 | 63,068.22 | −2.89% | 11.98 | 13.42 | Death cross, still oversold |
Two golden crosses fired inside this pit, on the 9th and the 15th. Neither ended the decline. The 15 November recapture happened with %K at 9.18 and %D at 7.11, after the 14 November close of 64,150.00 had already printed the weakest %K of the whole sample, about 4.52. The 14-day box that day ran from a high of 81,196.01 (4 Nov) down to a low of 63,320.00 — the close was sitting right on the floor of its own two-week range. Three sessions later the close was 63,068.22, and %K had crossed back under %D, still below 20.
This is the sentence we want a reader to leave with: oversold can persist the same way overbought can persist. In a determined decline, Stochastic will keep telling you that the close is near the bottom of its recent box, because that is literally true, day after day, as the box itself slides lower. Buying the first tick under 20, or the first oversold golden cross, would have been a bet that persistence had already ended. On this tape, it had not.
8. Stochastic next to RSI, and how we use both on Coinpred
We are often asked which oscillator is “better.” That is the wrong shape of question. RSI is built from average gains and losses of the close. Stochastic is built from where the close sits in a high–low envelope. RSI is usually the smoother of the two; Stochastic will twitch earlier when a few sessions stretch the box. There are weeks when they rhyme, and weeks when RSI is still mid-range while %K is already hugging 20, because the recent range has shifted faster than the average gain/loss has.
On the Coinpred terminal, both of them sit among the twelve indicators we assemble as context for a JEV analysis. That does not mean the model “is” Stochastic, and it does not mean a Stochastic cross is a JEV direction. It means that when we, as the editorial team, sit down to read a daily BTC chart, we still do the boring human work first: candles, structure, moving averages, volume, then the oscillators, and only then a model pass if we want a second structuring of the same public tape. The how-to-use guide walks through that order.
A practical pairing we actually use:
- If Stochastic is pinned at an extreme and RSI is also stretched in the same direction, we treat the stall as more persistent, not as a stronger fade.
- If Stochastic has already rolled over while RSI is still holding a mid-range slope, we go looking for failed confirmation on the price highs or lows, as in early October.
- If the two disagree loudly, we do not break the tie with a third oscillator. We go back to the daily candle and the levels.
9. Timeframes: keep the clock honest
Everything in this article is BTCUSDT daily, UTC. A 15-minute %K under 20 during a London lunch hour is a different object from a daily %K under 20 after twelve sessions of lower closes. We have no patience for a screenshot that borrows a daily conclusion and plants it on a 5-minute cross.
If you read Stochastic on the 4-hour or the 1-hour, say so, and accept that the 14-bar box is now 14 hours or 14 four-hour bars, not two weeks. Flattening still happens on those clocks, just faster. Our habit is top-down: daily first, then a lower timeframe only to refine a level we already care about. We would rather miss a noisy 15-minute recapture than talk ourselves into a daily fade with a lower-timeframe cross.
10. A five-step Stochastic habit
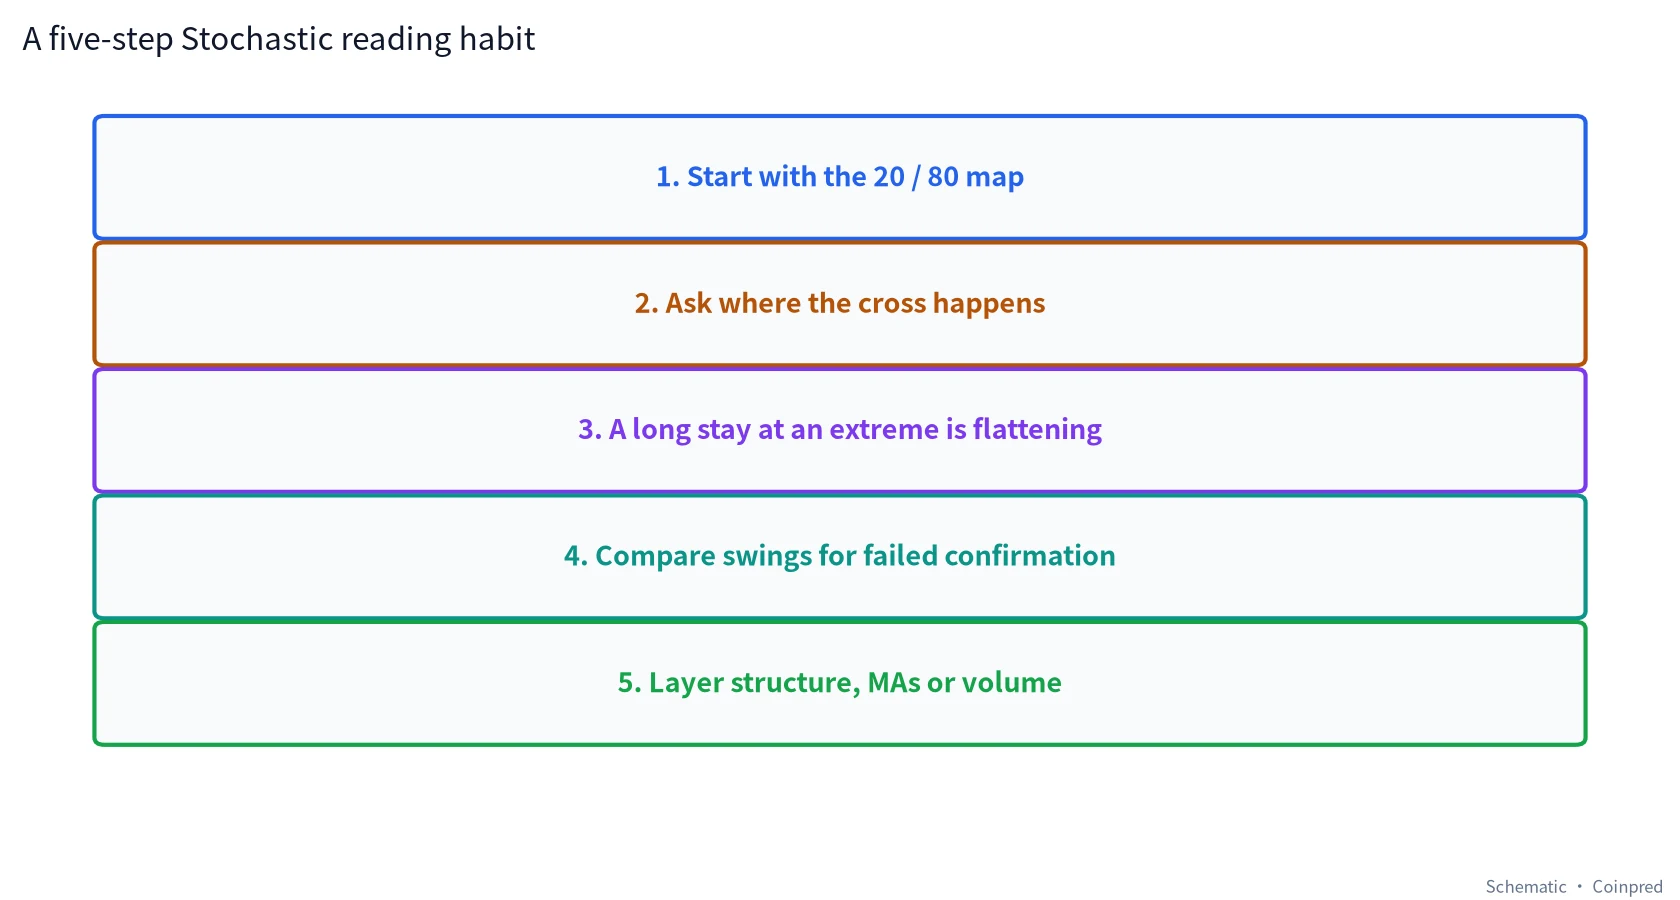
- Start with the 20 / 80 map. Is %K in the upper neighborhood, the lower neighborhood, or the middle? Do not skip this just to hunt for a cross.
- Ask where the cross happens. A recapture near 20 is not the same event as a slip near 80, and neither is the same as a mid-zone wriggle. August 17 and November 15 were both “golden crosses.” They did not rhyme.
- If the line has been pinned for several sessions, call it flattening and stop fading the level. Twelve days above 80 in August, twelve days below 20 in November.
- Compare swings. When price comes back to a prior high or low and %K clearly does not, lower one-sided confidence. Describe it honestly if it is a retest rather than a textbook higher high.
- Layer structure, moving averages, or volume before you tell a story. Stochastic is a weight. The range still decides whether a move has anywhere to go.
11. Common traps we still catch ourselves circling
- Shorting the first print above 80 in a strong advance, or buying the first print below 20 in a determined decline.
- Treating every %K/%D cross as a decision, especially the ones that fire inside an already-extreme zone.
- Changing the lookback from 14 to 9 to 21 until the picture “agrees” with a trade you already wanted.
- Mixing a fast Stochastic (unsmoothed %K) with a slow (14, 3, 3) without saying so, then arguing with someone else’s numbers.
- Porting a 15-minute oversold reading onto the daily close.
- Forgetting that a 14-day box moves. In November the box itself was sliding lower, so “close near the low of the box” stayed true for days.
- Using Stochastic as a stand-alone system. You can write rules if you want; you then have to define failure, costs, and the difference between spot and perpetual. We are not doing that here.
FAQ
What Stochastic settings do you use on BTC daily, and should I switch to (5, 3, 3) or (21, 3, 3)?
We used (14, 3, 3) throughout, because that is the default most people actually have on a crypto daily chart, and because we wanted the numbers in this article to be checkable. A shorter lookback will twitch more and will tag 80 and 20 more often. A longer lookback will flatten even more. None of those choices is “the correct Stochastic for Bitcoin.” Pick one, write it down, and do not retune it mid-review so that August’s stall disappears.
Is a Stochastic golden cross a buy signal on BTC?
No. Not in our work. 17 August was a useful recapture because the close was also leaving a quiet shelf. 13 September and 15 November were golden crosses inside oversold, and the close was not done travelling. A cross is a change in the relationship between two smoothed lines. It does not know your inventory and it does not owe you a bounce.
How do you handle Stochastic flattening, or a long stay above 80 / below 20?
We rename the event. It is no longer “overbought, so fade,” or “oversold, so buy.” It is “the close has been persistent at one end of its recent range.” We wait for a decisive leave of that zone, and we want the daily close to lose or recapture a level we already marked. If you need a single sentence: stop using the extreme as a trigger, and start using it as a description of persistence.
How long can BTC stay overbought on the daily Stochastic?
Longer than a short-term trader’s patience. In this sample, 20–31 August ran twelve sessions above 80 while the close moved from about 73,025 to about 78,581. We do not have a maximum. We have a refusal to treat “already long” as “must reverse tomorrow.”
Stochastic vs RSI for crypto: which should I read first?
We read structure first, then both oscillators, and we let them disagree out loud. RSI is usually calmer. Stochastic will often flag that the close is hugging one end of the recent range before RSI looks dramatic. If you only have room for one pane, use the one you will actually compute the same way every time. If you have room for two, do not break a tie between them by inventing a third.
Was the September–October episode a classic bearish divergence?
Not in the strict “higher high in price, lower high in the oscillator” sense. The 2 October high at 87,220 was slightly below the 21 September high at 87,395.67. It was a retest of the same neighborhood, and Stochastic failed to return to the 90s. We called it failed confirmation and lowered confidence. We did not pretend the wick had made a new high just to fit the textbook.
Can I use this the same way on a 15-minute or 1-hour BTC chart?
You can plot the same (14, 3, 3) on any clock. You cannot import this article’s dates and conclusions onto that clock. A 14-bar box on the 15-minute chart is three and a half hours, not two weeks. Flattening still happens; it just expires faster. Our own order is daily first.
Why do %K and %D sometimes look glued together?
Because %D is a 3-day average of %K. When %K itself stops moving — which is exactly what flattening looks like — %D will sit on top of it. Those tiny crosses in late August, all of them near 89–91, are what “glued together” looks like in practice. They are a reason to do less, not more.
Can Stochastic alone be a trading system?
You can write one. You will need a definition of a missed stall, a rule for when a mid-zone cross is ignored, a position-size rule for when ATR is expanding (see the companion ATR tutorial), and an honest cost model. Chasing every extreme on BTC daily would have faded August and bought November. That is the failure mode. Everything in this article is for education and review.
Does a Stochastic reading tell me anything about an event contract or a JEV direction?
Only indirectly. An event contract has its own expiry, settlement index and payout rules — start with the BTC event contract guide if that is the product you are studying. JEV is a separate five-direction assessment with a confidence number that is not a win rate. Stochastic can be part of the market context we feed the model, and part of the context we read by hand. It is not a settlement forecast.
Data and references
- Klines: Binance public API, BTCUSDT daily, UTC, primarily 2026-07-01 to 2026-11-18. The 19 November session was still open at the time of writing and is excluded as an unfinished day.
- Oscillator: slow Stochastic (14, 3, 3) — Fast %K over 14 sessions, %K = 3-day SMA of Fast %K, %D = 3-day SMA of %K.
- The Stochastic oscillator is associated with George Lane’s mid-20th-century work on range-relative closes. The implementation above is the common charting default, not a claim about any particular broker’s internals.
- Earlier pieces in this Coinpred series, when you want the neighboring tools: candlesticks, support and resistance, moving averages, RSI, MACD, Bollinger Bands, volume, Fibonacci, and the companion ATR tutorial.
All charts were drawn by Coinpred from the public data above. If you spot a date or a figure that does not recompute, write to us through the authors page or via the contact route listed there (@xbluev). Trading involves risk — decide independently and size carefully. This article is educational only and is not investment advice. Coinpred is not available to users in mainland China.