We have already covered candlesticks, support and resistance, moving averages, RSI, MACD, and Bollinger Bands. One strip still sits at the bottom of almost every chart and still gets treated like decoration: volume.
In our own reviews, volume is not a crystal ball for “tomorrow’s direction.” It answers a simpler question: did enough people actually trade this up-move or down-move? A thin gap and a three-times-average surge can print similar candles; they do not deserve the same confidence.
Every figure below comes from Binance’s public BTCUSDT daily klines (UTC). We use VMA20 (the simple 20-day average of volume) and OBV (On-Balance Volume: add volume on up closes, subtract on down closes). You can download the same series and recompute. The main window is 2026-07-01 through 2026-10-31 (1 Nov was still trading when we drafted, so that partial day is not treated as a finished session).
1. Four volume-price patterns worth keeping in mind
We do not memorize dozens of slogans. Four patterns cover most of what we care about:
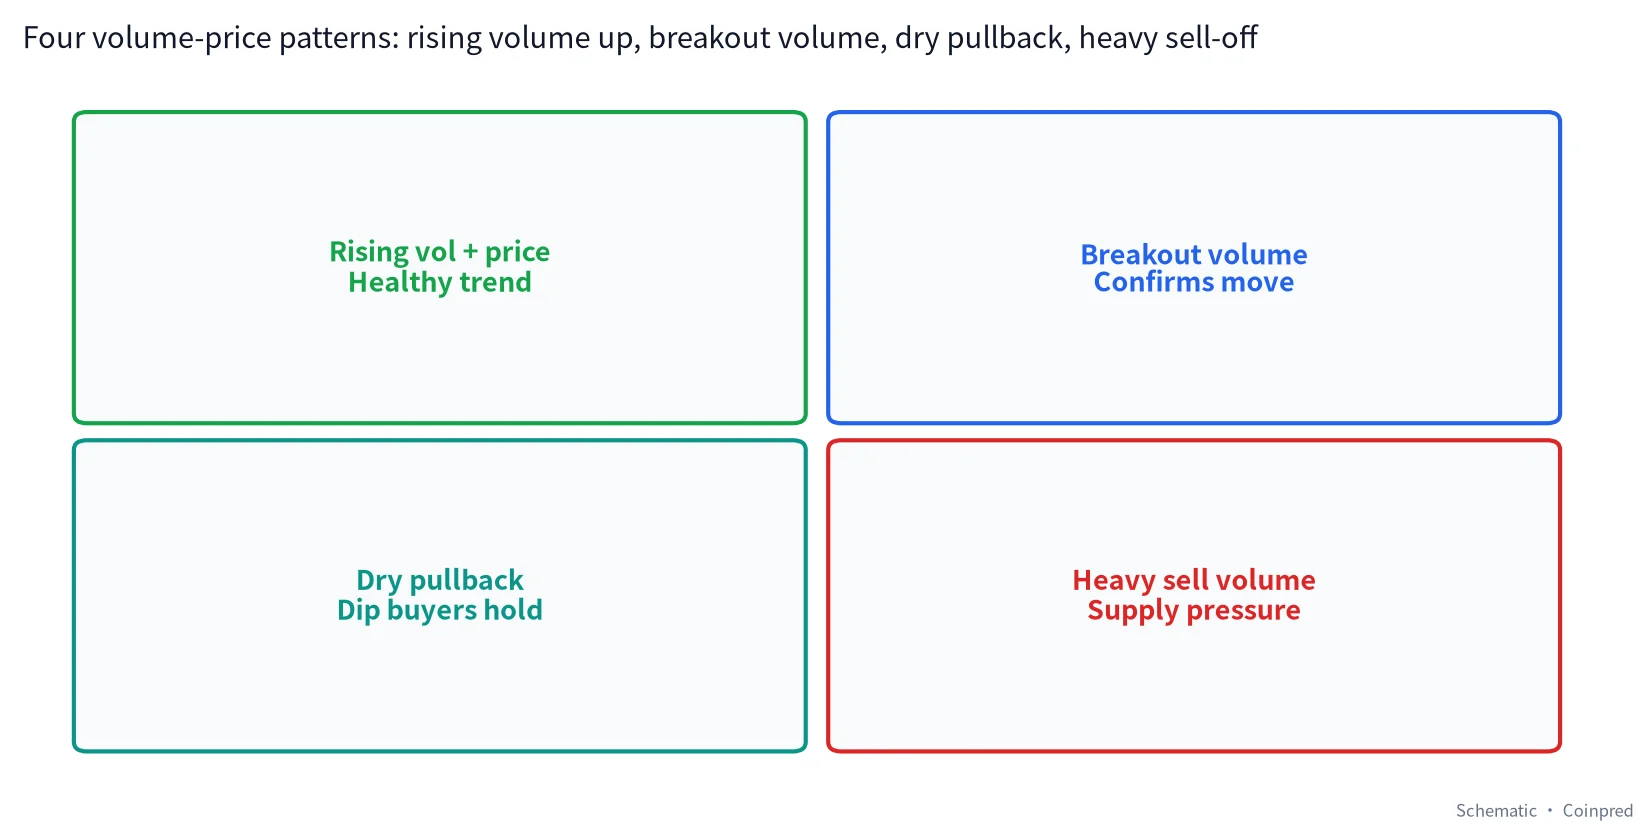
- Rising volume with rising price — participation supports the trend.
- Breakout volume — price leaves a range or key level with a clear volume spike.
- Dry pullback — after a breakout, price retraces while volume shrinks (often read as lighter supply; still needs structure confirmation).
- Heavy sell volume — price falls as volume expands — supply is more aggressive.
None of these is an automatic order ticket. Climactic volume can mark exhaustion; a dry drift lower can also precede a sharper break. We treat volume as a weight, then layer structure and the daily close.
2. The big picture: BTC price and volume, Jul–Oct
Here are daily candles, volume bars, and VMA20 from 1 Jul through 31 Oct 2026:
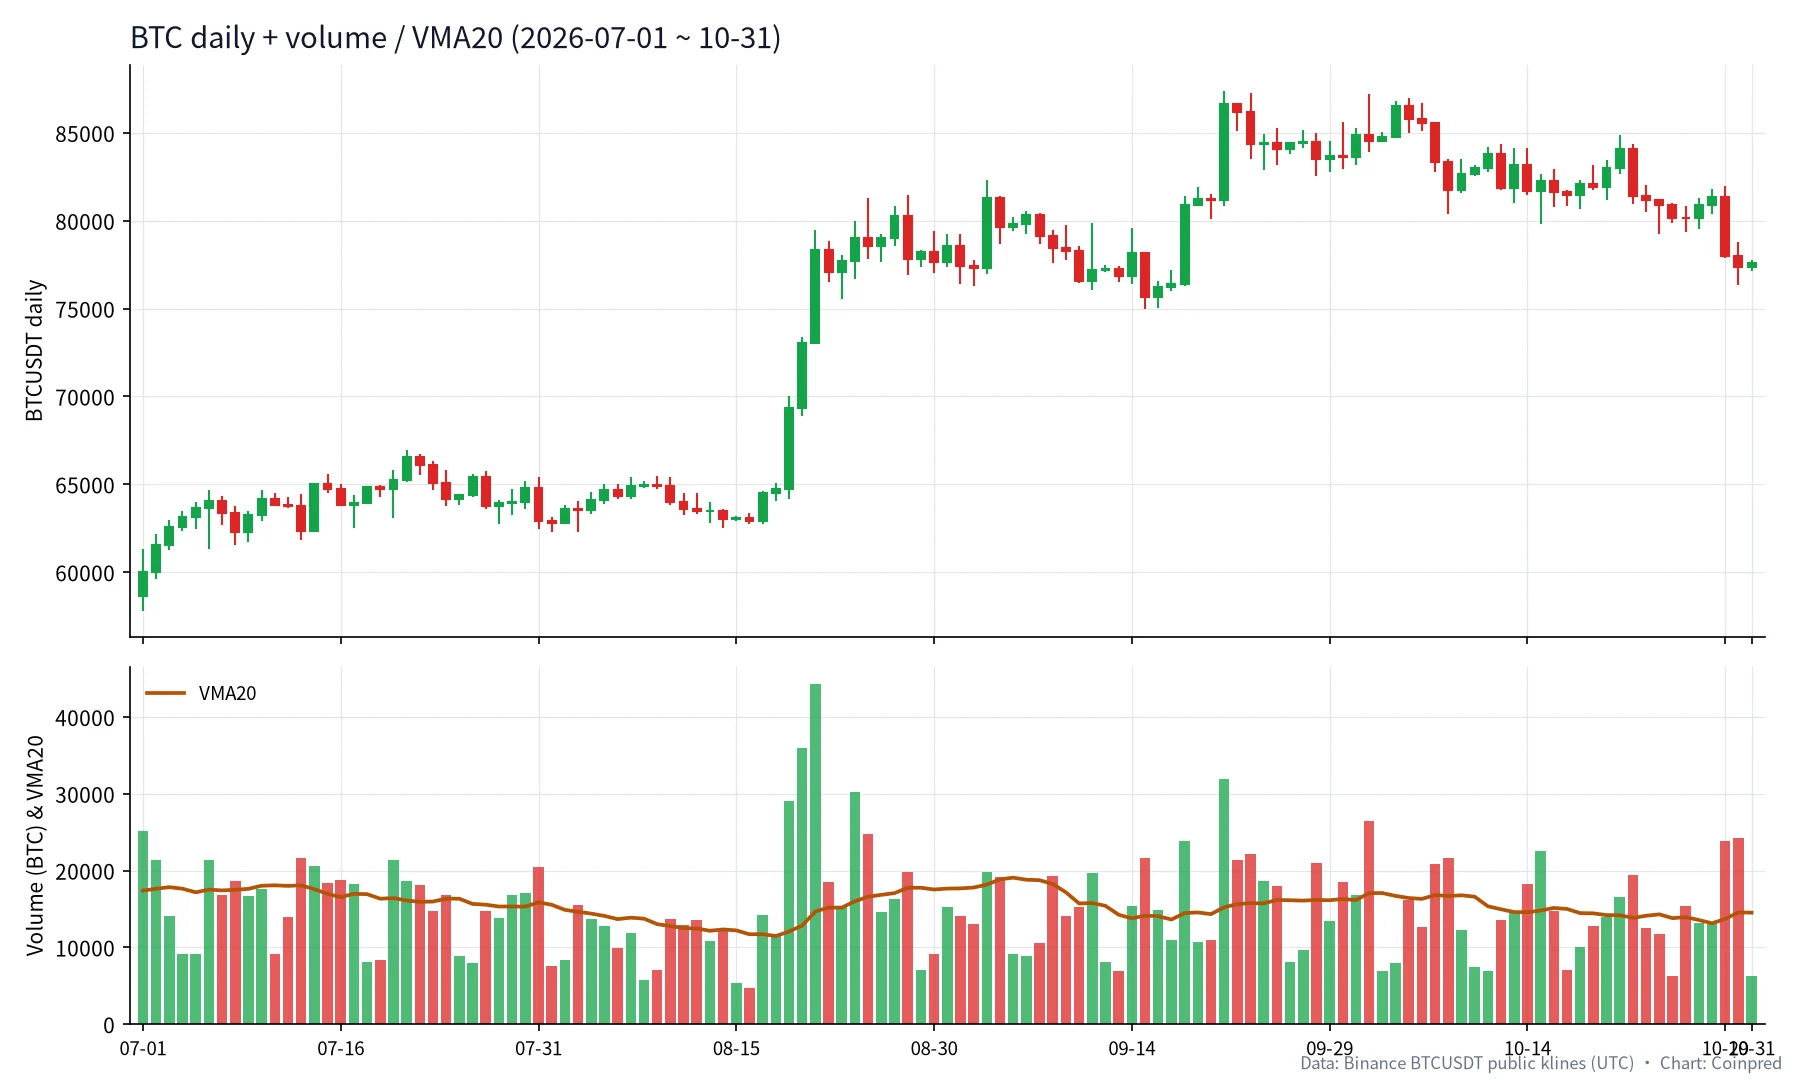
In that window the median daily volume was about 14,656 BTC, the mean about 15,208 BTC, and roughly nine-tenths of days printed below ~22,000 BTC. Rule of thumb we use: once a day clears about 2× the VMA, pay attention. August’s breakout did exactly that.
Rhythm at a glance:
- Early July to mid-August: price chops roughly 60k–65k; volume mostly hugs VMA20.
- 19–21 August: three high-volume up days shove price from ~65k toward ~78k.
- September–October: choppier high-level swings; late October shows down days with elevated volume.
3. Breakout volume: reading 19–21 August
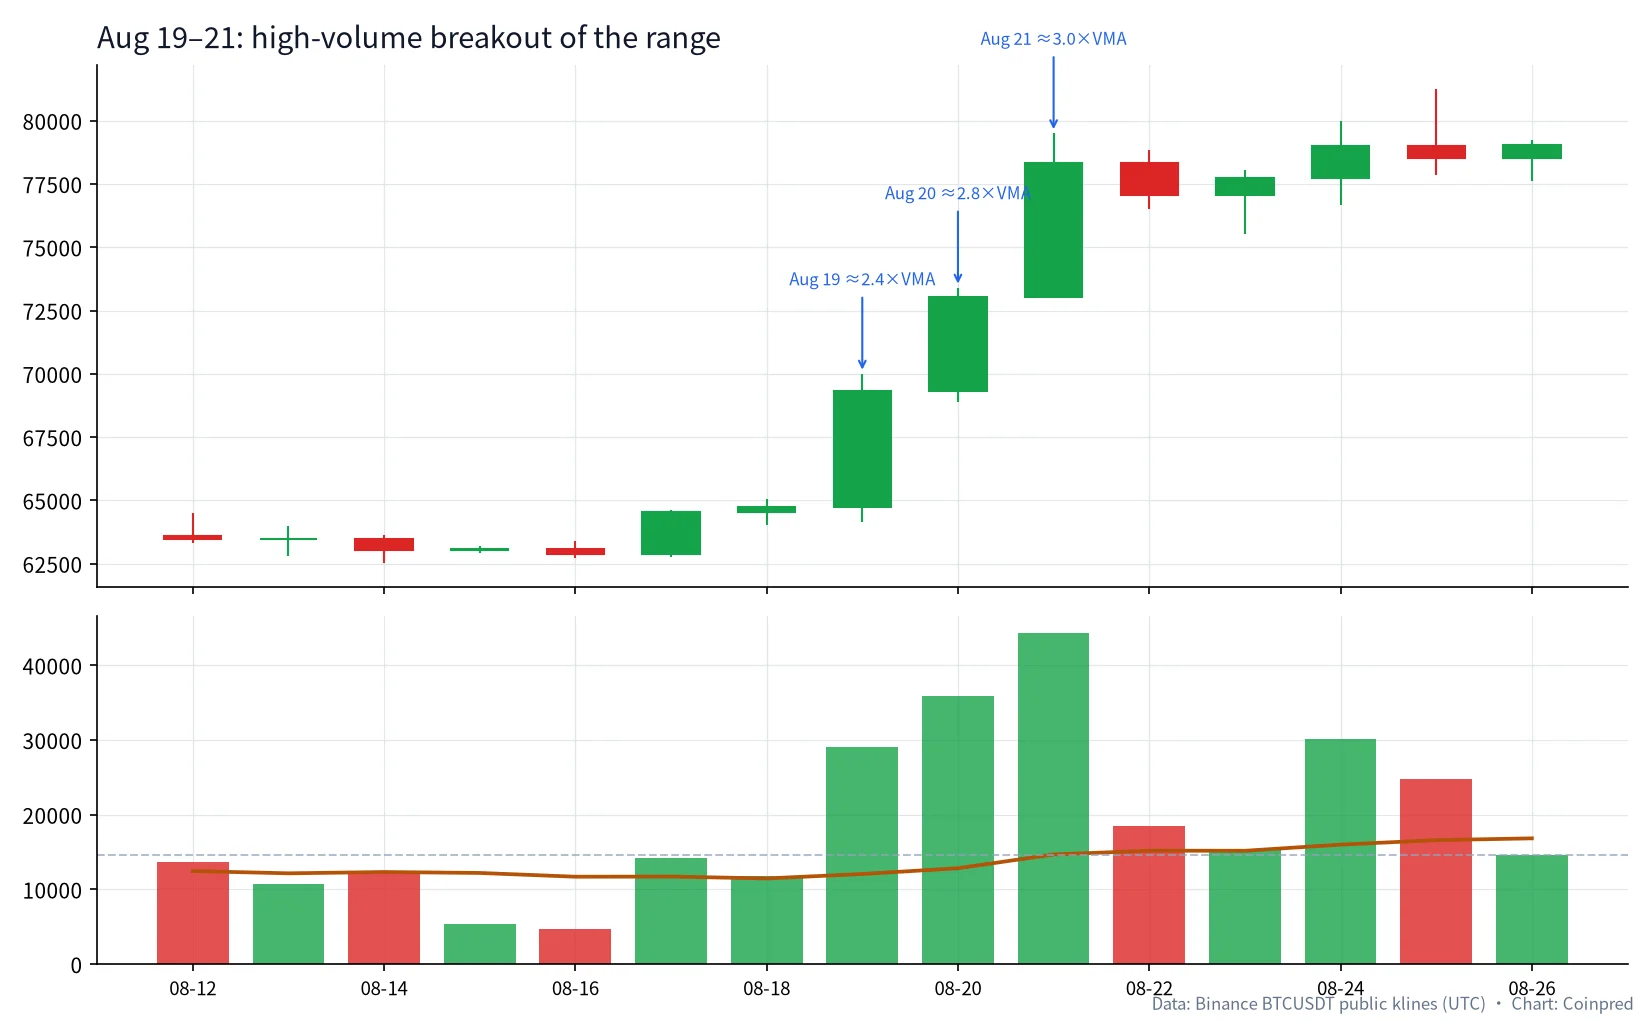
Our support-resistance piece already framed the July–August range. Mid-August was also a Bollinger squeeze (bandwidth near 4.2% on 15 Aug). The move that left that quiet zone with real participation was the next three sessions:
| Date (UTC) | Open | Close | Change | Volume (BTC) | VMA20 | vs VMA |
|---|---|---|---|---|---|---|
| 08-15 | 63,043.56 | 63,086.01 | +0.07% | 5,405 | 12,208 | 0.44× |
| 08-16 | 63,086.01 | 62,900.00 | −0.29% | 4,737 | 11,705 | 0.40× |
| 08-17 | 62,900.00 | 64,532.10 | +2.59% | 14,256 | 11,723 | 1.22× |
| 08-18 | 64,532.11 | 64,725.42 | +0.30% | 11,790 | 11,474 | 1.03× |
| 08-19 | 64,725.42 | 69,334.79 | +7.12% | 29,054 | 12,070 | 2.41× |
| 08-20 | 69,334.78 | 73,025.15 | +5.32% | 35,905 | 12,841 | 2.80× |
| 08-21 | 73,027.02 | 78,338.03 | +7.27% | 44,340 | 14,680 | 3.02× |
Three takeaways we actually use:
- The two quiet days before the surge (15–16 Aug near 0.4× VMA) match the “too quiet” feel of the squeeze.
- Three straight days of aligned price and volume followed — closes ripped higher at 2.4×, 2.8×, and 3.0× VMA. 21 Aug (~44,340 BTC) is the peak volume day in the Jul–Oct sample.
- A large green candle on thin volume would make us skeptical; a streak of heavy volume raises the weight — still waiting for closes above key structure, not celebrating intraday wicks.
Stack that against MACD from the same stretch: histogram explosion and DIF reclaiming the zero line. Price, momentum, and volume pointing the same way beats any single tool.
4. Dry pullbacks after the breakout
After a breakout, the fear is a fakeout. One check we like: does the pullback reload heavy sell volume? From 21 Aug into early September:
| Date (UTC) | Close | Volume (BTC) | vs VMA | Note |
|---|---|---|---|---|
| 08-22 | 77,074.93 | 18,525 | 1.22× | First pullback day, still lively |
| 08-26 | 79,023.75 | 14,614 | 0.87× | Back near average |
| 08-29 | 78,230.00 | 7,016 | 0.39× | Clearly dry |
| 08-30 | 77,682.00 | 9,085 | 0.52× | Still soft |
| 09-02 | 77,340.01 | 13,071 | 0.73× | Price holds above ~77k |
| 09-05 | 79,831.75 | 9,117 | 0.48× | Quiet consolidation |
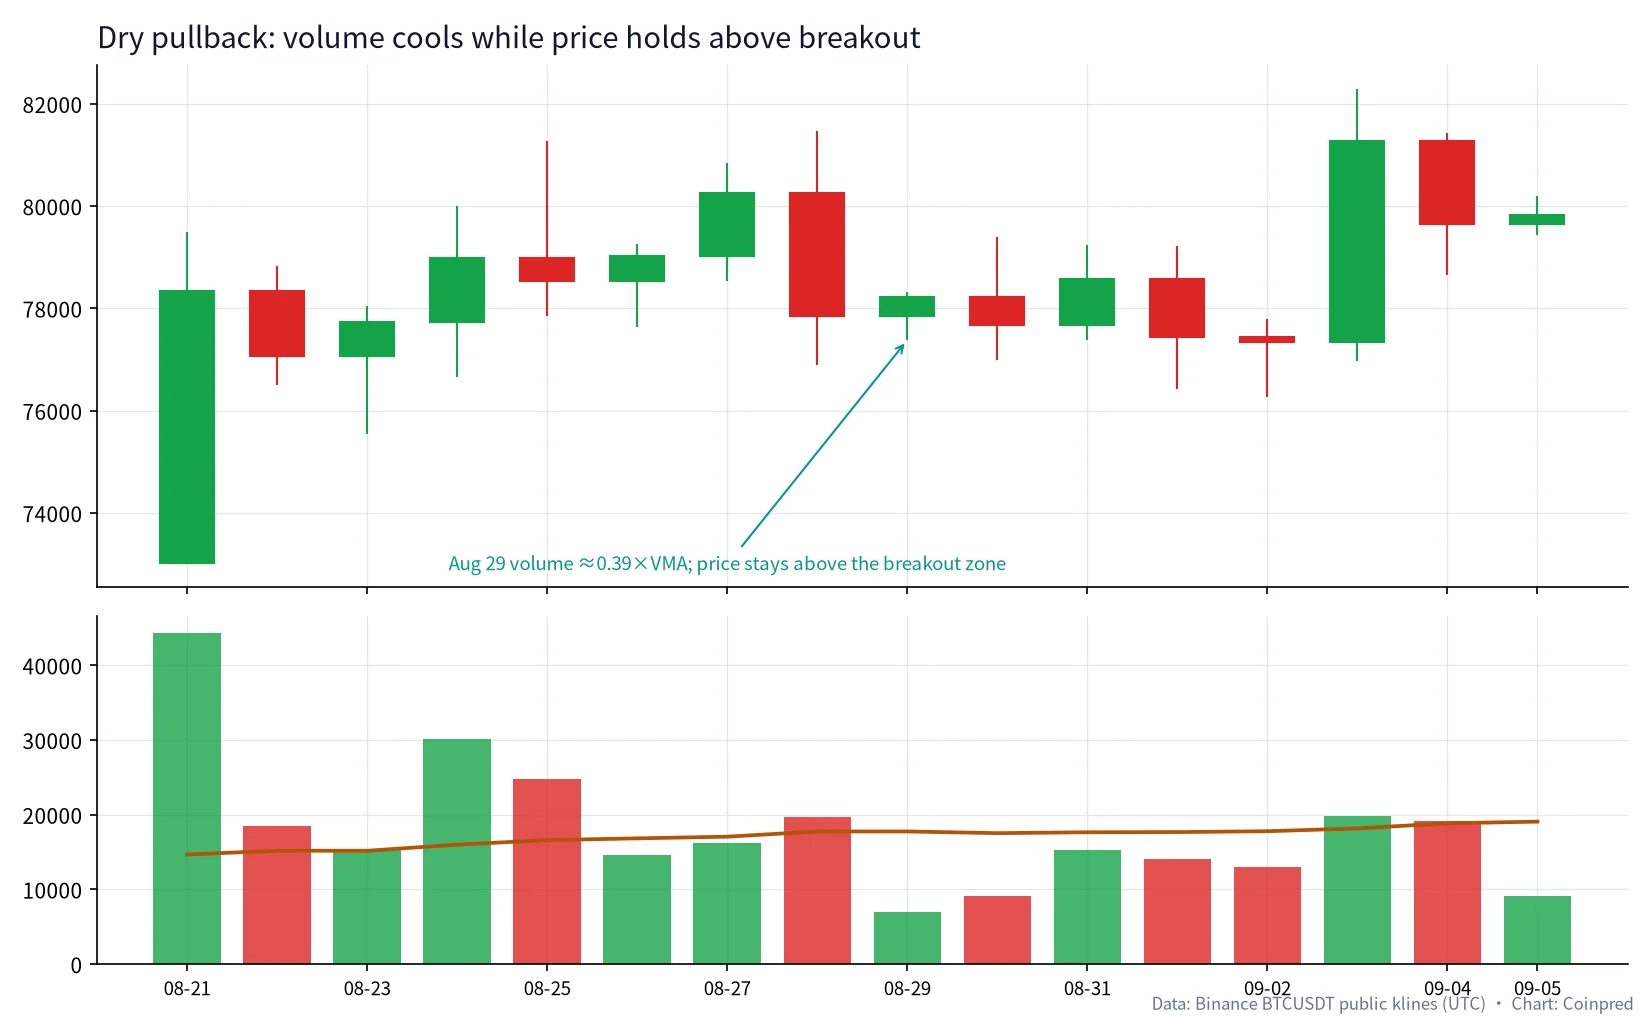
On 29 Aug volume was only about 0.39× VMA, yet price did not immediately collapse back into the mid-August range. Our subjective read: supply took a break — more consolidation than capitulation. Dry volume can also accompany a slow bleed, so we still demand that structure holds and that the next decisive break is not a high-volume dump.
5. OBV: keeping a signed volume ledger
Volume bars answer “how busy was today?” OBV asks whether that busyness was booked to the bulls or the bears:
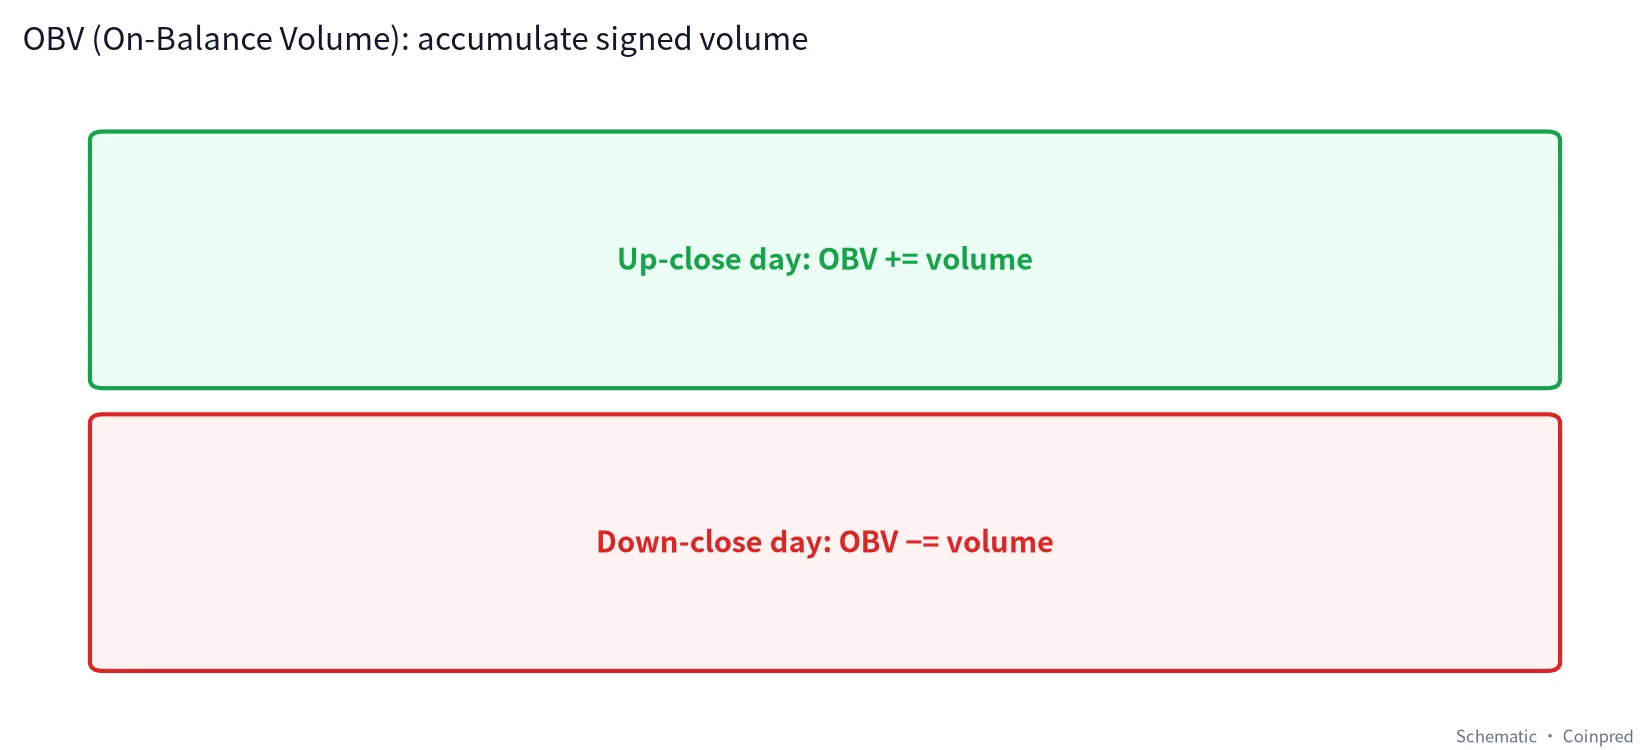
- Close above prior close → OBV += today’s volume
- Close below prior close → OBV −= today’s volume
- Unchanged close → OBV unchanged
The absolute level depends on your start date. We watch slope and divergence, not whether OBV is “positive.”
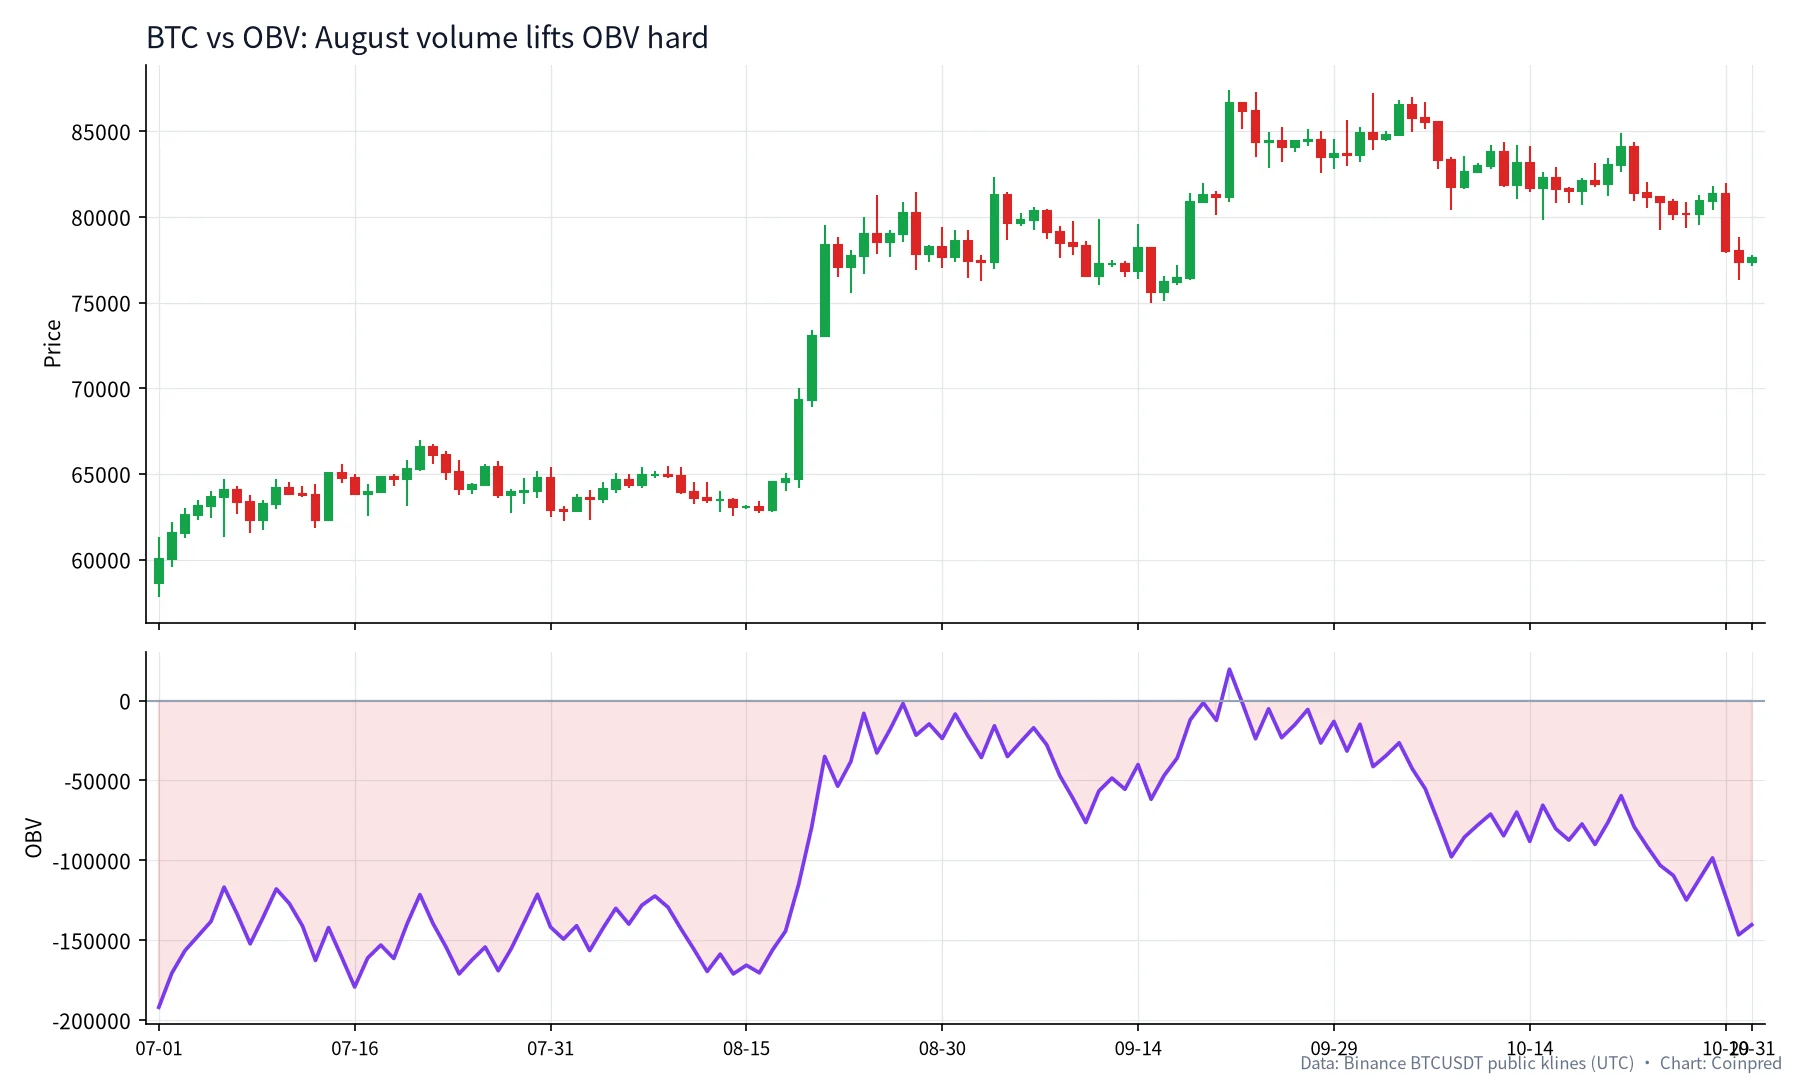
Around 15 Aug OBV sat near −165,659 (cumulative from our series start); by 21 Aug it had climbed to about −35,052, and by 21 Sep to about +19,574. As price left the range for a swing high, OBV rose with it — the cumulative version of volume-price alignment.
If price prints a higher high while OBV flattens or falls, we raise the “thin rally” flag. Same spirit as a momentum divergence, just from a volume ledger.
6. October: what heavy sell volume looked like
Trends do not stay one-sided. A few October sessions show the other face of volume:
| Date (UTC) | Close | Change | Volume (BTC) | vs VMA |
|---|---|---|---|---|
| 10-15 | 82,245.93 | +0.69% | 22,563 | 1.52× |
| 10-22 | 81,416.09 | −3.18% | 19,476 | 1.41× |
| 10-29 | 77,991.89 | −4.12% | 23,832 | 1.74× |
| 10-30 | 77,368.77 | −0.80% | 24,296 | 1.67× |
| 10-31 | 77,582.02 | +0.28% | 6,288 | 0.43× |
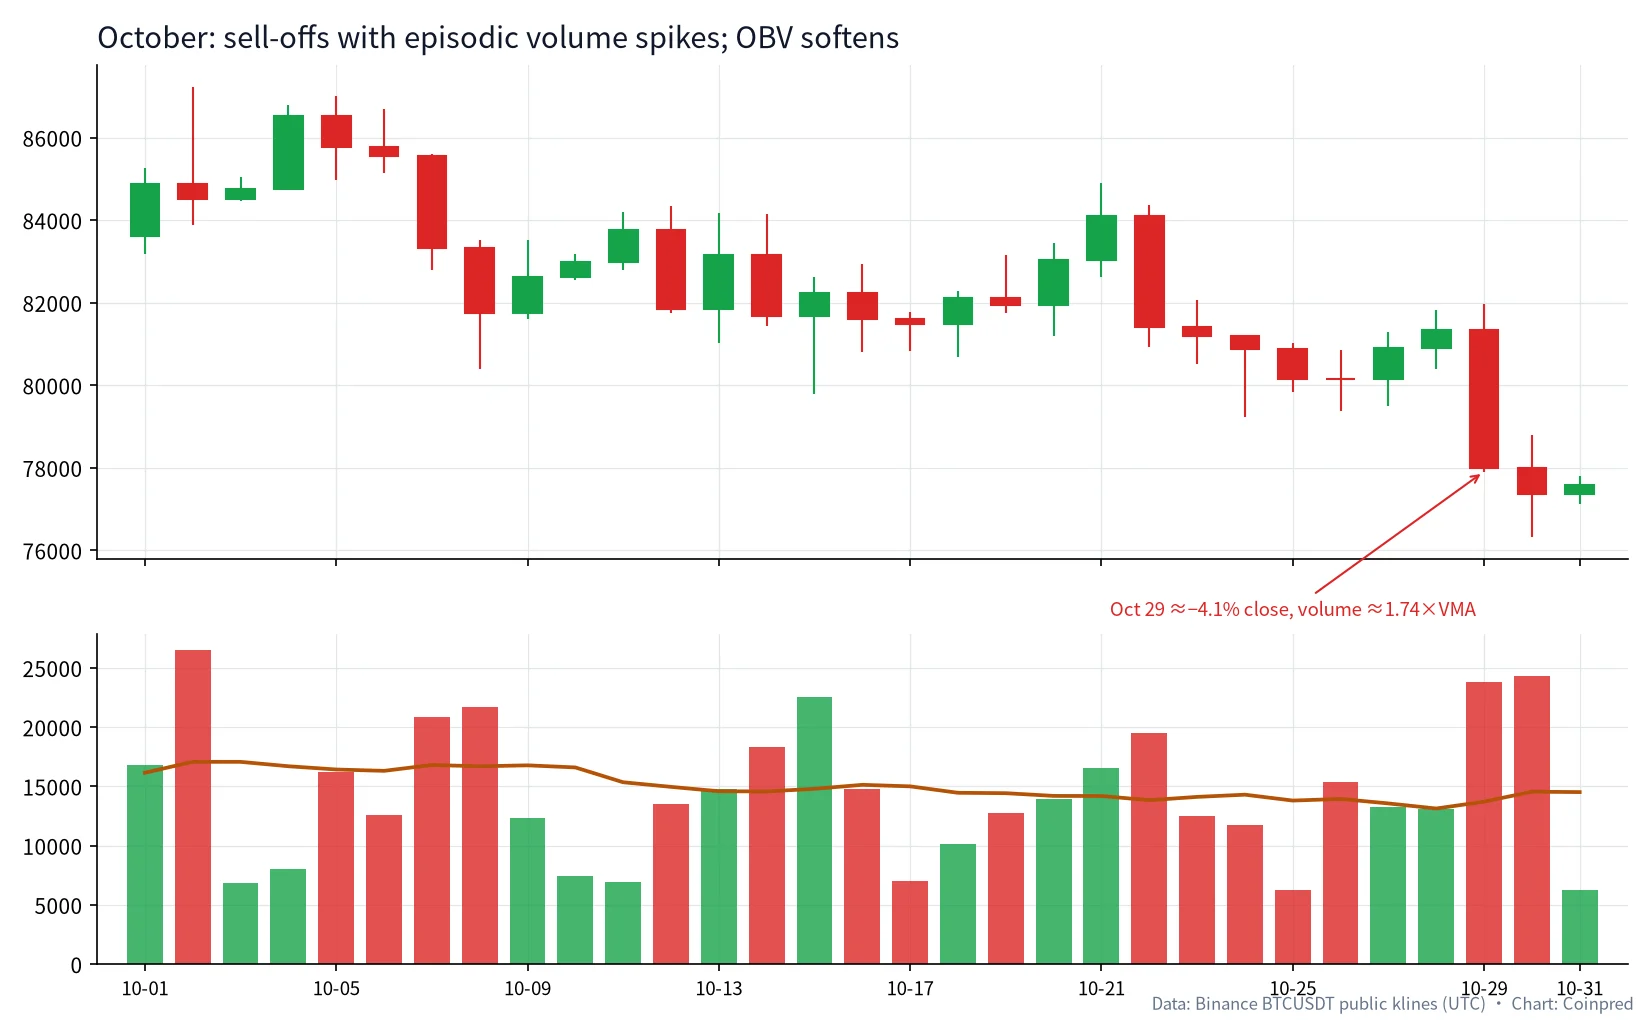
On 29 Oct BTC closed about 4.1% lower on roughly 1.74× VMA, and 30 Oct stayed elevated. That lined up with Bollinger’s lower band giving way and MACD working below zero. We do not treat “heavy down volume” as an automatic bottom or top call — we read it as this drop had real supply behind it, not a silent drift.
Contrast that with several mid-month dry days (10–11 Oct, 17 Oct, 25 Oct near ~0.45× VMA). Thin volume can mean rest — or poor liquidity. Structure still decides.
7. A five-step volume habit
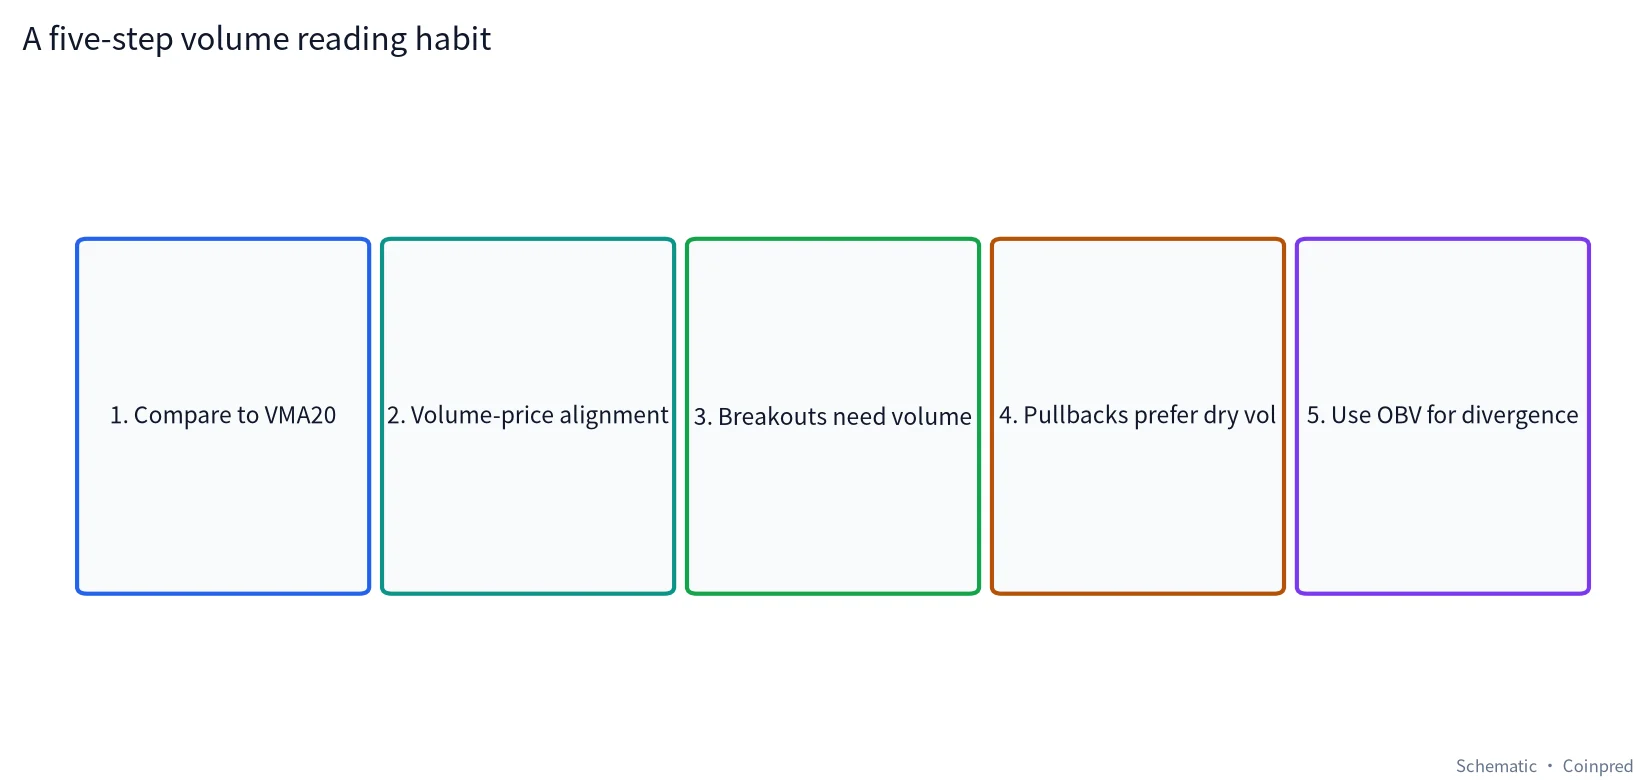
- Compare to VMA20 — above, near, or clearly below the 20-day average?
- Check alignment — up-day volume versus down-day volume tells different stories.
- Demand volume on breakouts — leaving a range or round number prefers a clear VMA multiple.
- Prefer dry pullbacks — a quiet retest looks more like digestion; a high-volume fail looks more like rejection.
- Use OBV for trend/divergence — price and OBV together feel sturdier; clear splits lower our one-sided conviction.
8. Common traps
- Reading candles without volume — a 3× VMA thrust is not the same animal as a 0.5× drift.
- Absolute “spike” thresholds — calibrate to each pair and timeframe via its own VMA.
- Porting a 5-minute volume conclusion onto the daily.
- Mixing spot, perpetual, and cross-exchange totals without saying so — this article uses Binance spot BTCUSDT daily volume.
- Worshipping OBV’s absolute level — change the start date and the number jumps; watch shape instead.
FAQ
What does volume actually count?
On a BTCUSDT daily candle, volume is typically the amount of BTC traded in that UTC day. Quote volume (USDT notional) is related but not identical.
How many times VMA counts as “high volume”?
No statute. We personally raise attention around ≥1.5× and treat ≥2× as clearly elevated. The August streak at 2.4×–3.0× sits at the extreme end. Calibrate for your market.
Does a dry rally always reverse?
No. Trends can grind higher on fading volume. It warns that participation is cooling; it does not auto-flip the tape. We reduce chase weight until volume or structure refreshes the story.
If OBV and the volume bars disagree, which wins?
Use the bars for the session, OBV for the cumulative path. Weird wick days and one-off prints can distort OBV — handle those with care.
How should volume sit next to RSI or MACD?
Volume answers “was anyone there?”; RSI/MACD answer “how stretched / which side is momentum on?” August’s three-way alignment beat a lonely cross. See the dedicated RSI and MACD tutorials for the oscillators themselves.
What does a volume fakeout often look like?
Common (not guaranteed): a muted push through resistance, then a heavier-volume slip back into the range. Compare that spectrum with the consecutive high-volume thrust of 19–21 Aug.
Can volume alone be a trading system?
You can write rules, but define failure modes and keep spot vs perps and timeframes explicit. Blindly chasing every spike hurts on climax days. Everything here is for education and review — not investment advice.
Data and references
- Klines: Binance public API, BTCUSDT daily, primarily 2026-07-01 to 2026-10-31 (UTC); VMA20 and OBV computed from volume and closes.
- Binance Academy: What Is Trading Volume?
- Investopedia: On-Balance Volume (OBV)
- Investopedia: Volume of Trade
All charts were drawn by Coinpred from the public data above. Trading involves risk — decide independently and size carefully. This article is educational only and is not investment advice.