On coinpred.com this is the seventeenth piece in our indicator tutorial series. We are the Coinpred editorial team — the same group that maintains the guides and the author page. After the RSI, Stochastic and ATR notes, one common question was still sitting on the desk: oscillators tell you how one-sided recent closes have been, and ATR tells you how wide a typical day is. They do not tell you whether the market is actually trending, or how strong that trend is.
The Average Directional Index (ADX) answers only the strength question. It does not say up or down. Direction comes from the two lines that travel with it: +DI and -DI. Together they are often called the Directional Movement Index, or DMI. People who search for “how to use ADX” or “what to do when ADX is below 20” usually get the formula right and the job description wrong. They treat strength as a direction, or they treat every cross as an order ticket.
Every figure below is computed from Binance’s public BTCUSDT daily klines, in UTC. The settings are Welles Wilder’s common 14-period defaults. The main window is 2026-07-01 through 2026-11-19. 20 November was still trading when we drafted this, so that unfinished session is not treated as a complete day. You can download the same series and recompute. This is a reading guide, not a trading system, and it is not investment advice.
1. ADX measures strength; +DI and -DI carry the direction
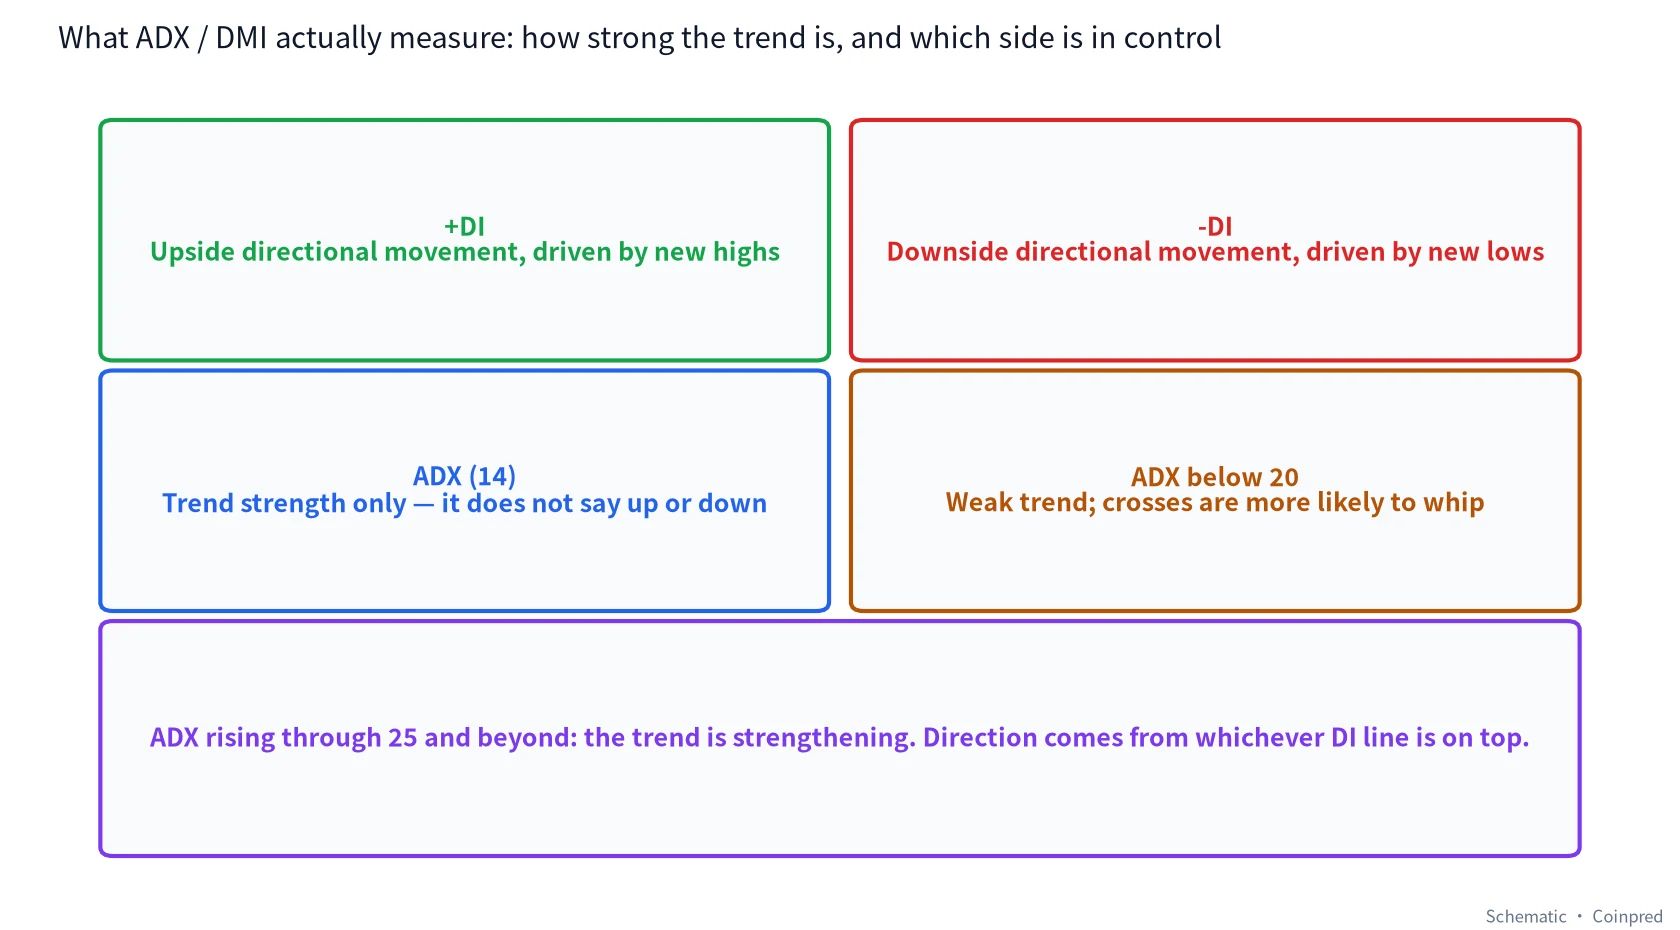
Start with the same True Range we used in the ATR tutorial: the largest of the day’s high minus low, the gap from yesterday’s close to today’s high, and the gap from yesterday’s close to today’s low. ADX then splits that range into upside and downside directional movement:
- Up-move = today’s high − yesterday’s high; down-move = yesterday’s low − today’s low.
- If the up-move is larger than the down-move and is greater than zero, +DM equals the up-move; otherwise it is 0.
- If the down-move is larger and greater than zero, -DM equals the down-move; otherwise it is 0.
True Range, +DM and -DM are then smoothed with Wilder’s method (a simple average of the first 14 values, then a 14-day RMA). That gives:
+DI = 100 × smoothed +DM ÷ smoothed TR
-DI = 100 × smoothed -DM ÷ smoothed TR
DX = 100 × |+DI − -DI| ÷ (+DI + -DI)
ADX is that DX, smoothed the same way over 14 periods.
So ADX itself has no sign. A high reading only means the gap between +DI and -DI has been wide, and has stayed wide long enough for the average to catch it. A low reading means the two sides are close, or that any gap has not held. 20, 25 and 40 are reference lines on our charts, not exchange rules. Traders often call an ADX below 20 a weak trend or a range, a rise through 25 a trend that is starting to look real, and a print above 40 a strong one. Those are neighbourhoods, not long or short alarms.
A worked example from a day people still remember. On 19 August 2026 BTC reached a high of 70,000.00, a low of 64,166.00, and closed at 69,334.79, after a previous close of 64,725.42 on 18 August. True Range is the largest of three numbers:
High − low = 5,834.00; |high − prior close| = 5,274.58; |low − prior close| = 559.42. So TR that day is 5,834.00.
The directional part is just as blunt. The high was 4,941.19 above the 18 August high of 65,058.81. The low was actually higher than the prior low of 64,027.85, so the down-move was negative. That session’s +DM is 4,941.19 and -DM is 0. After smoothing, +DI jumped from 19.77 on 18 August to 36.88, while -DI fell from 19.81 to 14.59. The cross happened on that day. ADX itself was only 19.10 — the strength line had not had time to rise yet. You will see this order more than once below: the DI lines often flip first, and ADX follows after the smooth has had a chance to work.
2. The July–November picture, in one chart
Here is BTC’s daily candle from 1 July through 19 November 2026, with ADX, +DI, -DI, and the 20 / 25 / 40 lines underneath:
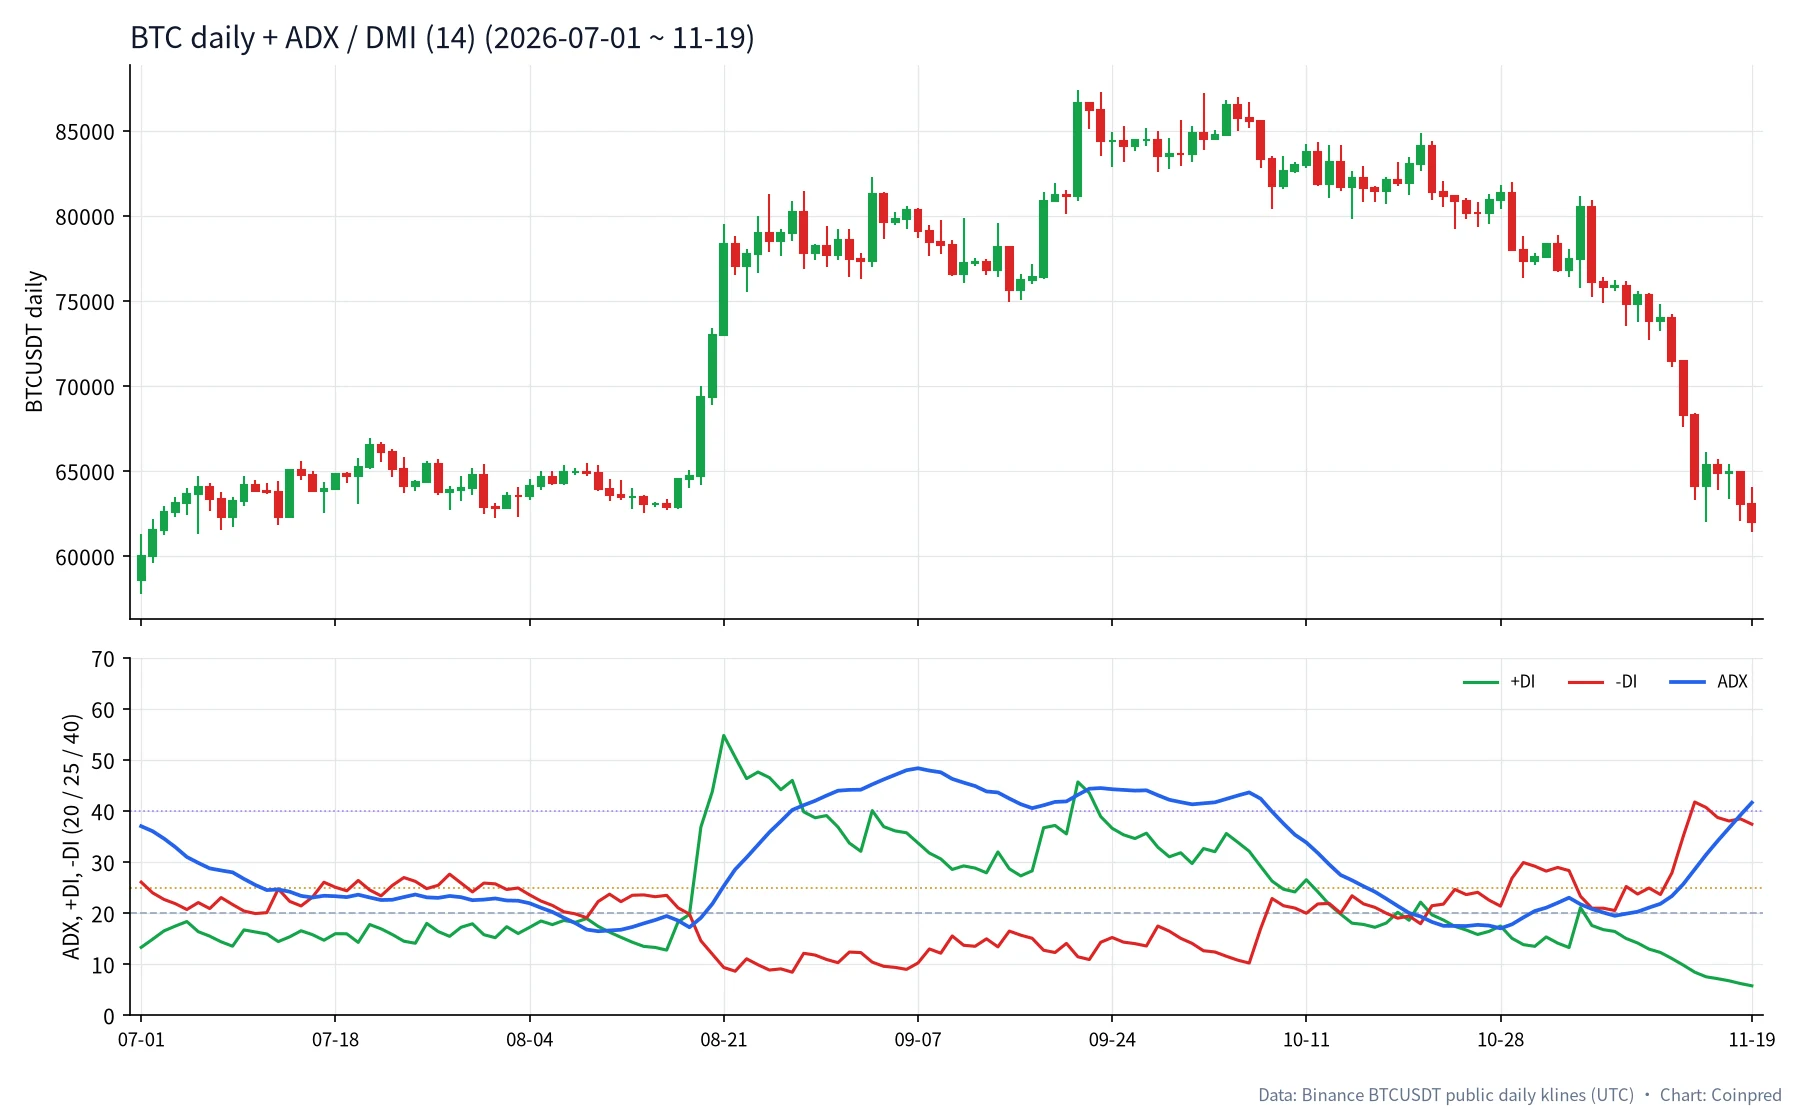
The path is not subtle. Early July still carried the leftover strength of June’s slide: the 1 July close was 60,024.00, and the window’s lowest low, 57,800.19, printed on the same day. ADX was still 37.03, with -DI above +DI. For a little more than a month after that, price spent most of its time in a rough 62k–66k band, and ADX drifted lower. On 10 August it reached the sample low of 16.47. Then mid-to-late August shoved the close into the high 70s, and ADX climbed with it, peaking at 48.39 on 7 September. The window’s highest price came later: a session high of 87,395.67 on 21 September, with a close of 86,620.00, by which time ADX had already slipped back to 43.18. November gave back a large part of the autumn rally. The 19 November close was 61,986.73, and ADX was back up at 41.64 — this time with -DI clearly in control.
Inside that 142-day window, ADX spent 25 sessions below 20, 75 sessions at or above 25, and 43 sessions at or above 40. The useful part is not the tally. It is the three different ways the lines lived with price: a directional cross while ADX was still low, a new price high after ADX had already rolled over from a peak, and a stretch of noisy DI crosses once ADX had fallen back under 20.
Support and resistance and the moving-average stack are still the frame we put around any strength reading. ATR still measures width. ADX does not replace either of those jobs.
3. Mid-August: ADX near the window low, then +DI crosses up
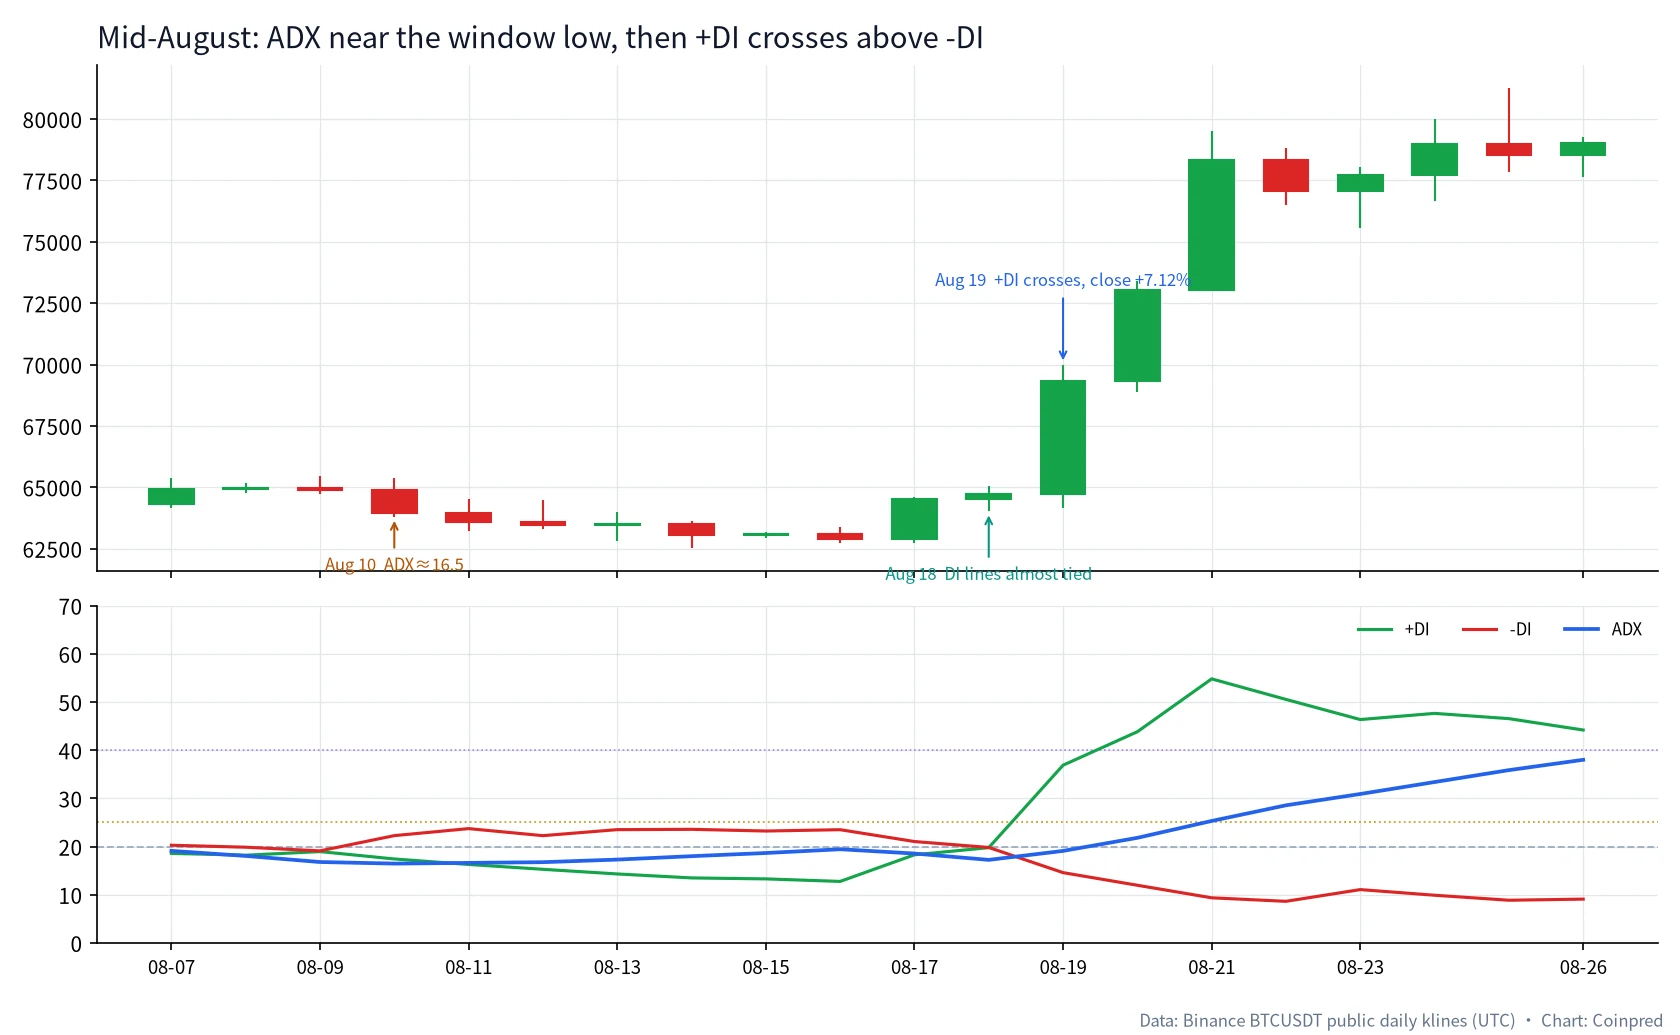
By mid-August the daily range had gone unusually quiet — the same stretch our Bollinger, volume and ATR notes already treated as a coiled period. On the ADX pane, strength was stuck between 16 and 20, the two DI lines were close, and -DI still had a slight lead.
| Date (UTC) | Open | High | Low | Close | Change | ADX | +DI | -DI | Note |
|---|---|---|---|---|---|---|---|---|---|
| 08-10 | 64,901.59 | 65,391.14 | 63,806.27 | 63,970.01 | −1.44% | 16.47 | 17.43 | 22.27 | Lowest ADX in the window |
| 08-15 | 63,043.56 | 63,187.98 | 62,920.00 | 63,086.01 | +0.07% | 18.66 | 13.29 | 23.22 | Extremely narrow day |
| 08-16 | 63,086.01 | 63,390.00 | 62,716.00 | 62,900.00 | −0.29% | 19.44 | 12.77 | 23.50 | -DI still on top |
| 08-17 | 62,900.00 | 64,610.01 | 62,751.10 | 64,532.10 | +2.59% | 18.56 | 18.29 | 21.05 | +DI lifts, not yet a cross |
| 08-18 | 64,532.11 | 65,058.81 | 64,027.85 | 64,725.42 | +0.30% | 17.24 | 19.77 | 19.81 | The two DI lines almost tied |
| 08-19 | 64,725.42 | 70,000.00 | 64,166.00 | 69,334.79 | +7.12% | 19.10 | 36.88 | 14.59 | +DI crosses above -DI |
| 08-21 | 73,027.02 | 79,500.00 | 73,027.02 | 78,338.03 | +7.28% | 25.31 | 54.80 | 9.36 | ADX finally clears 25; window peak for +DI |
The 16.47 print on 10 August is the lowest ADX in the whole July–November sample. From 7 August through 19 August, ADX stayed below 20 for thirteen sessions — the exact condition people type into a search bar. The last of those days was not a quiet range candle. It was a +7.12% breakout. If “ADX below 20” is allowed to mean “nothing important can happen today,” 19 August will correct that idea immediately.
The finer sequence is worth keeping. On 17 August the close rose 2.59% and +DI lifted from about 12.8 to 18.29, still under -DI. On 18 August the two lines were almost glued together (19.77 vs 19.81). The actual cross waited until 19 August. ADX that day was still only 19.10; it did not clear 25 until 21 August. Direction flips first; strength follows. That lag is the smoothing, not a bug in the arithmetic.
We would not have taken the 19 August cross as a standalone entry even in hindsight. We would have asked whether the daily close was also leaving a range we had already marked, whether volume was actually present, and whether ATR was expanding at the same time. ADX was one weight on the table, used to describe how one-sided the move was becoming — not the vote.
4. A rising ADX describes a strengthening trend, not a short
The first time many people see ADX climbing, they reach for the same instinct they use on an overbought oscillator. That is the wrong tool for this pane. In the Stochastic note, the oscillator stayed pinned in overbought for twelve sessions in late August while price kept grinding higher. That flattening, and the ADX climb from 19 to 48 over the same stretch, are two views of one advance: one line says the close is living at the top of its recent box, the other says how strong that push has become.
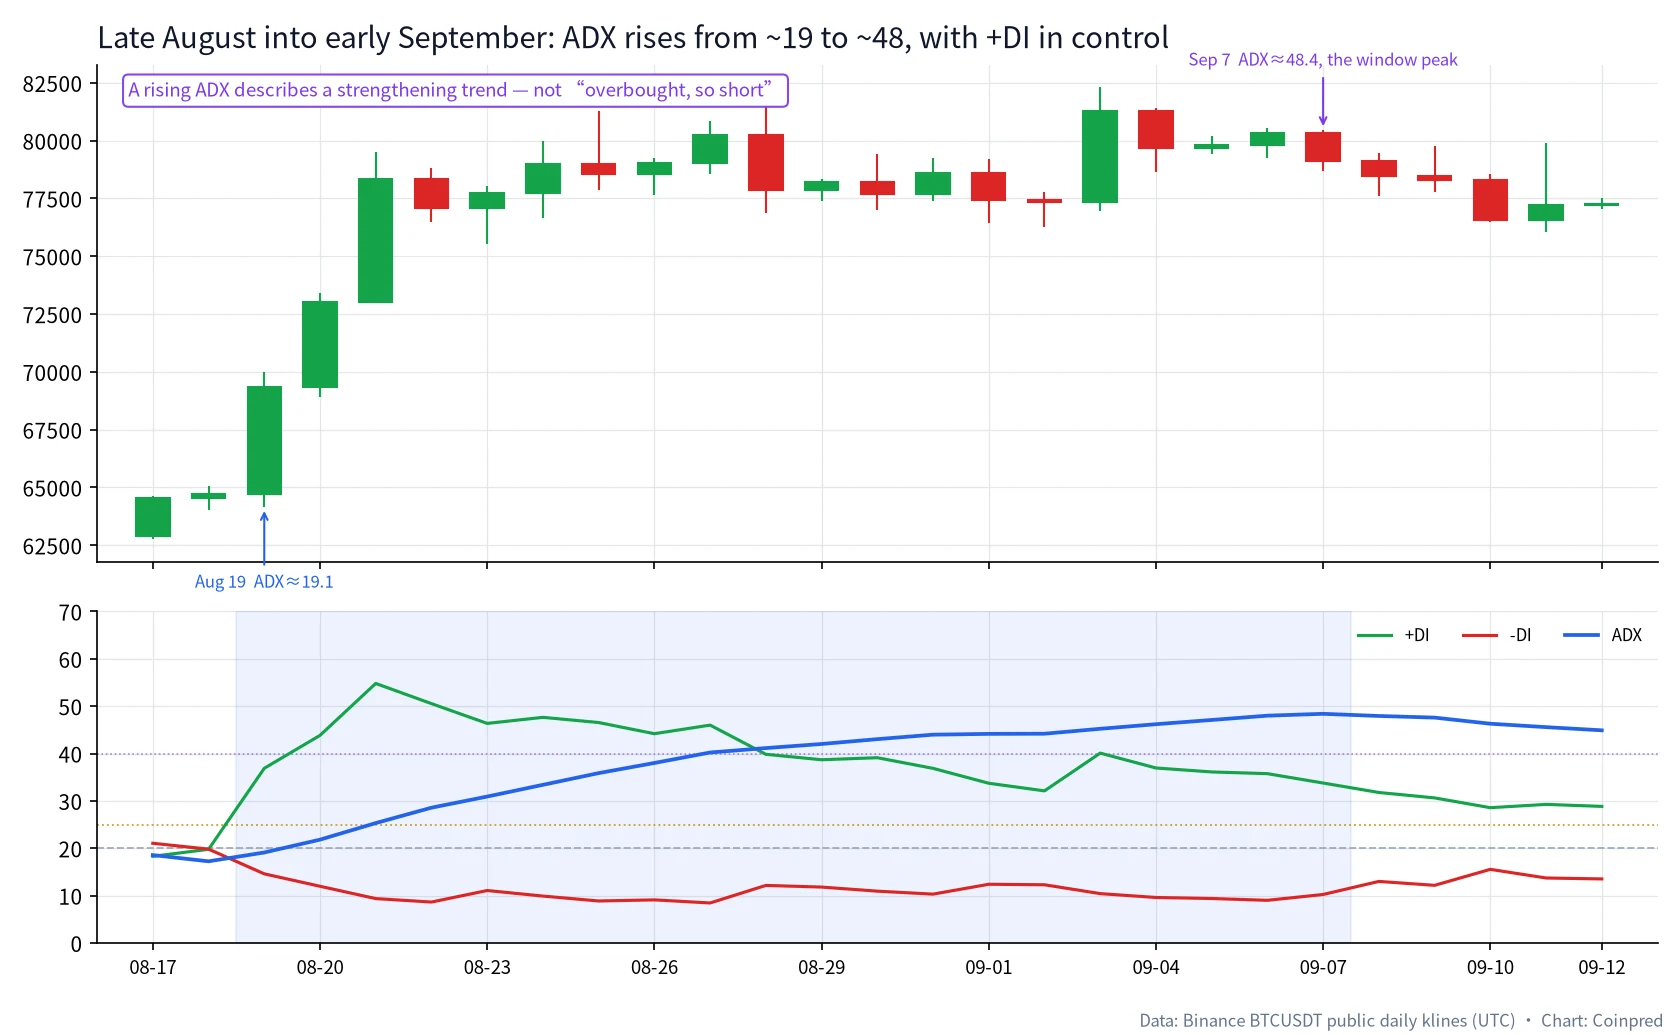
From 19 August to 7 September, ADX rose from 19.10 to the sample peak of 48.39. +DI stayed above -DI the whole way. The 19 August close was 69,334.79; the 7 September close was 79,112.01. +DI itself printed its window high of 54.80 on 21 August and then eased, which is normal; it did not hand the lead back to -DI.
From 27 August through 7 October, ADX stayed at or above 40 for forty-two sessions. That is not a countdown to a reversal. It is a long stretch in which one directional line kept the other underneath it. A person who shorts “because ADX is already at 40” would have been leaning against one of the more one-sided advances of the year.
The division of labour with ATR is useful here as well. ATR tells you that after mid-August a normal day got much wider. ADX tells you that this width was not directionless noise; it was travelling with a side. When width expands and strength rises together, we treat an extreme oscillator reading as a description of persistence first, not as a trigger to fade.
5. An ADX rollover from a high is not an instant end of trend
The strength peak and the price peak do not have to land on the same day. That is the second place this indicator is routinely misread.
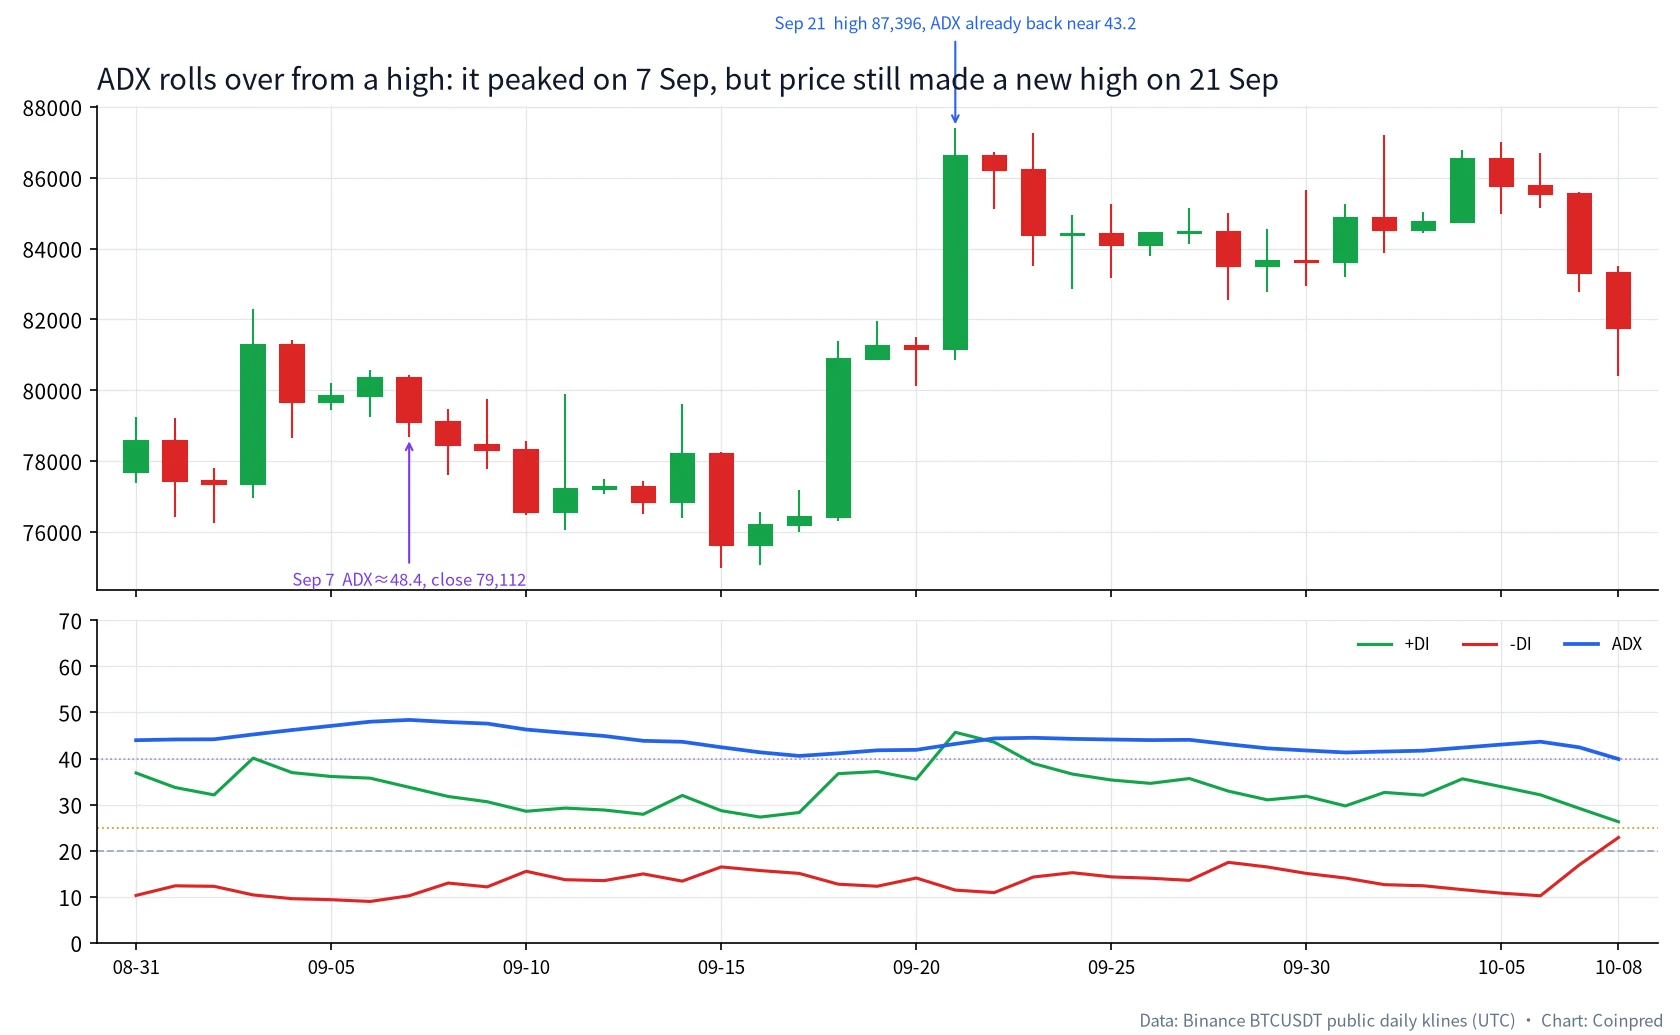
On 7 September, ADX printed 48.39. The close was only 79,112.01, with a session high of 80,443.99. Two weeks later, on 21 September, the session high was 87,395.67 and the close was 86,620.00, up 6.70% on the day — while ADX had already slipped back to 43.18. Price was higher; the strength line was lower. On 4 October the close was 86,530.00, after a high of 86,800.00, with ADX at 42.37: still above 40, but clearly off the early-September peak.
We do not translate that rollover into “a top signal.” It only says the advance was still in place, but was no longer as one-sided as it had been in late August and early September. +DI actually lifted again on 21 September, to 45.69, with -DI still at 11.46. Direction had not flipped. The part that later deserved more caution was the continued slide in ADX, and the two DI lines moving closer together — which is the next section.
If you want a single sentence: an ADX rollover from a high is “less one-sided than it was,” not “the trend must turn tomorrow.” You can set that next to the failed-confirmation episode in the Stochastic article, but do not force the two lines into the same divergence template. Price is allowed to print a higher high while ADX is already coming down. 21 September is the working example.
6. When ADX is below 20, why DI crosses get noisy
Mid-to-late October is the clearest stretch in this sample for the question “how should I read ADX below 20.” Not because there were no crosses — because there were too many.
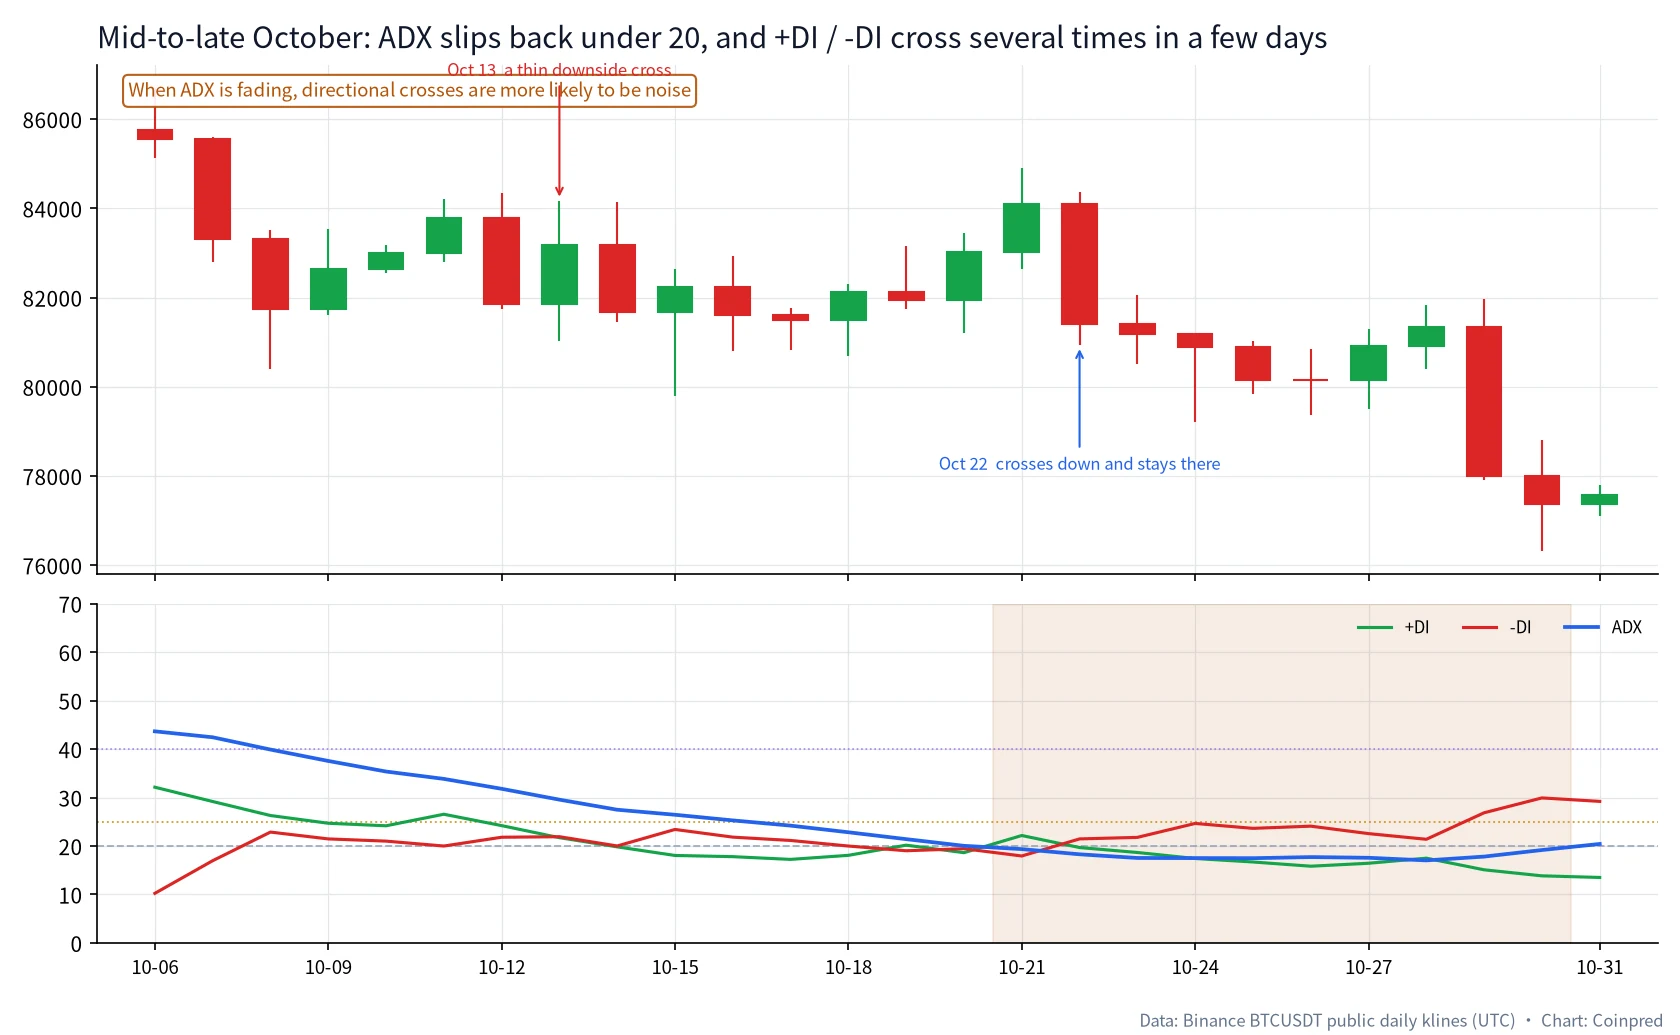
From 19 August through 12 October, +DI stayed above -DI for fifty-five sessions. That lead broke in mid-October, and it did not break cleanly:
| Date (UTC) | Close | Change | ADX | +DI | -DI | Cross |
|---|---|---|---|---|---|---|
| 10-12 | 81,850.00 | −2.30% | 31.80 | 24.20 | 21.81 | +DI still on top |
| 10-13 | 83,169.00 | +1.61% | 29.56 | 21.71 | 21.91 | A thin downside cross, only 0.20 apart |
| 10-19 | 81,938.40 | −0.22% | 21.41 | 20.17 | 19.02 | Back to +DI on top |
| 10-20 | 83,028.15 | +1.33% | 20.04 | 18.62 | 19.44 | Down again |
| 10-21 | 84,093.42 | +1.28% | 19.36 | 22.16 | 17.94 | Up again, ADX already under 20 |
| 10-22 | 81,416.09 | −3.18% | 18.28 | 19.68 | 21.46 | Down again, and this one held |
Between 13 October and 22 October — ten sessions — the DI lines crossed five times. The 13 October downside cross had a gap of only 0.20, and the close that day was still up 1.61%. If every cross is a turn, you will trade against yourself in the same week. From 21 October through 30 October, ADX stayed below 20 for ten sessions, while the close moved from 84,093.42 to 77,368.77. A weak ADX does not mean price will sit still. It means the “who is in charge” reading from the DI lines becomes much less trustworthy.
The 22 October downside cross happened to hold. That was not because its ADX looked distinguished — it was only 18.28 that day — but because -DI stayed on top in the sessions that followed, and ADX itself climbed back above 20 on 31 October. You cannot see “this is the last cross” at the moment it prints. What you can see, in real time, is that strength is already too weak to give each flicker much weight.
7. November: ADX rises again, this time with -DI in control
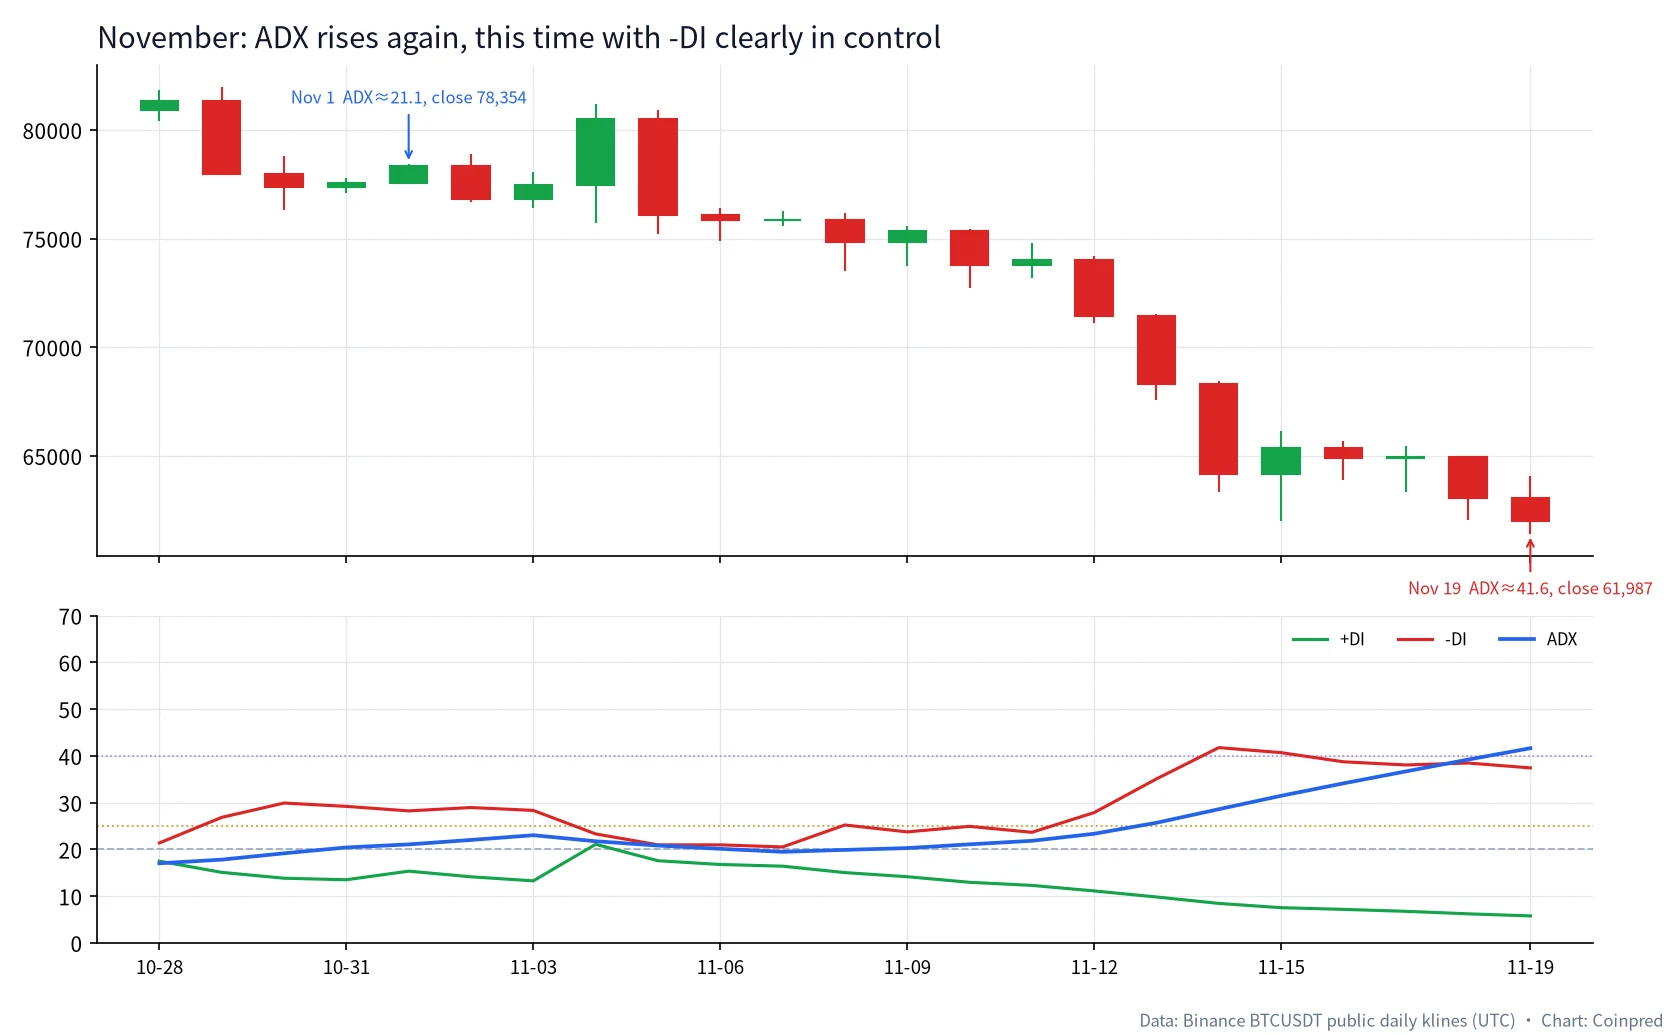
When strength starts rising, the first question is still which DI line is on top. November makes that almost too obvious.
| Date (UTC) | Open | High | Low | Close | Change | ADX | +DI | -DI | Note |
|---|---|---|---|---|---|---|---|---|---|
| 11-01 | 77,582.02 | 78,422.23 | 77,517.20 | 78,354.00 | +1.00% | 21.07 | 15.35 | 28.24 | -DI already on top, ADX just over 20 |
| 11-05 | 80,504.01 | 80,918.01 | 75,208.42 | 76,088.01 | −5.49% | 20.82 | 17.58 | 20.97 | Close keeps falling, ADX still modest |
| 11-07 | 75,844.00 | 76,249.99 | 75,571.08 | 75,867.59 | +0.03% | 19.49 | 16.42 | 20.53 | A brief dip back under 20 |
| 11-13 | 71,460.00 | 71,514.01 | 67,568.00 | 68,314.00 | −4.40% | 25.70 | 9.83 | 35.08 | ADX clears 25 again |
| 11-14 | 68,314.01 | 68,446.21 | 63,320.00 | 64,150.00 | −6.10% | 28.60 | 8.45 | 41.77 | Near the window high for -DI |
| 11-19 | 63,068.21 | 64,080.80 | 61,428.26 | 61,986.73 | −1.71% | 41.64 | 5.78 | 37.43 | ADX back above 40 |
On 1 November the close was 78,354.00 and ADX was only 21.07. By 19 November the close was 61,986.73, ADX was 41.64, +DI was down to 5.78, and -DI was still at 37.43. That is the same kind of structure as late August, only the direction is reversed. Buying an oversold oscillator against that backdrop is standing in front of a decline that is still strengthening — the strength-side companion to the November oversold stall we already walked through in the Stochastic article.
ADX did dip back under 20 on 7 and 8 November (19.49 and 19.90), then turned up again. A brief dip like that is not an automatic end of the decline. You still have to ask whether -DI gave the lead back. On those two days, it did not.
8. A five-step reading habit
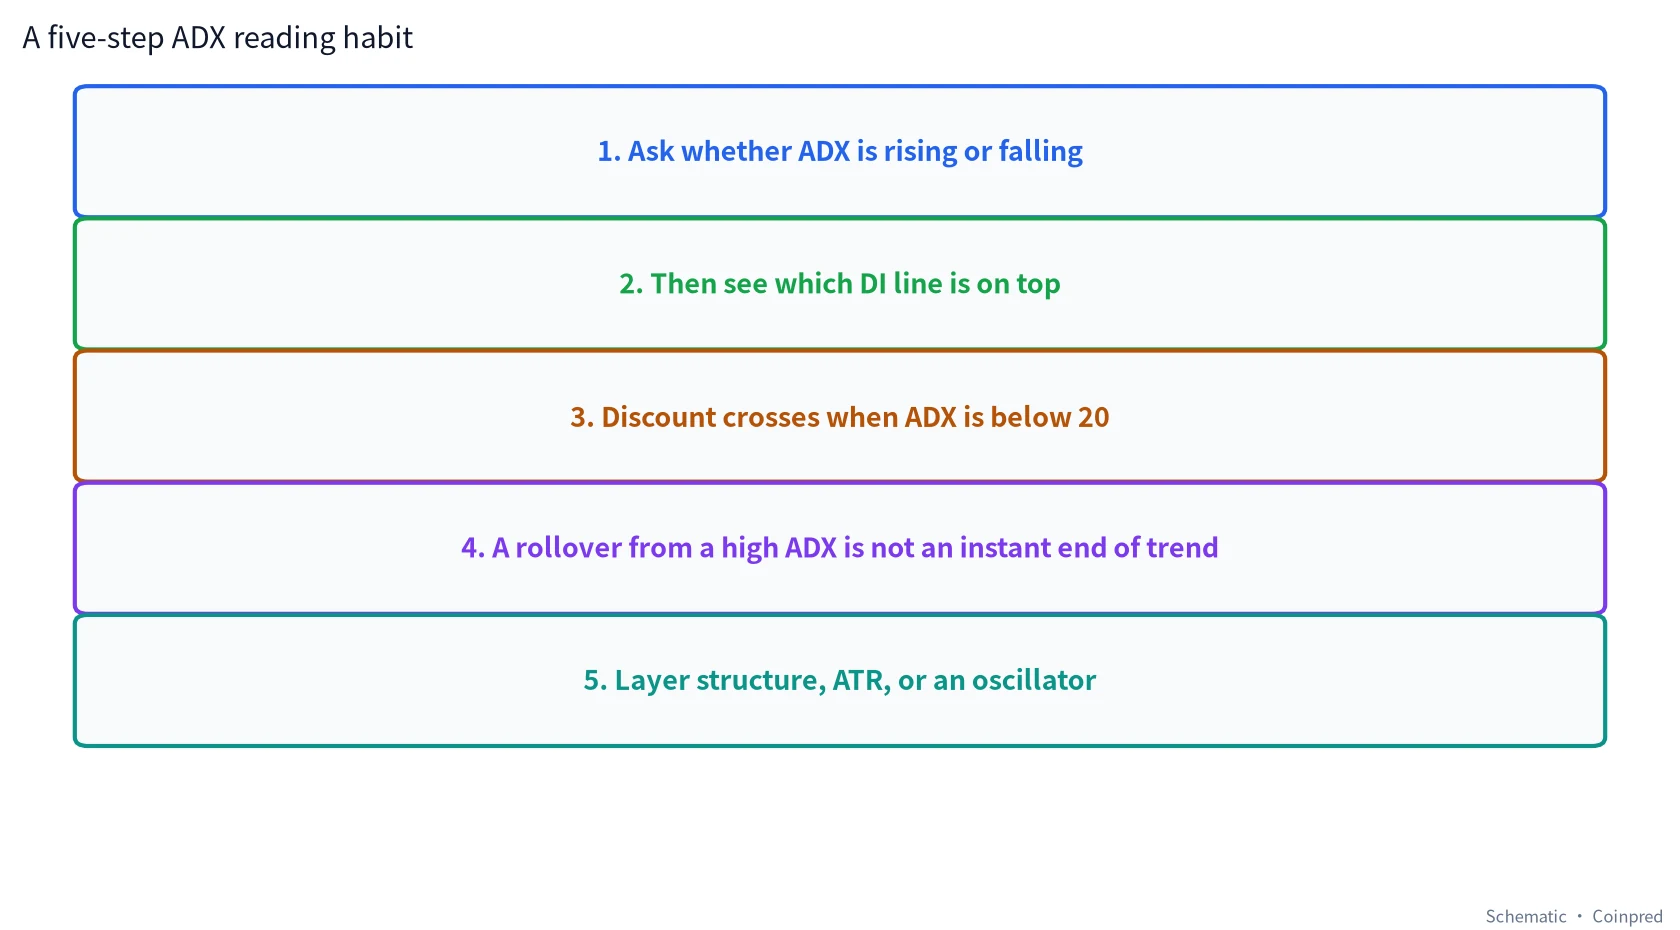
When we sit down with the daily chart, we usually follow this order, rather than hunting for a cross first:
- Ask whether ADX is rising or falling. Rising means the gap between the two sides is widening. Falling means the move is becoming less one-sided. Do not give the line a job it does not have — it will not tell you which way to lean.
- Then see which DI line is on top. Direction lives only there. An ADX at 40 can be the August advance or the November decline.
- When ADX is below 20, discount the crosses. Mid-to-late October is the working example. Below 20 also does not mean the day cannot be violent; 19 August already covered that.
- Read a rollover from a high ADX as “less one-sided,” not “the turn is here.” Between 7 and 21 September, price was still allowed to make a new high.
- Layer structure, moving averages, ATR, or an oscillator. Support and resistance tell you where you are. ATR tells you how wide a day is. Stochastic or RSI tell you where the close sits in its recent range. ADX replaces none of those.
If you only keep one sentence: ask how strong it is, then who is in charge, and only then decide whether today’s cross is worth writing down.
9. What we will not do with ADX
- Treat an ADX above 40 as a countdown to a short or a long.
- Treat every +DI / -DI cross as a turn while ADX is below 20.
- Read ADX alone, ignore the two directional lines, and then complain that “it was strong, so why did it fall?”
- Change the lookback from 14 to 7 to 21 until the picture “agrees” with a trade already wanted.
- Port a rising 15-minute ADX onto the daily close.
- Use ADX as a substitute for ATR when measuring stop distance, or as a substitute for moving averages when defining structure.
- Use ADX as a stand-alone system. You can write rules if you want; you then have to define failure, costs, and the difference between spot and perpetual. We are not doing that here.
FAQ
What ADX settings do you use on BTC daily, and is 14 too slow?
We used Wilder’s 14-period defaults throughout, because that is what most people actually have on a crypto daily chart, and because we wanted the numbers in this article to be checkable. A shorter lookback will make ADX and the DI lines twitch more, and will produce more crosses. A longer lookback will make the August strength climb look even slower. None of those choices is “the correct ADX for Bitcoin.” Pick one, write it down, and do not retune it mid-review so that October’s whip disappears.
If ADX is below 20, should I just stay flat?
Not in our work. 7–19 August ran thirteen sessions below 20, and the last of them was a +7.12% breakout. 21–30 October was also below 20, while the close moved from about 84,093 to about 77,369. Below 20 only means “strength is weak, so crosses are unreliable.” It does not mean price will sit still, and it does not mean you must be out. If you need a single sentence: treat it as a discount on the cross, not as a closed market.
Is a +DI cross above -DI a buy signal on BTC?
No. 19 August was a useful recapture because the close was also leaving a quiet shelf, and because ADX then followed through. 19 October and 21 October were also upside crosses, with ADX already near 20, and they were crossed back the other way almost immediately. A cross is a change in the relationship between two smoothed directional lines. It does not know your inventory and it does not owe you a trend.
If ADX reaches 40 or 50, is the trend almost over?
There is no such cap. The peak in this sample is 48.39 on 7 September, after which price still made the window high of 87,395.67 on 21 September. From 27 August through 7 October, ADX spent forty-two sessions at or above 40. We do not have a maximum. We have a refusal to treat “already strong” as “must reverse tomorrow.”
Why did price make a new high on 21 September if ADX was already below its 7 September peak?
Because ADX is a smooth of DX, and DX measures the gap between +DI and -DI, not the height of price itself. After 7 September that gap stopped widening, so ADX came down from its high; price was still allowed to push further while +DI remained in front. That is “less one-sided than it was,” not a ready-made bearish divergence. If you care more about whether an oscillator confirmed those highs, the September–October stretch in the Stochastic tutorial is the companion discussion.
How do you use ADX with ATR, or with moving averages?
ATR measures width. ADX measures strength. Moving averages give you a location. A moving average will not tell you how one-sided the push has been, and ADX will not tell you how many dollars a 2× ATR stop is worth right now. On our own desk these are three separate questions: where we are, how wide a day is, and how convincing the direction looks.
Can I use this the same way on a 15-minute or 1-hour BTC chart?
You can plot the same 14-period ADX on any clock. You cannot import this article’s dates and conclusions onto that clock. A 14-bar window on the 15-minute chart is three and a half hours, not two weeks. Weak trends and noisy crosses still happen; they just expire faster. Our own order is daily first.
Can ADX alone be a trading system?
You can write one. You will need a rule for crosses when ADX is below 20, a rule for when a rollover from a high is ignored, a position-size rule for when ATR is expanding (see the ATR tutorial), and an honest cost model. Chasing every cross on this BTC daily sample would have whipped you in mid-October. Fading every ADX print above 40 would have faded late August and bought November. That is the failure mode. Everything in this article is for education and review.
Does an ADX reading tell me anything about an event contract or a JEV direction?
Only indirectly. An event contract has its own expiry, settlement index and payout rules — start with the BTC event contract guide if that is the product you are studying. JEV is a separate five-direction assessment with a confidence number that is not a win rate. ADX can be part of the market context we feed the model, and part of the context we read by hand. It is not a settlement forecast.
Data and references
- Klines: Binance public API, BTCUSDT daily, UTC, primarily 2026-07-01 to 2026-11-19. The 20 November session was still open at the time of writing and is excluded as an unfinished day.
- Indicator: Wilder ADX / DMI (14) — TR, +DM and -DM start with a 14-day simple average, then follow an RMA; +DI and -DI are the ratio of those smoothed values; ADX is the same smooth applied to DX.
- The Average Directional Index comes out of Welles Wilder’s 1978 New Concepts in Technical Trading Systems. The implementation above is the common charting default, not a claim about any particular broker’s internals.
- Earlier pieces in this Coinpred series, when you want the neighboring tools: candlesticks, support and resistance, moving averages, RSI, MACD, Bollinger Bands, volume, Fibonacci, Stochastic, ATR, and the companion Ichimoku tutorial.
All charts were drawn by Coinpred from the public data above. If you spot a date or a figure that does not recompute, write to us through the authors page or via the contact route listed there (@xbluev). Trading involves risk — decide independently and size carefully. This article is educational only and is not investment advice. Coinpred is not available to users in mainland China.