After volume, the next question we hear is: “Where might a pullback pause?” One of the most asked — and most mythologized — answers in technical analysis is the Fibonacci retracement.
Drop the mystique first. Fibonacci levels are not a law that BTC must reverse at 0.618. They are a tape measure: take a completed swing and draw horizontal references at fixed ratios. We treat them practically — weight rises when a Fib overlaps a support/resistance zone, a moving average, or a volume cue; a lonely dashed line is never enough to trade.
All prices come from Binance public BTCUSDT daily klines (UTC). The upswing example runs 2026-08-14 swing low 62,535.24 → 2026-09-21 swing high 87,395.67. The downswing example runs 21 Sep high → 30 Oct low 76,325.98. We focus on the workhorse ratios 0.382 / 0.5 / 0.618 (with 0.236 and 0.786 for context).
1. What a retracement actually draws
Picture an advance from a low to a high. When price turns back, traders ask how much of that advance the pullback might give back. Fibonacci offers a shortlist of ratios markets have stared at for decades — roughly 38.2%, 50%, 61.8%, and friends.
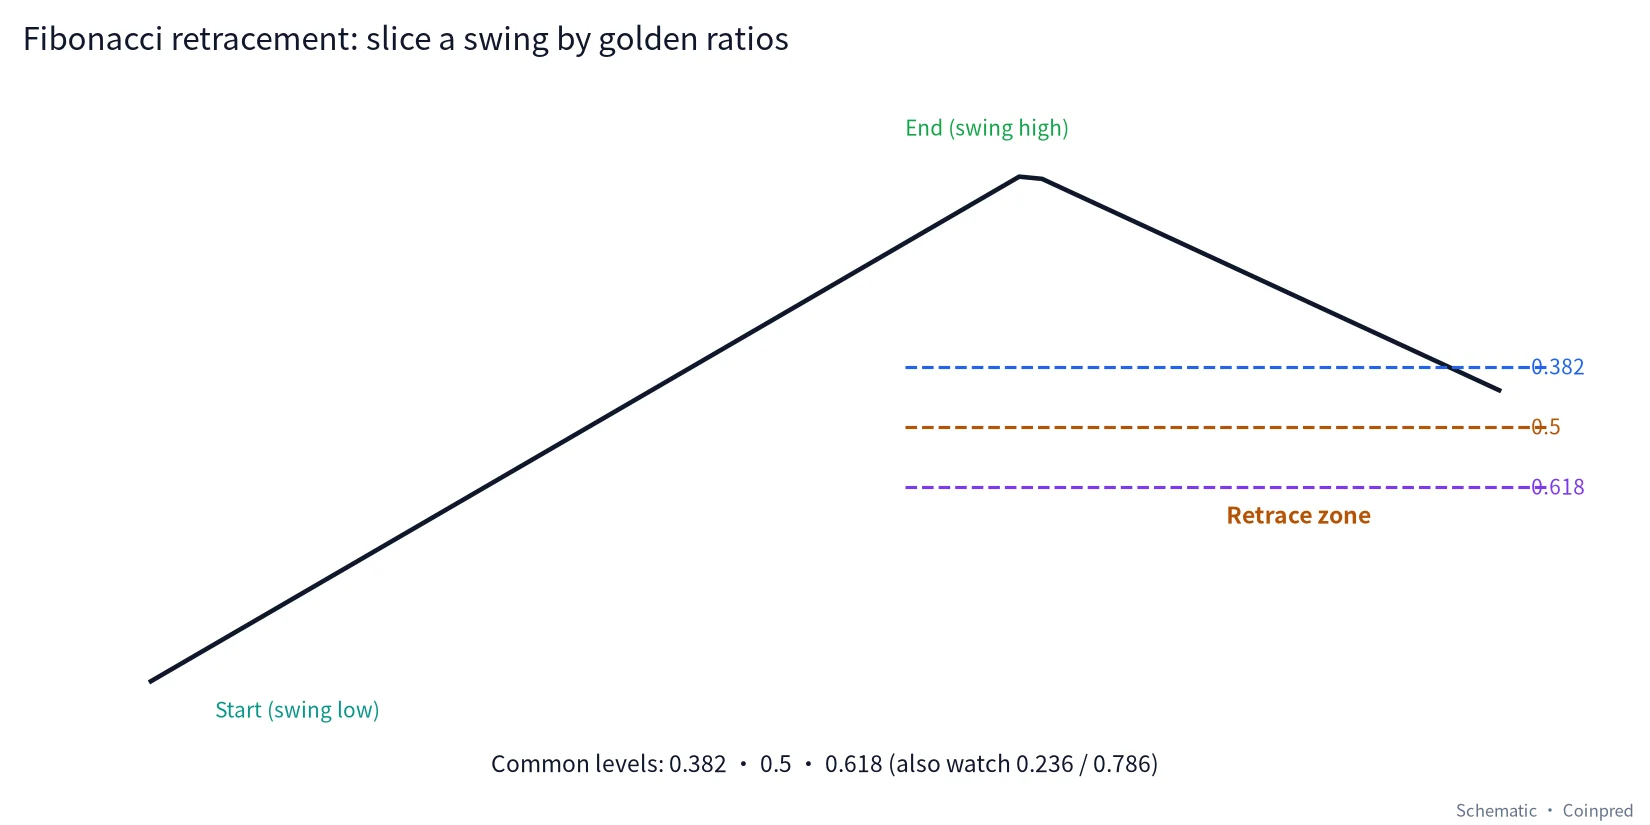
For an upswing pullback:
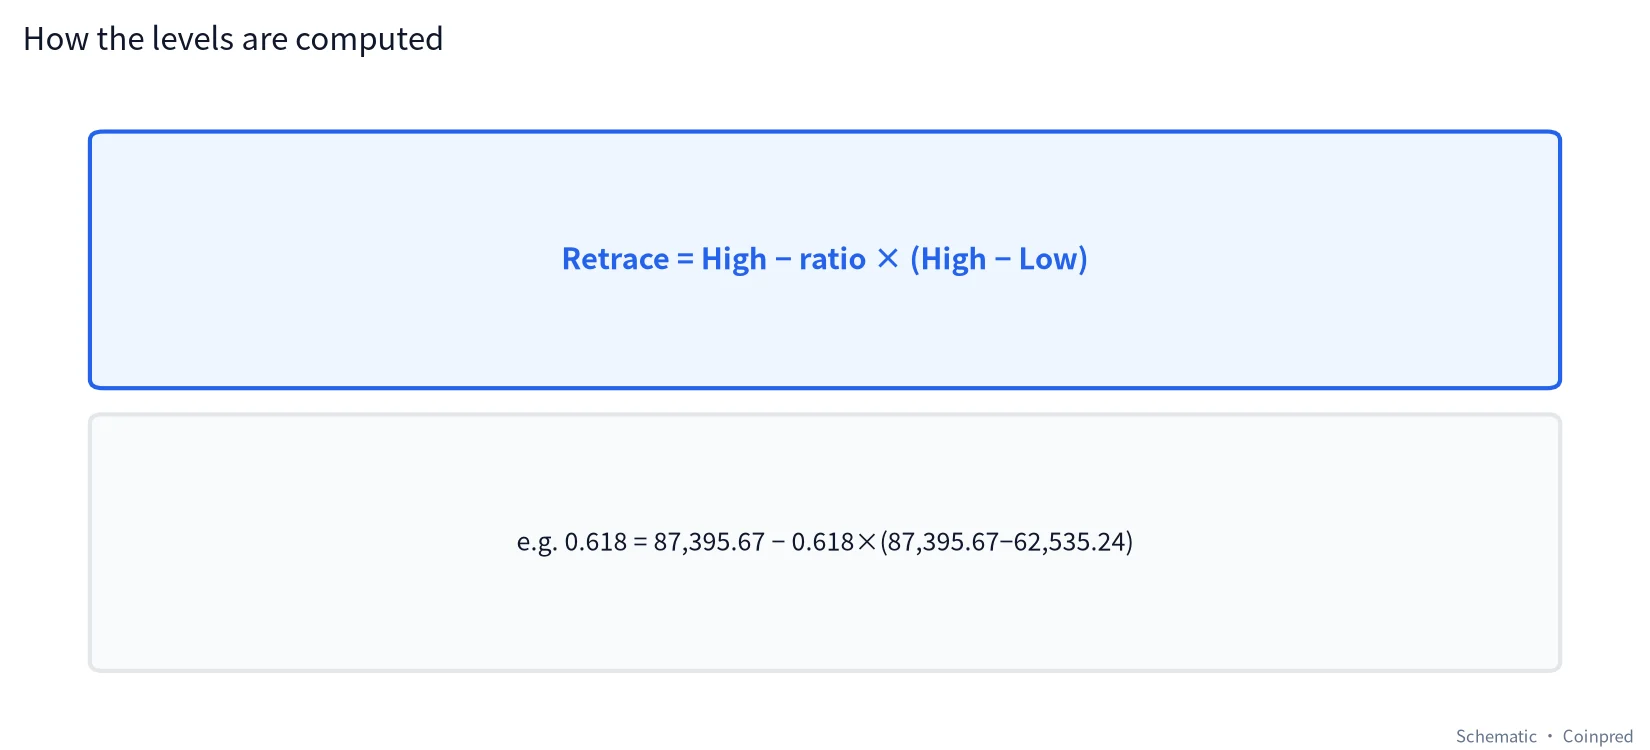
Retracement price = High − ratio × (High − Low)
For a downswing bounce:
Retracement price = Low + ratio × (High − Low)
(Charting apps usually make you drag from swing start to swing end; direction sets the geometry. The arithmetic is the same.)
2. Overview: Aug14 → Sep21 on the daily chart
Lay Jul–Oct candles and overlay the Aug14→Sep21 retracement grid:
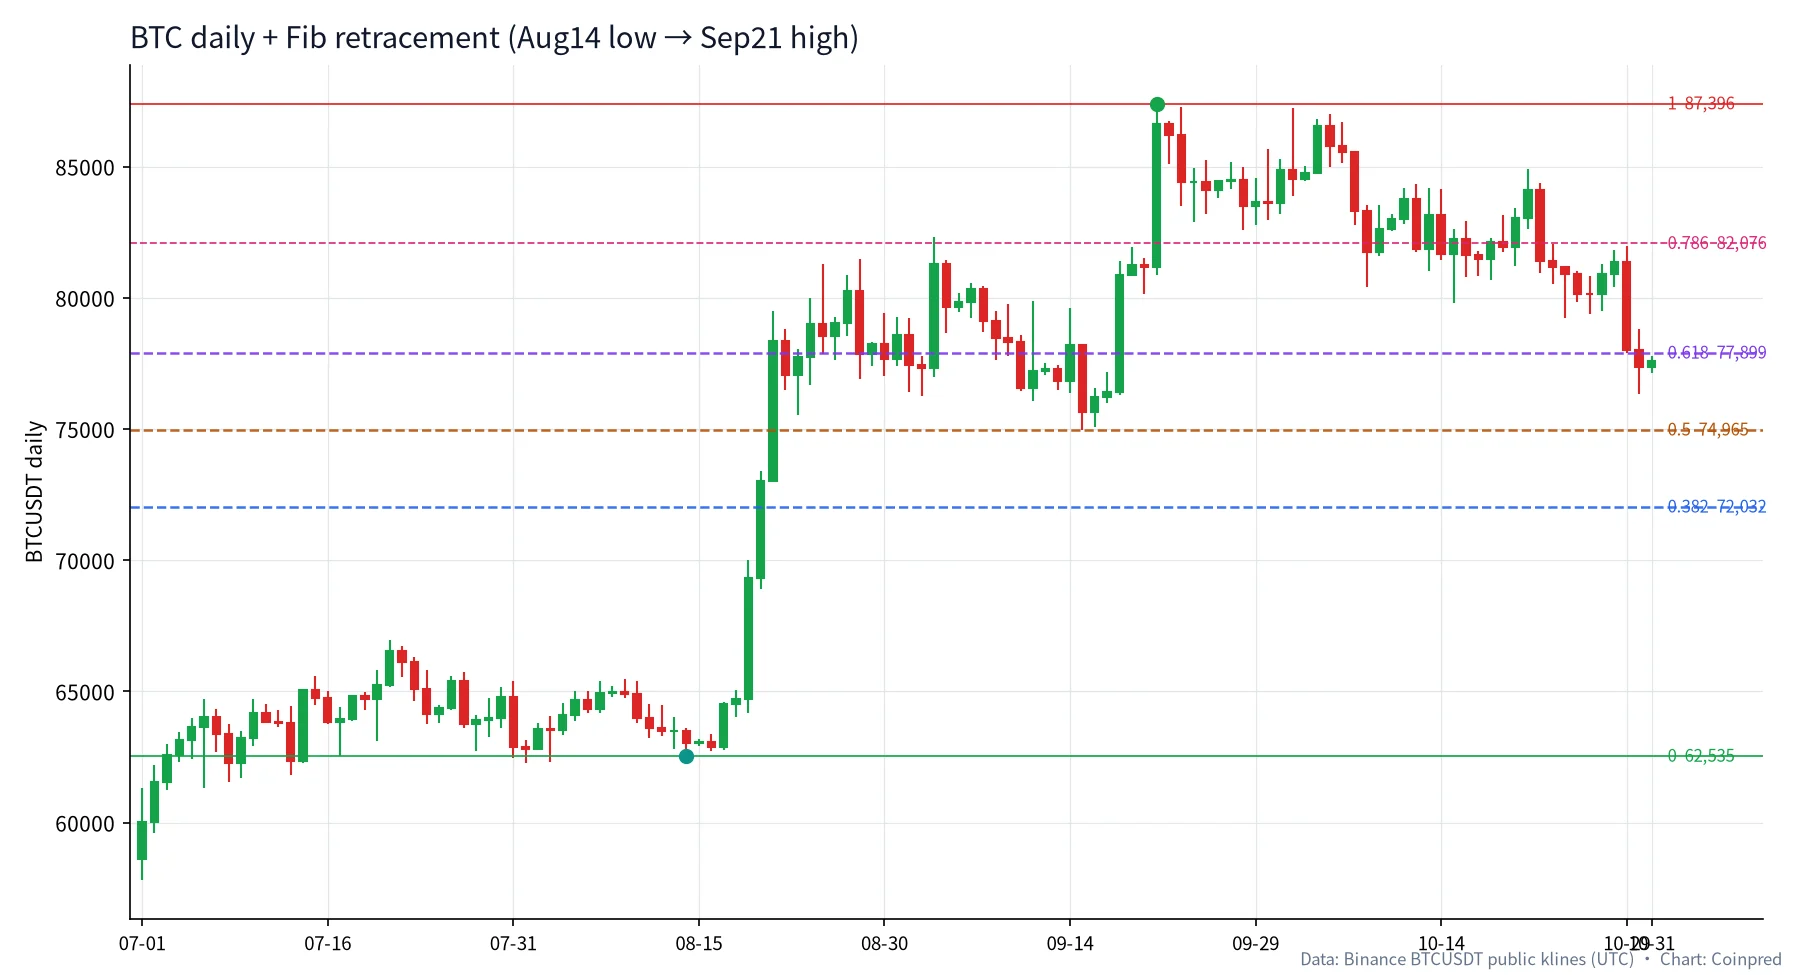
Computed levels (rounded to cents):
| Ratio | Price (USDT) | Role |
|---|---|---|
| 0 (low) | 62,535.24 | Swing start |
| 0.236 | 68,402.30 | Shallow |
| 0.382 | 72,031.92 | Common shallow–mid |
| 0.5 | 74,965.46 | Halfway (not a pure Fib number, but ubiquitous) |
| 0.618 | 77,898.99 | Golden retracement |
| 0.786 | 82,075.54 | Deep |
| 1 (high) | 87,395.67 | Swing end |
High − Low = 24,860.43 USDT. Example for 0.618: 87,395.67 − 0.618 × 24,860.43 ≈ 77,898.99.
3. A textbook tag: 15 Sep low vs the 0.5 level
Theory is cheap until price interacts. Early September sold off from the highs; the 15 Sep low is striking:
| Date (UTC) | Low | Close | Distance to 0.5 (74,965.46) |
|---|---|---|---|
| 09-11 | 76,046.58 | 77,225.70 | Low ~1,081 above |
| 09-14 | 76,388.72 | 78,189.21 | Low ~1,423 above |
| 09-15 | 74,967.97 | 75,644.48 | ≈ +2.5 USDT |
| 09-16 | 75,064.82 | 76,206.01 | Low ~99 above |
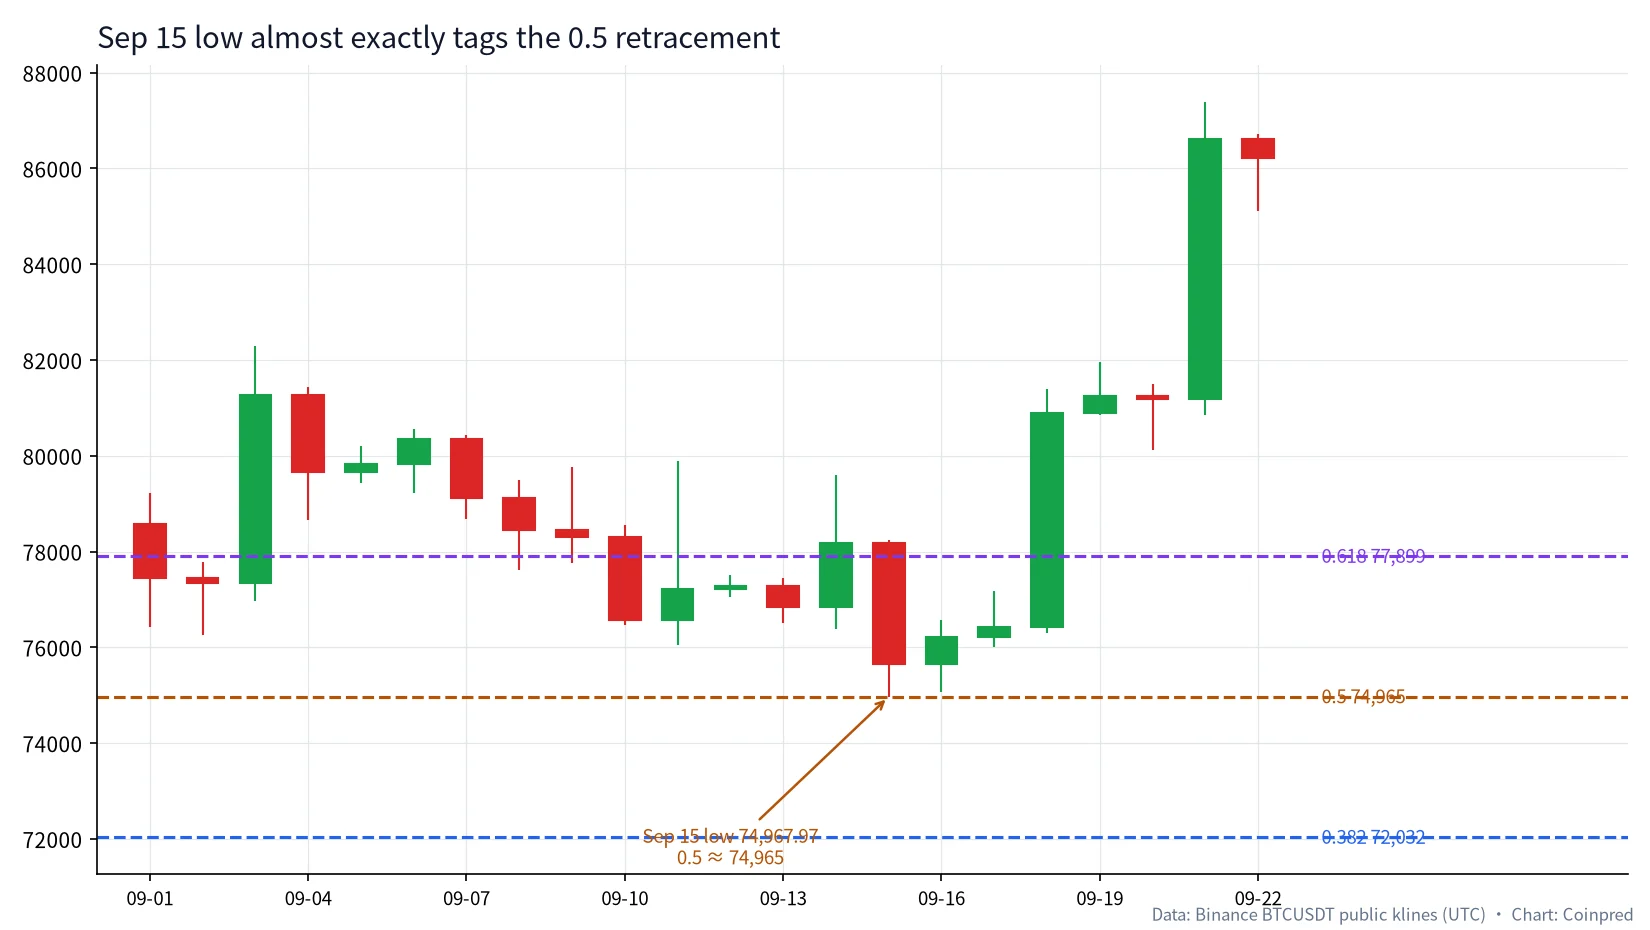
The 15 Sep low at 74,967.97 sat within about three dollars of the 0.5 level at 74,965.46. We did not move the anchors after the fact to force the fit — the anchors are the earlier 14 Aug low and the 21 Sep high. Honesty check, though: on 15 Sep traders could not yet know 21 Sep would be the swing high. Live charts more often pre-draw from a confirmed swing (for example the late-August / 3 Sep highs) and refine once a higher high locks in.
Two more caveats we say out loud:
- Perfect tags grab attention; the same sample also has near-misses and clean breaks — Fib is not a magnet.
- Volume around 15 Sep was not climactic (see the volume article); it looked more like a pause than a capitulation flush. Whether that pause “held” still depended on closes reclaiming and on whether price left with volume.
We use the example because it teaches the halfway retracement cleanly — not because every future dip will kiss the exact cent.
4. Downswings get Fibs too: Sep21 → Oct30
Same toolkit for declines. From the 21 Sep high 87,395.67 to the 30 Oct low 76,325.98 (drop 11,069.69), bounce references become:
| Ratio | Price (USDT) |
|---|---|
| 0 (high) | 87,395.67 |
| 0.236 | 84,783.22 |
| 0.382 | 83,167.05 |
| 0.5 | 81,860.82 |
| 0.618 | 80,554.60 |
| 0.786 | 78,694.89 |
| 1 (low) | 76,325.98 |
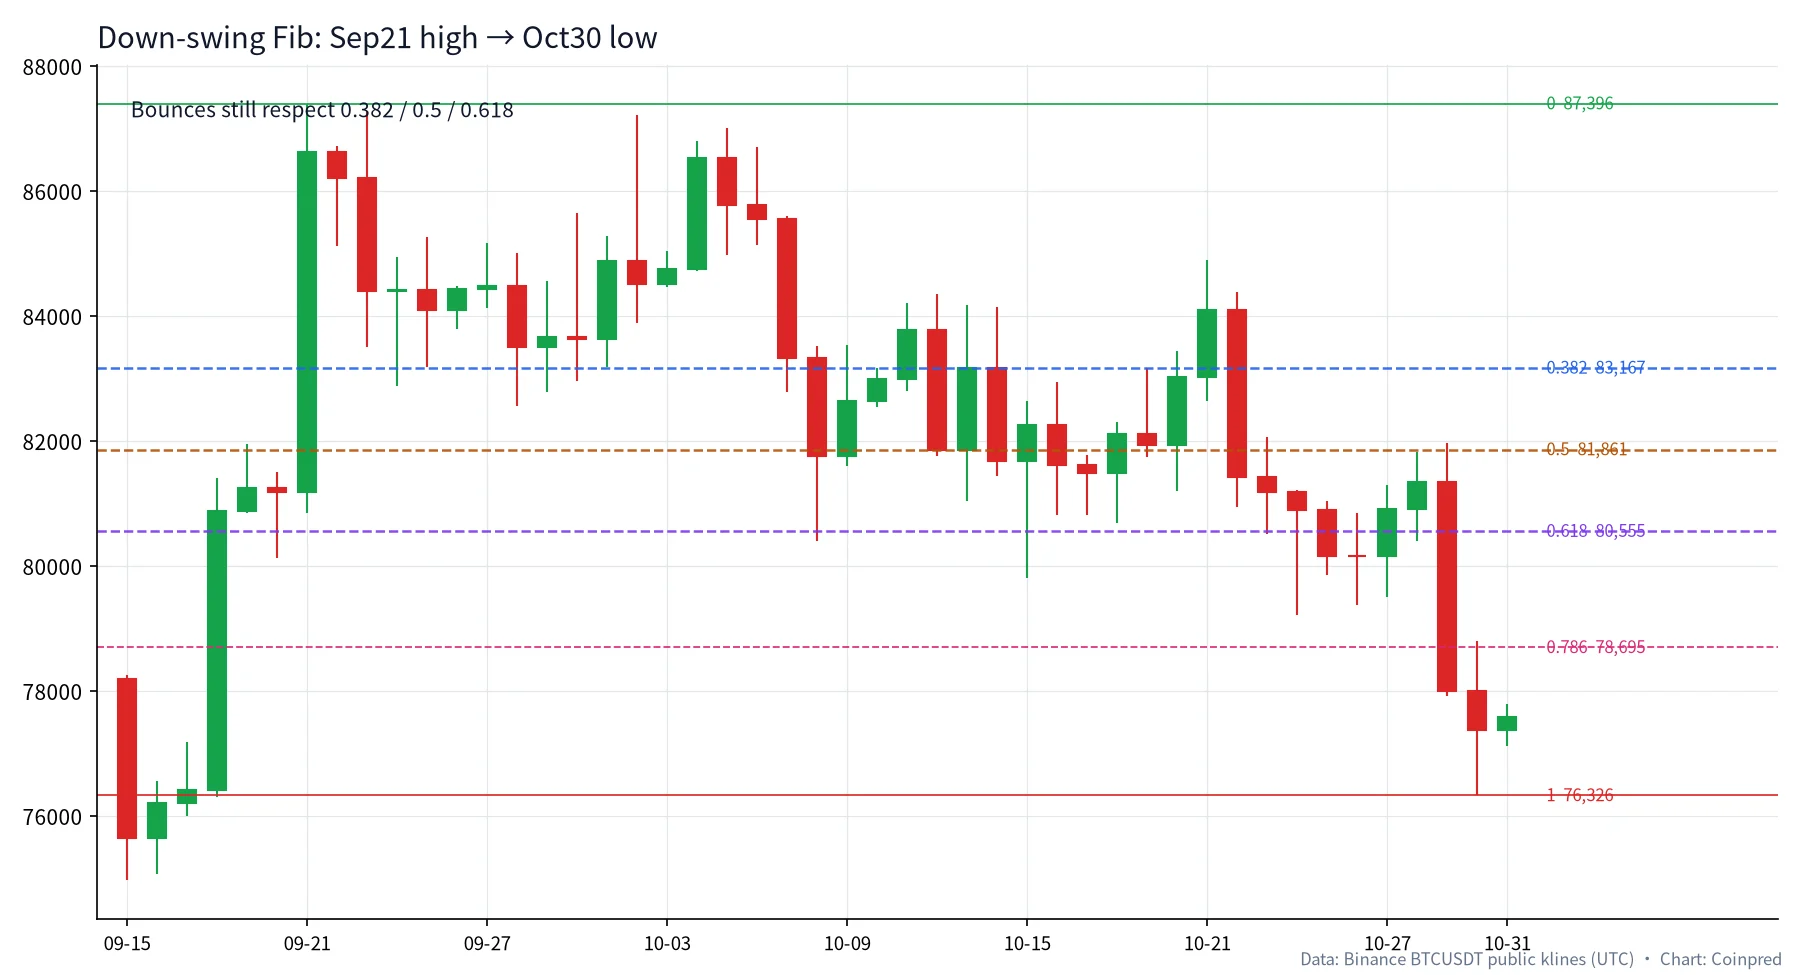
Formula: price = High − ratio × (High − Low). Example 0.382: 87,395.67 − 0.382 × 11,069.69 ≈ 83,167.05.
5. October: chopping inside the 0.382–0.618 band
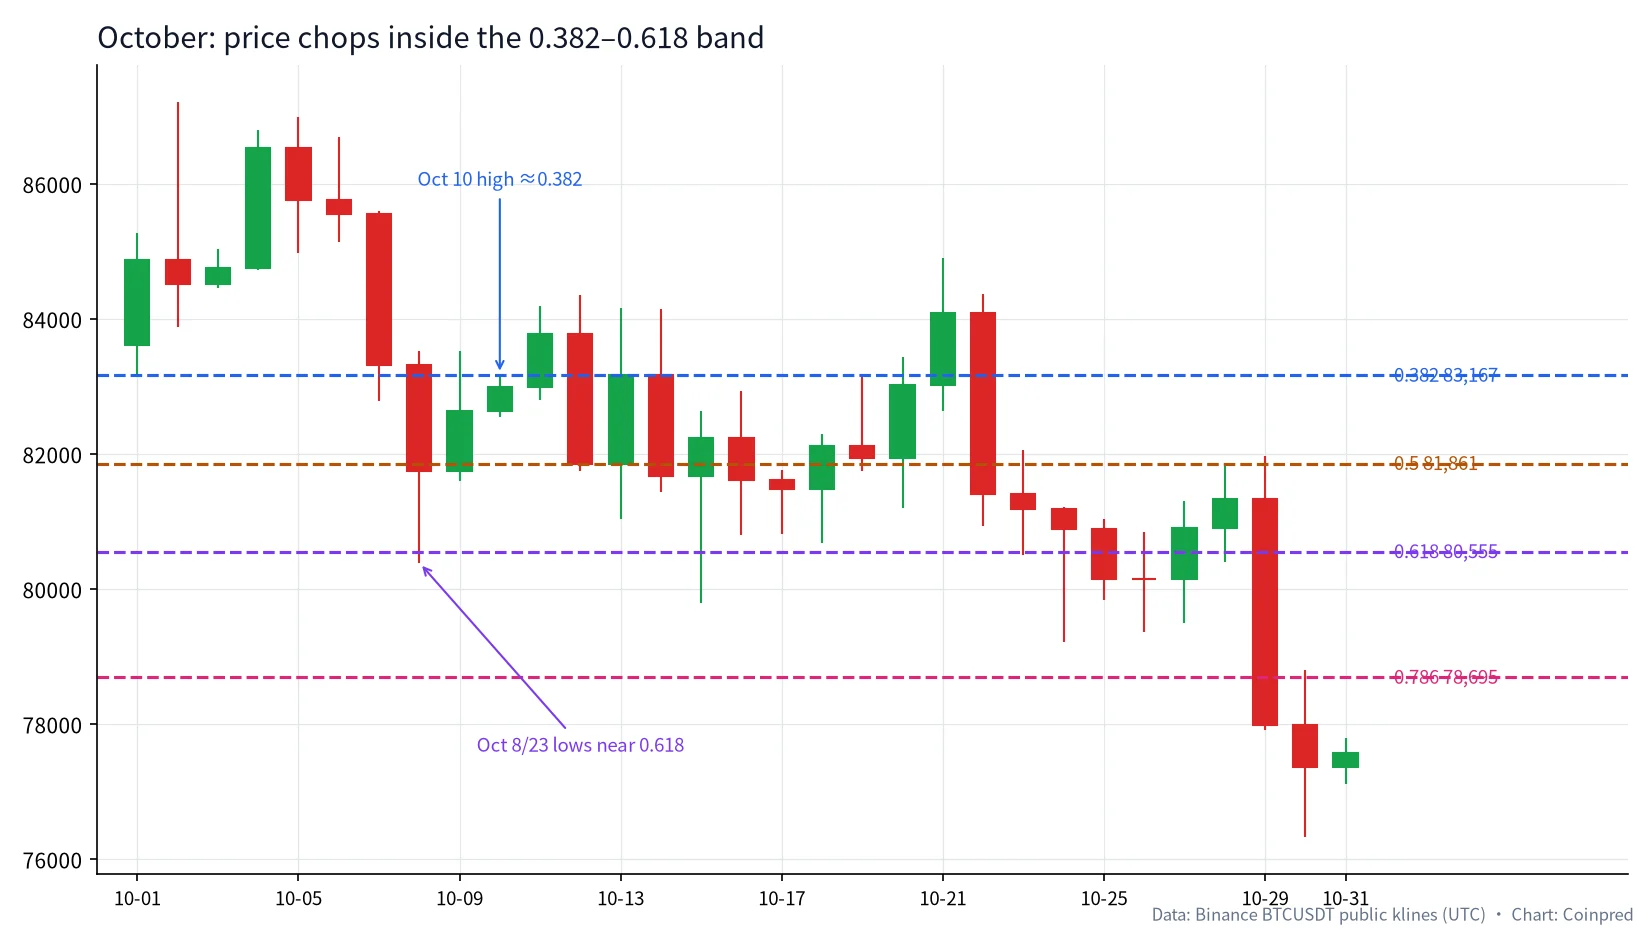
Zoom the month:
| Date (UTC) | Key print | Nearby Fib | Observation |
|---|---|---|---|
| 10-08 | Low 80,393.56 | 0.618 ≈ 80,554.60 | Slightly undercuts, then recovers |
| 10-10 | High 83,173.29 | 0.382 ≈ 83,167.05 | High almost tags 0.382 |
| 10-12 | Close 81,850.00 | 0.5 ≈ 81,860.82 | Close hugs 0.5 |
| 10-15 | Low 79,800.00 | Below 0.618 | Pierce, then close 82,245.93 back above |
| 10-23 | Low 80,513.00 | 0.618 ≈ 80,554.60 | Another test |
| 10-24 | Low 79,220.74 | Near 0.786 ≈ 78,694.89 | Deeper probe |
| 10-29–30 | Low 76,325.98 | Toward 1.0 | Swing extends into the low |
How we read it:
- 10 Oct’s high ≈ 0.382 and the repeated 0.618 tests on 8/23 Oct suggest traders were defending this band — or that the Fibs simply overlapped zones that already mattered for structure.
- A pierce-and-reclaim (15 Oct) is not the same weight as closes that keep failing lower (after 29 Oct). Same mantra as Bollinger and S/R: the close beats the intraday spike.
6. Extensions: measuring beyond the original swing
Retracements look backward. Extensions ask how far a move might travel beyond the swing. Common targets: 1.272 and 1.618.
For the Aug14→Sep21 advance, schematic levels are:
| Ratio | Price (USDT) |
|---|---|
| 1.0 | 87,395.67 (original high) |
| 1.272 | 94,157.71 |
| 1.618 | 102,759.42 |
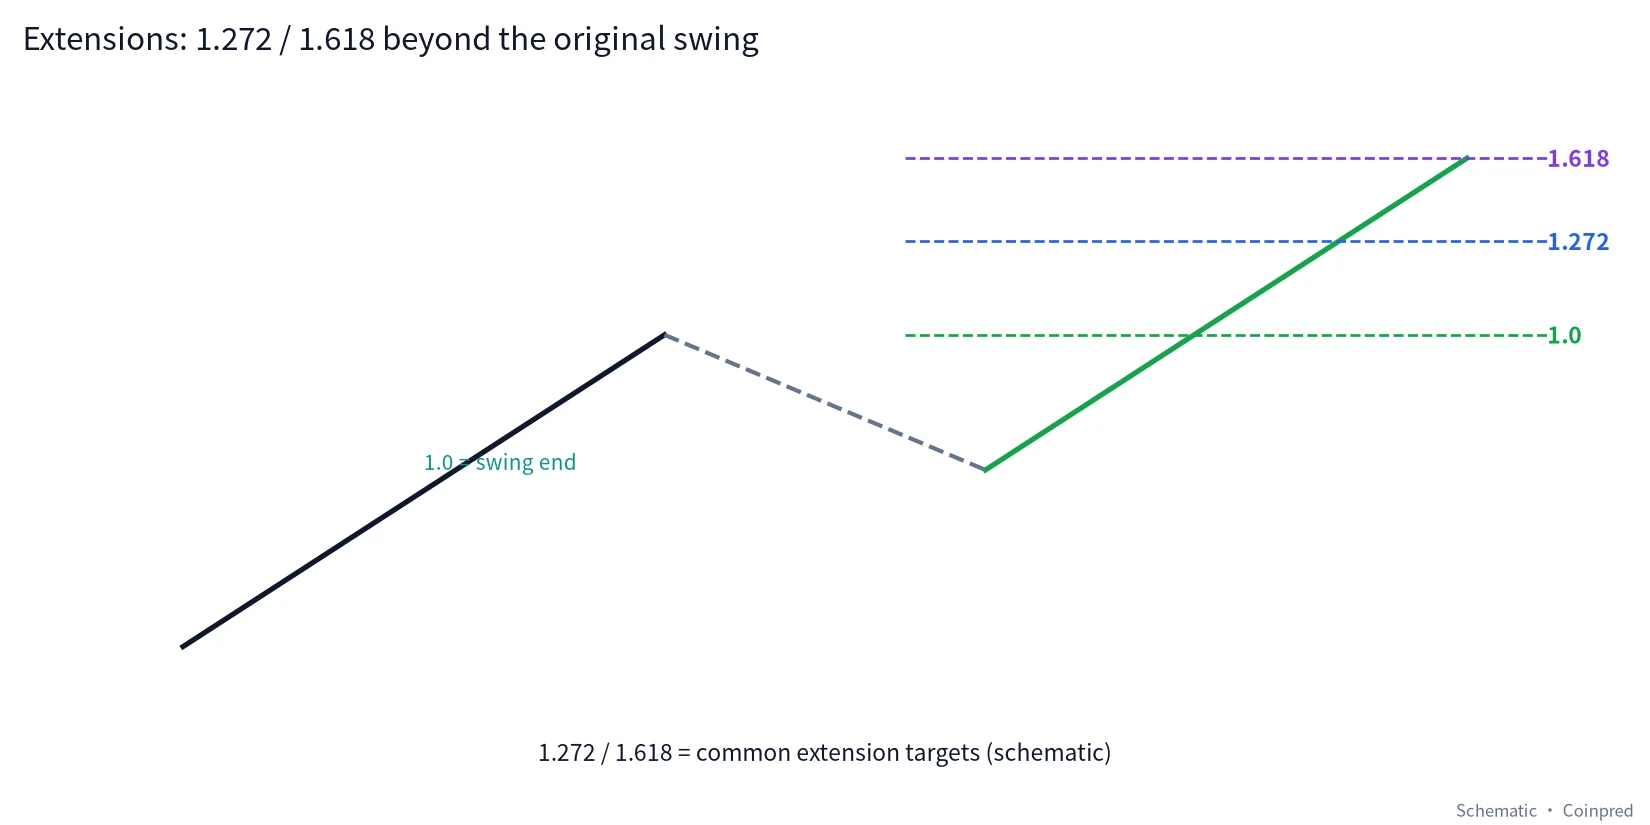
Price had not delivered those extension targets by the time we wrote this, so they stay formula demos, not forecasts. Extensions need structure and volume the same way retracements do; a naked projection is noise.
7. A five-step Fibonacci habit
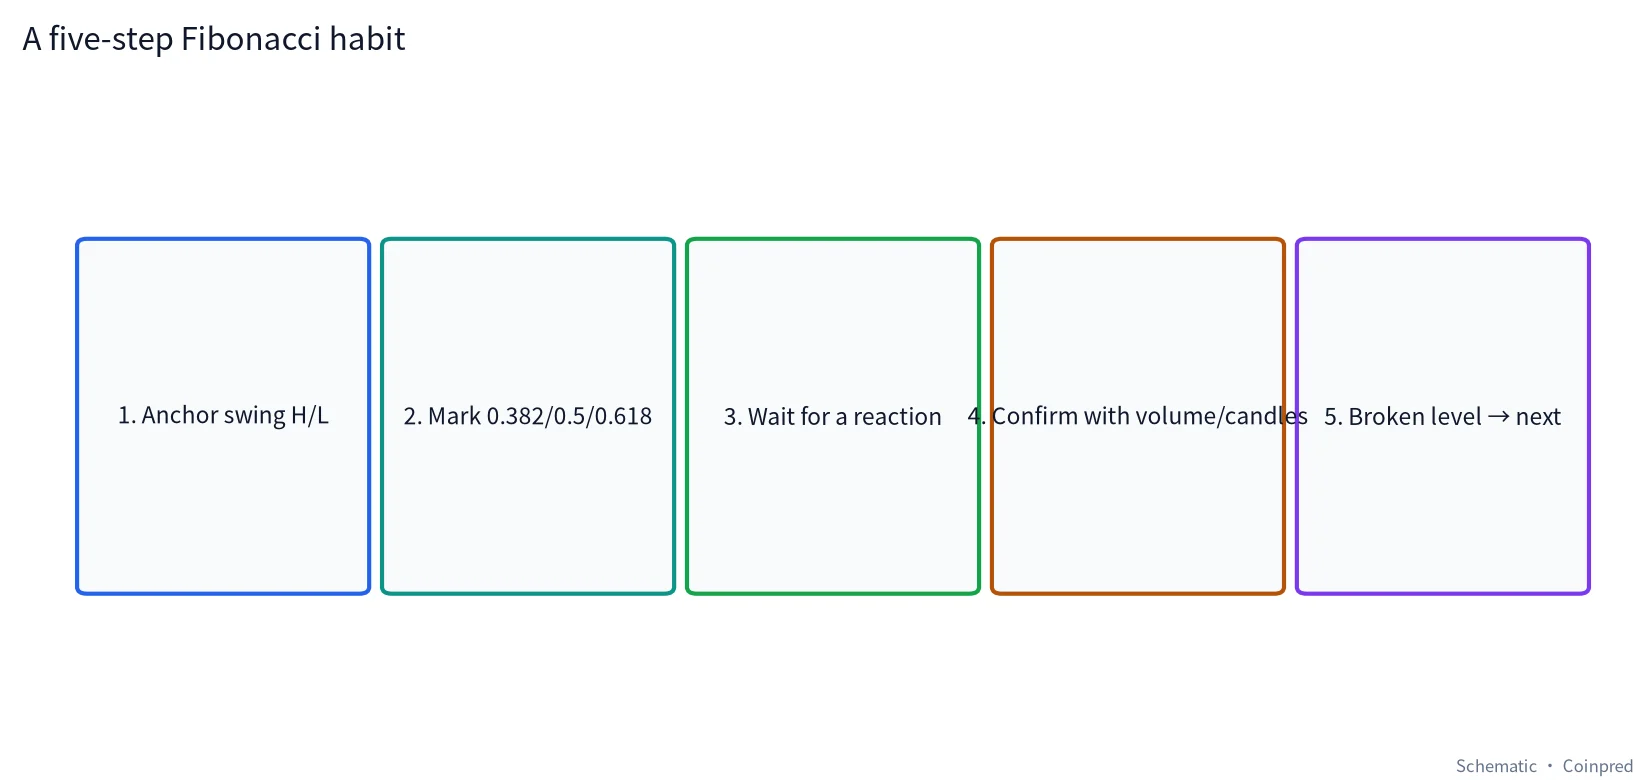
- Anchor real swing highs/lows — e.g. left/right 5-bar swings, not random wick tips.
- Mark 0.382 / 0.5 / 0.618 first — keep 0.236 and 0.786 as helpers.
- Wait for a reaction at the level — rejection wicks, stalled closes, or volume shifts.
- Confirm with volume and candles — a Fib plus a high-volume reversal bar beats a lonely dashed line; see the volume tutorial.
- If broken, look to the next stair — lose 0.382, watch 0.5; lose 0.5, watch 0.618. Stairs, not fortress walls.
8. Common traps
- Cherry-picking anchors until every dip “fits” — that is curve fitting, not analysis.
- Forgetting that swing highs are often only obvious afterward — trade confirmed swings and accept redraws.
- Obsessing over 0.618 alone — 0.382 and 0.5 show up constantly (this sample’s 0.5 tag is the star).
- Floating Fibs in a vacuum — overlay them on S/R, averages, gaps, or round numbers.
- Treating extensions as guaranteed magnets — they are path hypotheses, not promises.
FAQ
Why include 0.5 if it is not a Fibonacci ratio?
Pure Fib math highlights ~0.618 and ~0.382. 0.5 is the market’s halfway habit, drawn by default in almost every platform. We keep it because traders actually use it.
Which way do I drag the tool?
Upswing retracement: low → high. Downswing bounce grid: high → low. Reverse the drag and the lines will lie.
Should daily and 4H Fibs be separate?
Yes. Different swings, different grids. We usually frame on the daily, then refine on 4H — the same spirit as multi-timeframe support and resistance.
Does a wick through a Fib kill the level?
Intraday pierces are common. We care more whether closes keep living on the other side, and whether the next ratio starts to matter. One shadow is not a structural verdict.
What if Fibs disagree with moving averages?
Do not pick a winner — look for confluence. A 0.618 that also meets SMA20/SMA50 or old resistance-turned-support outweighs an isolated dash. See the moving-average tutorial.
Can Fibonacci alone be a system?
You can write rules, but you must define how anchors are chosen, what confirms a reaction, and what counts as failure. Blindly fading every 0.618 in a trend is expensive. Everything here is educational review — not investment advice.
Is there a cosmic link between golden ratios and crypto?
No iron law. The levels are popular because many traders watch them — a self-fulfilling liquidity magnet — often overlapping structure that would matter anyway. Stay respectful and skeptical at once.
Data and references
- Klines: Binance public API, BTCUSDT daily (UTC); retracements and extensions computed from swing highs/lows.
- Binance Academy: Fibonacci retracement
- Investopedia: Fibonacci Retracement Levels
- Investopedia: Fibonacci Extensions
All charts were drawn by Coinpred from the public data above. Trading involves risk — decide independently and size carefully. This article is educational only and is not investment advice.