So far in this series we covered how to read candles, how to draw support and resistance, and how to use RSI. The next tool shows up on almost every serious chart: the moving average (MA).
One-line definition: an MA averages the last N closes by some rule and connects those averages into a smoother line. It answers “where has the center of price been lately?” It does not forecast the future, but it turns jagged noise into a readable trend and often behaves like dynamic support or resistance.
Every price below comes from Binance’s public BTCUSDT daily candles (UTC). Averages are computed from closes. You can download the same data and check us.
1. SMA vs EMA: two ways to smooth
The two workhorses:
- SMA (simple moving average): arithmetic mean of the last N closes — equal weight on every bar.
- EMA (exponential moving average): more weight on recent closes, so it hugs price and turns faster.
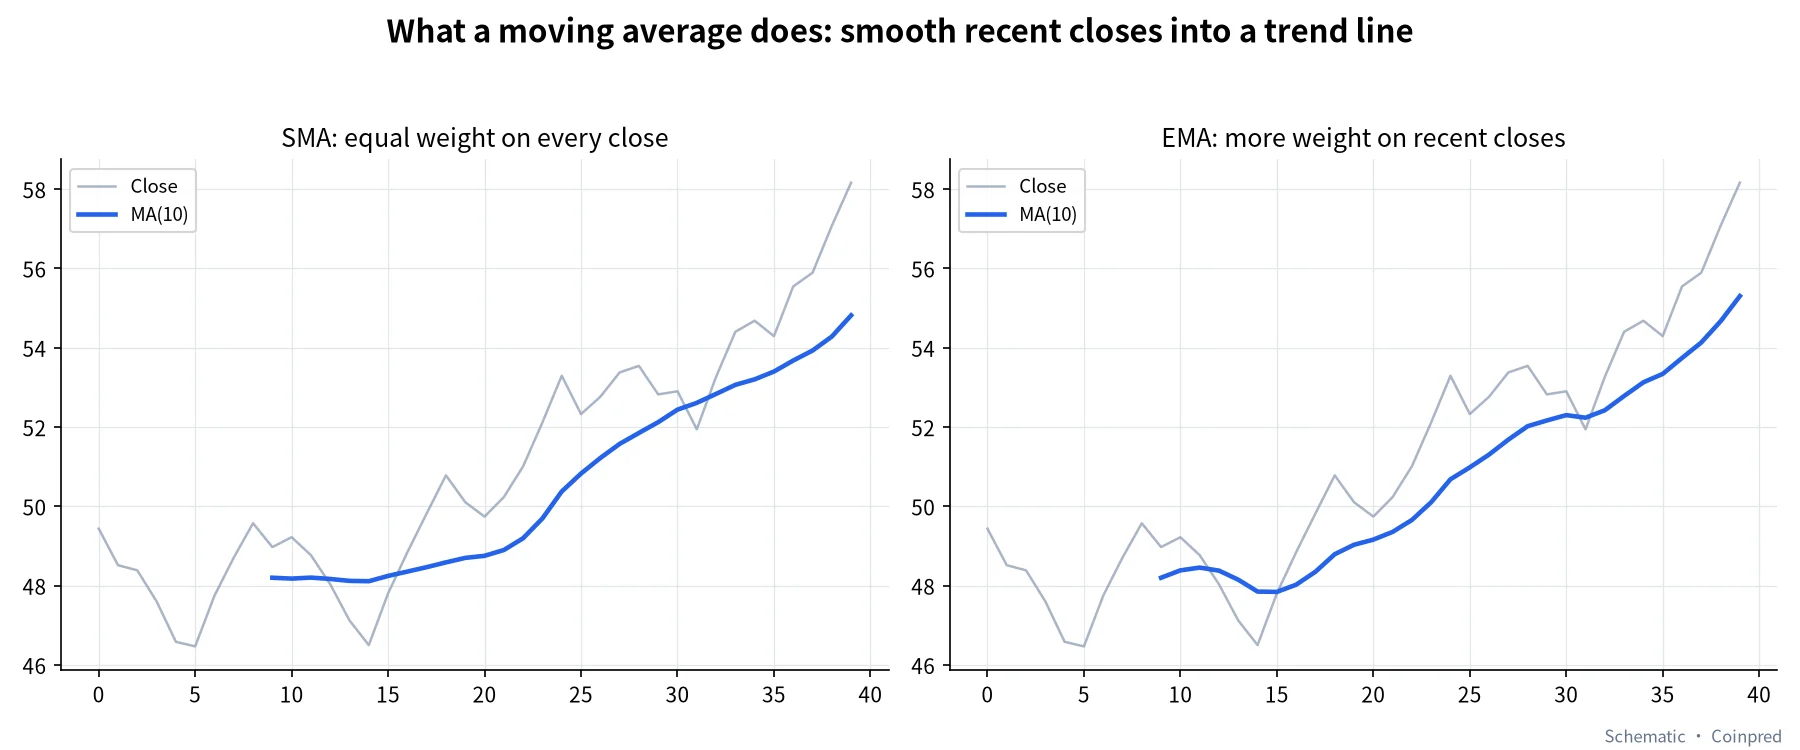
Neither wins forever. For daily crypto reviews we lean on EMA, because the market is fast and SMA can lag a beat; but if your system was written around SMA, do not casually swap in EMA — consistency beats “which line is smarter.”
The rest of this article uses EMA20, EMA50 and EMA200 — a very common crypto trio.
2. Big picture: three EMAs on BTC daily
July 1 to October 31, 2026:
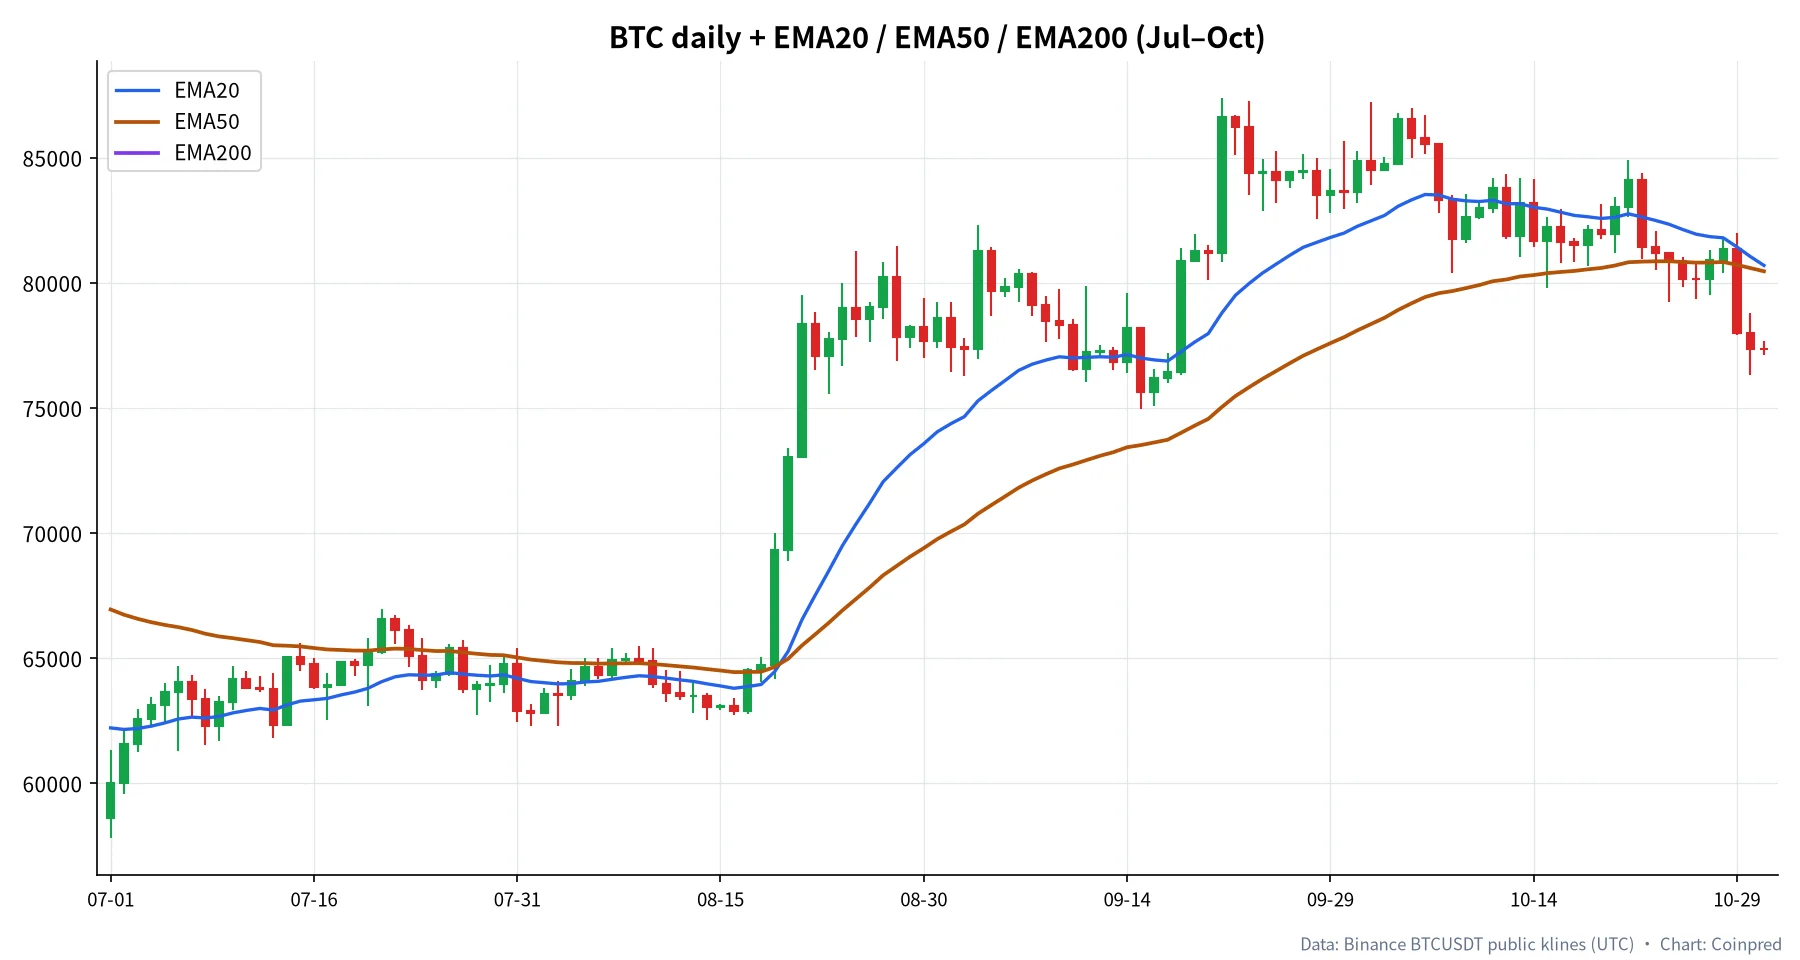
We mainly watch three things:
- Stack: shorter MA above longer MA is a bullish stack; the reverse is bearish; tangled lines mean chop.
- Price vs the average: closes above or below the key MA.
- Slope: rising, flat, or rolling over.
Approximate values near the 2026-10-31 UTC daily bar (from closes):
| Metric | Approx. (USDT) | vs price (~77,336) |
|---|---|---|
| EMA20 | 80,693 | price ~4.2% below |
| EMA50 | 80,460 | price ~3.9% below |
| EMA200 | 73,178 | price ~5.7% above |
| SMA20 | 81,099 | a bit above EMA20 |
In plain English: at the time of writing, price had slipped under the short and medium averages but still sat above the long EMA200 — cool on the medium-term tape, long average not yet lost. Description, not a forecast.
3. Golden cross: EMA20 over EMA50 on 2026-08-20
A “golden cross” is a short MA crossing above a long MA; a “death cross” is the opposite. Catchy names, terrible standalone triggers — ranges will whip you with repeated crosses.
Scanning recent months for EMA20/EMA50 crosses, a clear golden cross printed on 2026-08-20:
| Item | Value |
|---|---|
| Cross date (UTC) | 2026-08-20 |
| Close that day | 73,025.15 |
| EMA20 that day | ~65,276 |
| EMA50 that day | ~64,977 |
| Close ~10 sessions later | 77,682.00 |
| Close ~30 sessions later | 81,249.99 |
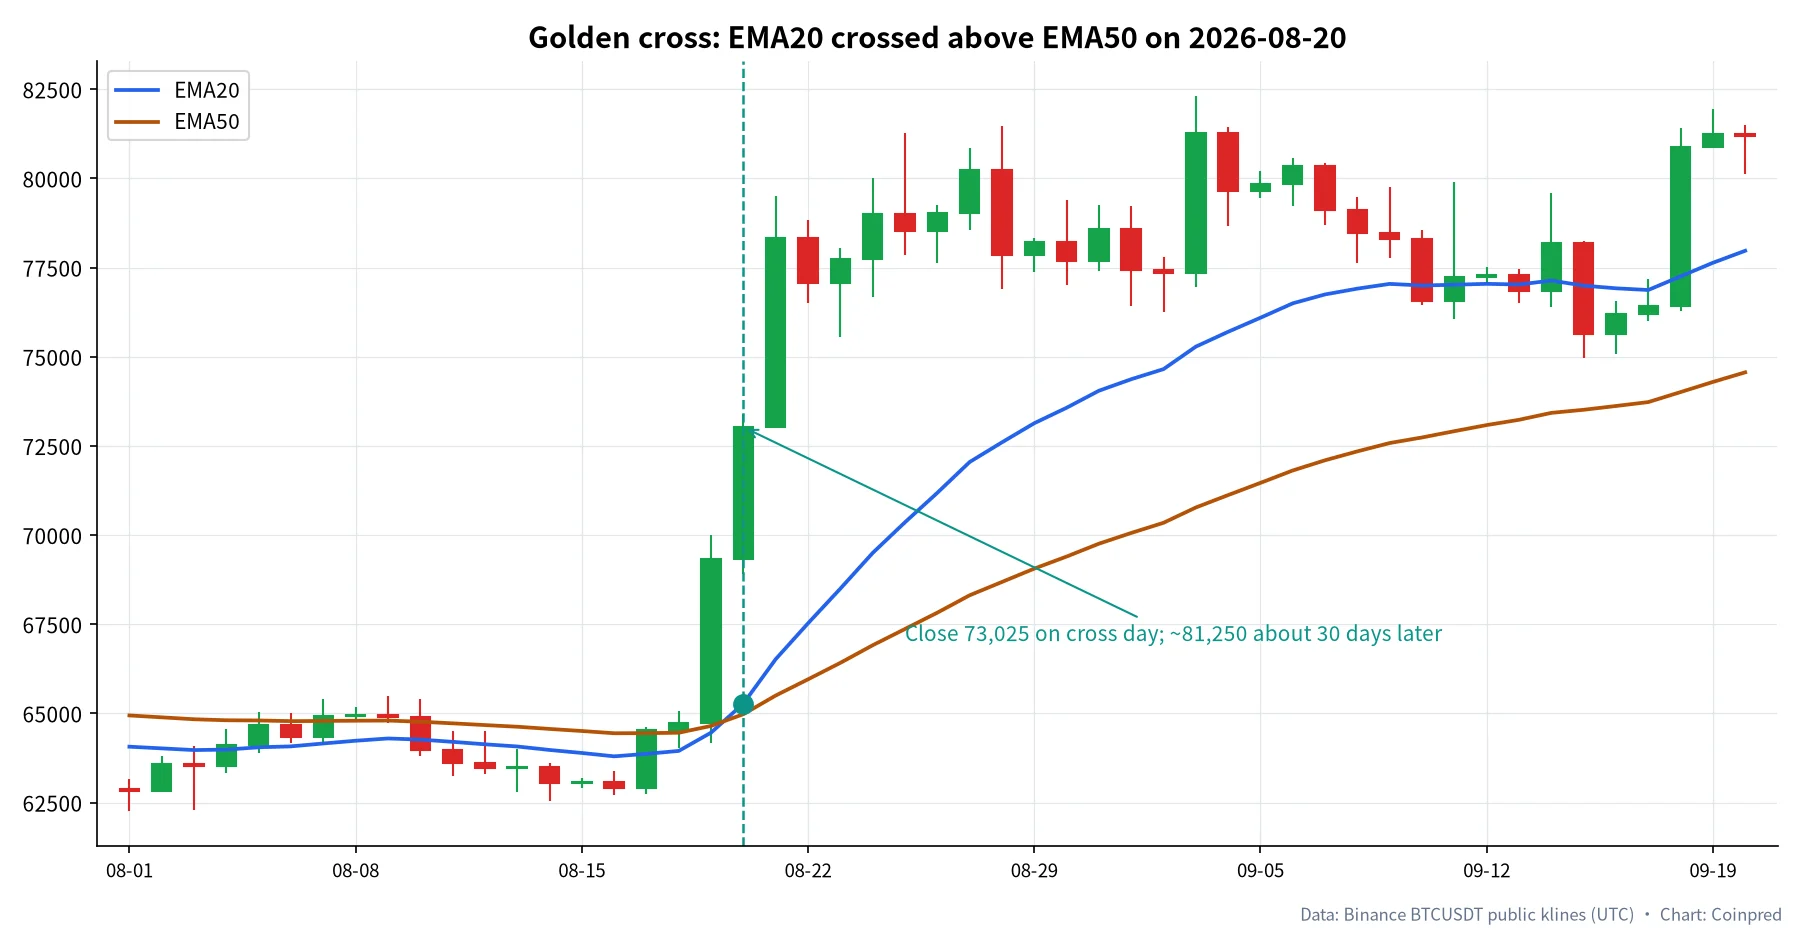
What we actually care about:
- The cross arrived after the late-August breakout from the Jul–Aug range (see the S/R tutorial), not out of thin air.
- On the cross day, price was already well above both averages — more of a trend confirmation than a bottom-fishing signal.
- About 30 sessions later the close was near 81,250. That is a hindsight path with pullbacks inside it, not a promise that “golden crosses rally for 30 days.”
4. Retests in an uptrend: price tagging EMA50
The second common use is treating an MA as dynamic support/resistance. September had a clean-ish example:
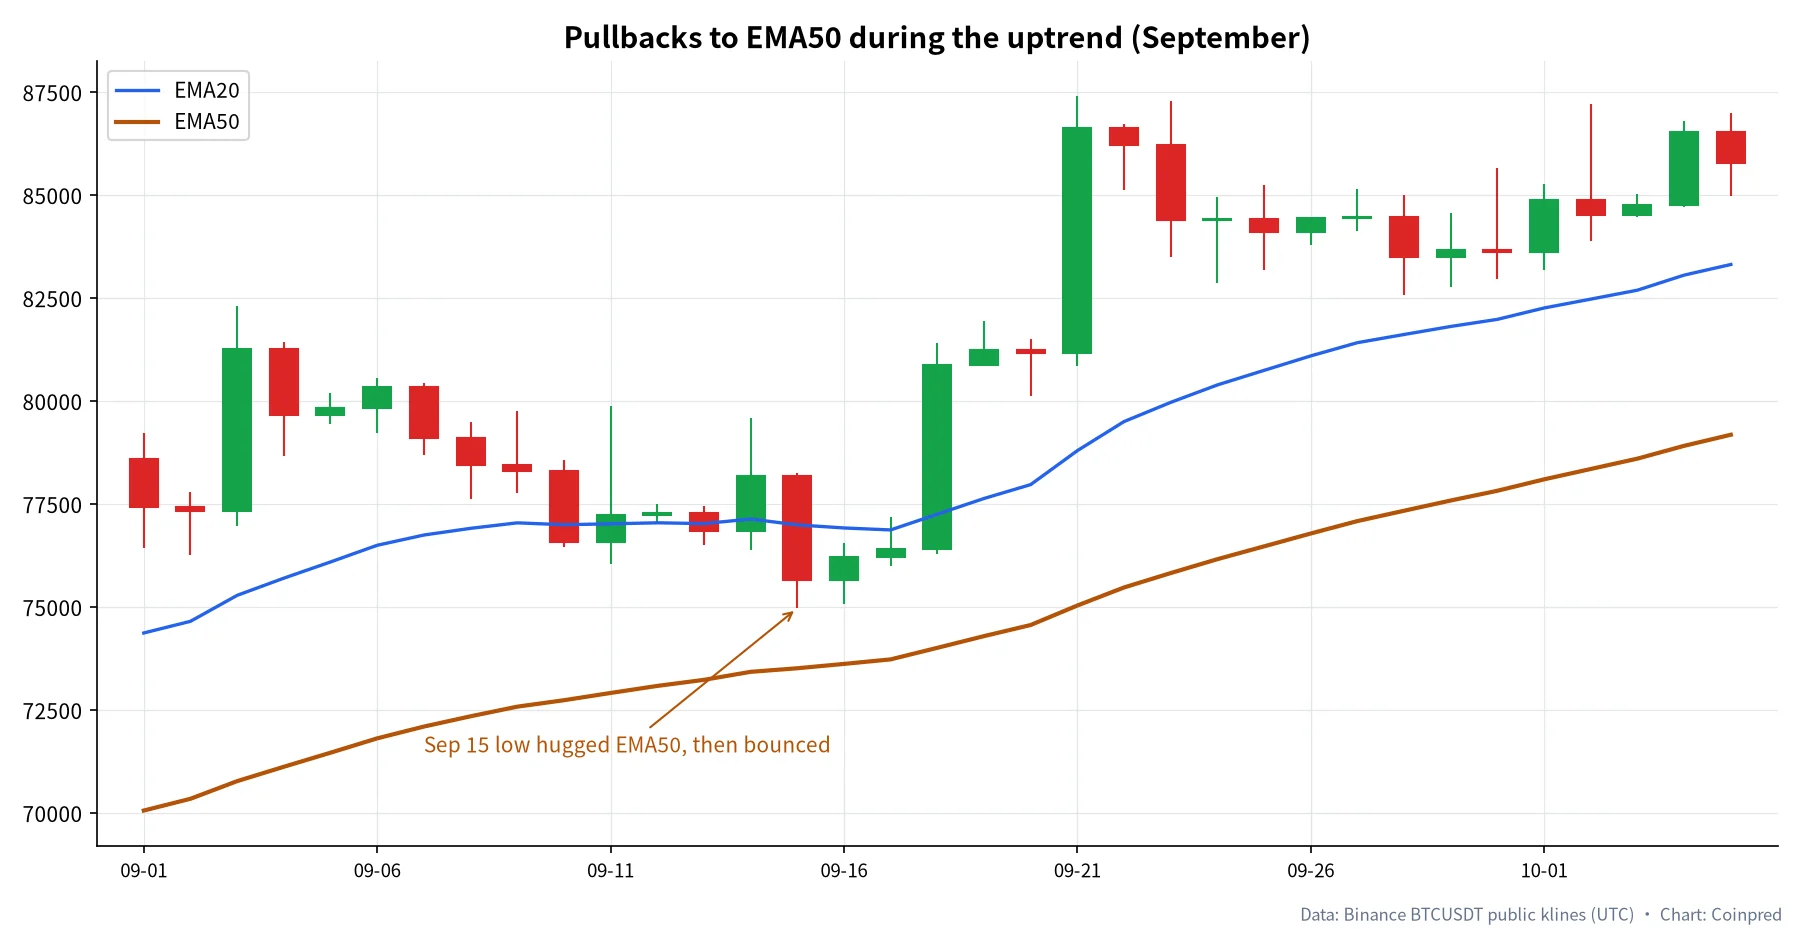
On 2026-09-15 the daily low was about 74,968 with a close near 75,644, while EMA50 was still grinding higher. Price tagged near that orange line, then lifted over the following sessions. Why that retest was readable:
- The broader stack was still bullish (short MA above long MA).
- The pullback contracted; there was no decisive close deep under the average that never recovered.
- Ideally you also stack location: does the MA retest overlap a support zone you already drew?
If price instead closes hard under the average and you still call it a “retest,” that is wishful labeling — next section.
5. Losing the average: late-October closes under EMA50
Trends end. Late October:
| Date (UTC) | Close | EMA20 | EMA50 | Close vs EMA50 |
|---|---|---|---|---|
| Oct 25 | 80,154.09 | 82,130 | 80,832 | below (after whipsaws) |
| Oct 27 | 80,909.77 | 81,843 | 80,809 | back above |
| Oct 29 | 77,991.89 | 81,433 | 80,719 | clearly below |
| Oct 30 | 77,368.77 | 81,046 | 80,588 | still below |
| Oct 31 | 77,336.01 | 80,693 | 80,460 | still below |
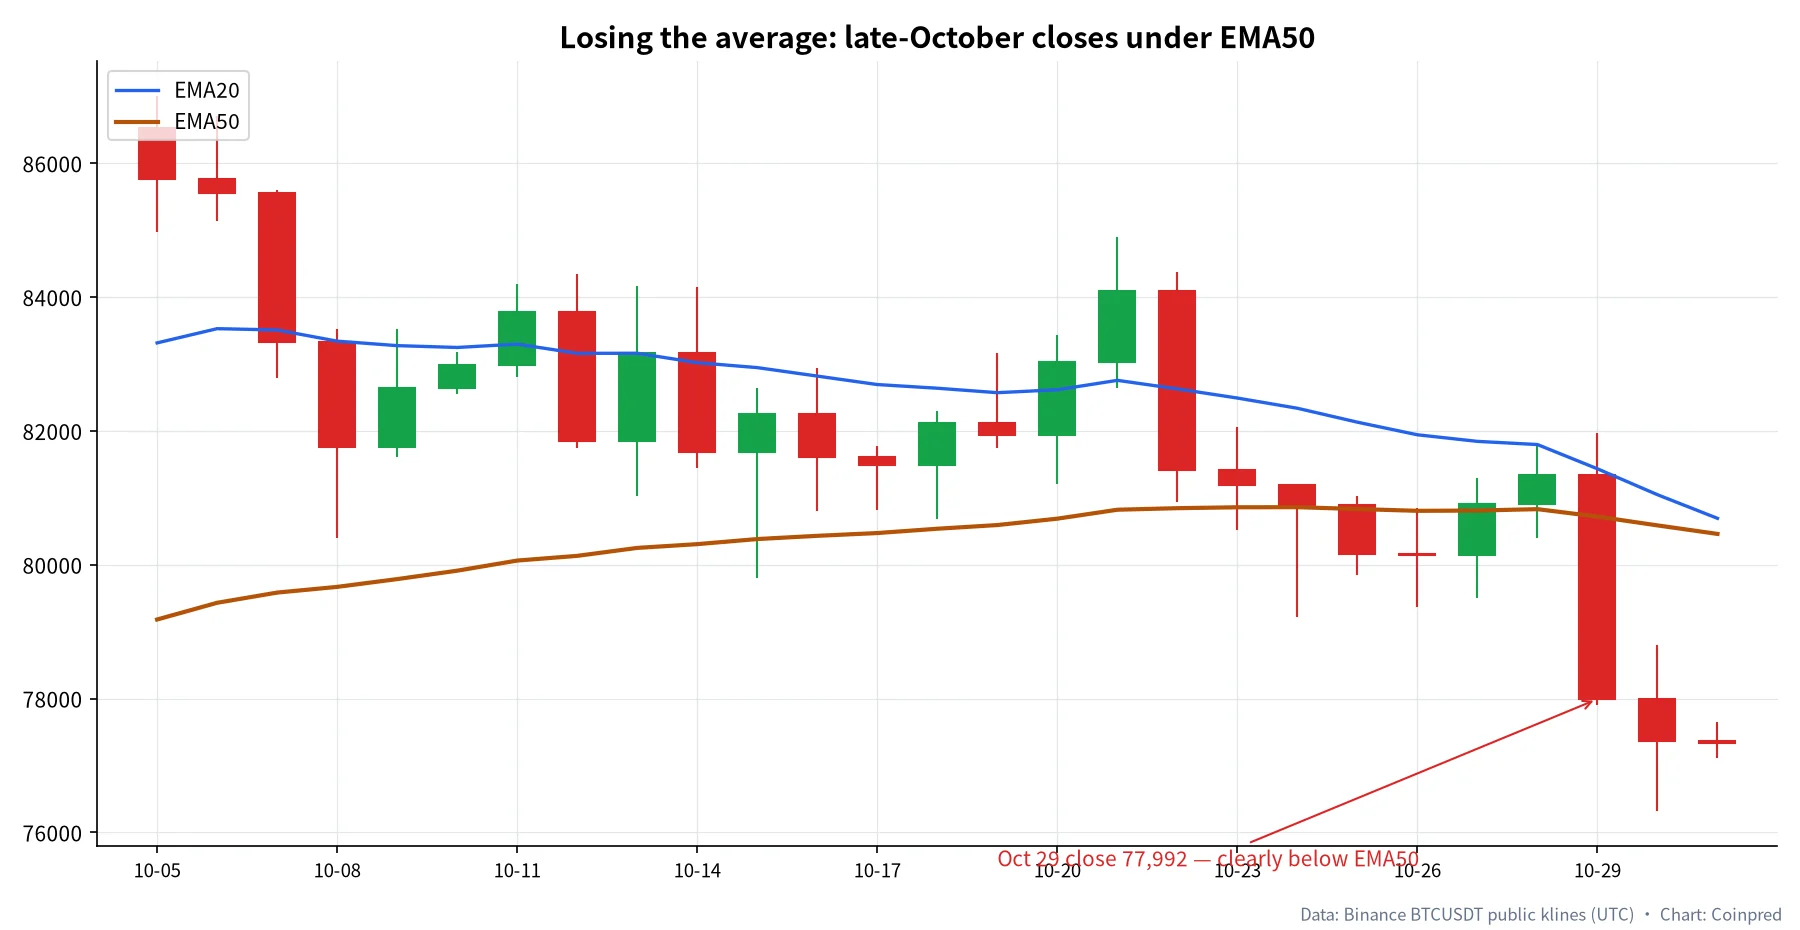
October 25 already closed under EMA50 and October 27 reclaimed it; the damaging bar was October 29, closing near 77,992 — roughly three thousand under EMA50. Our blunt rules:
- Wick through an MA: watch, do not declare failure yet.
- Close back above: treat it as a probe.
- Close well below, then fail to reclaim for several days: flip the MA’s role from “potential support” to “overhead resistance.”
That lines up with the RSI piece: after October 29, momentum cooled hard. Two tools pointing at the same fact beat either alone.
6. Bullish stack: short above long
When EMA20 > EMA50 > EMA200 and the lines slope up, you get a clean bullish ribbon. Late August into mid-September looked like that:
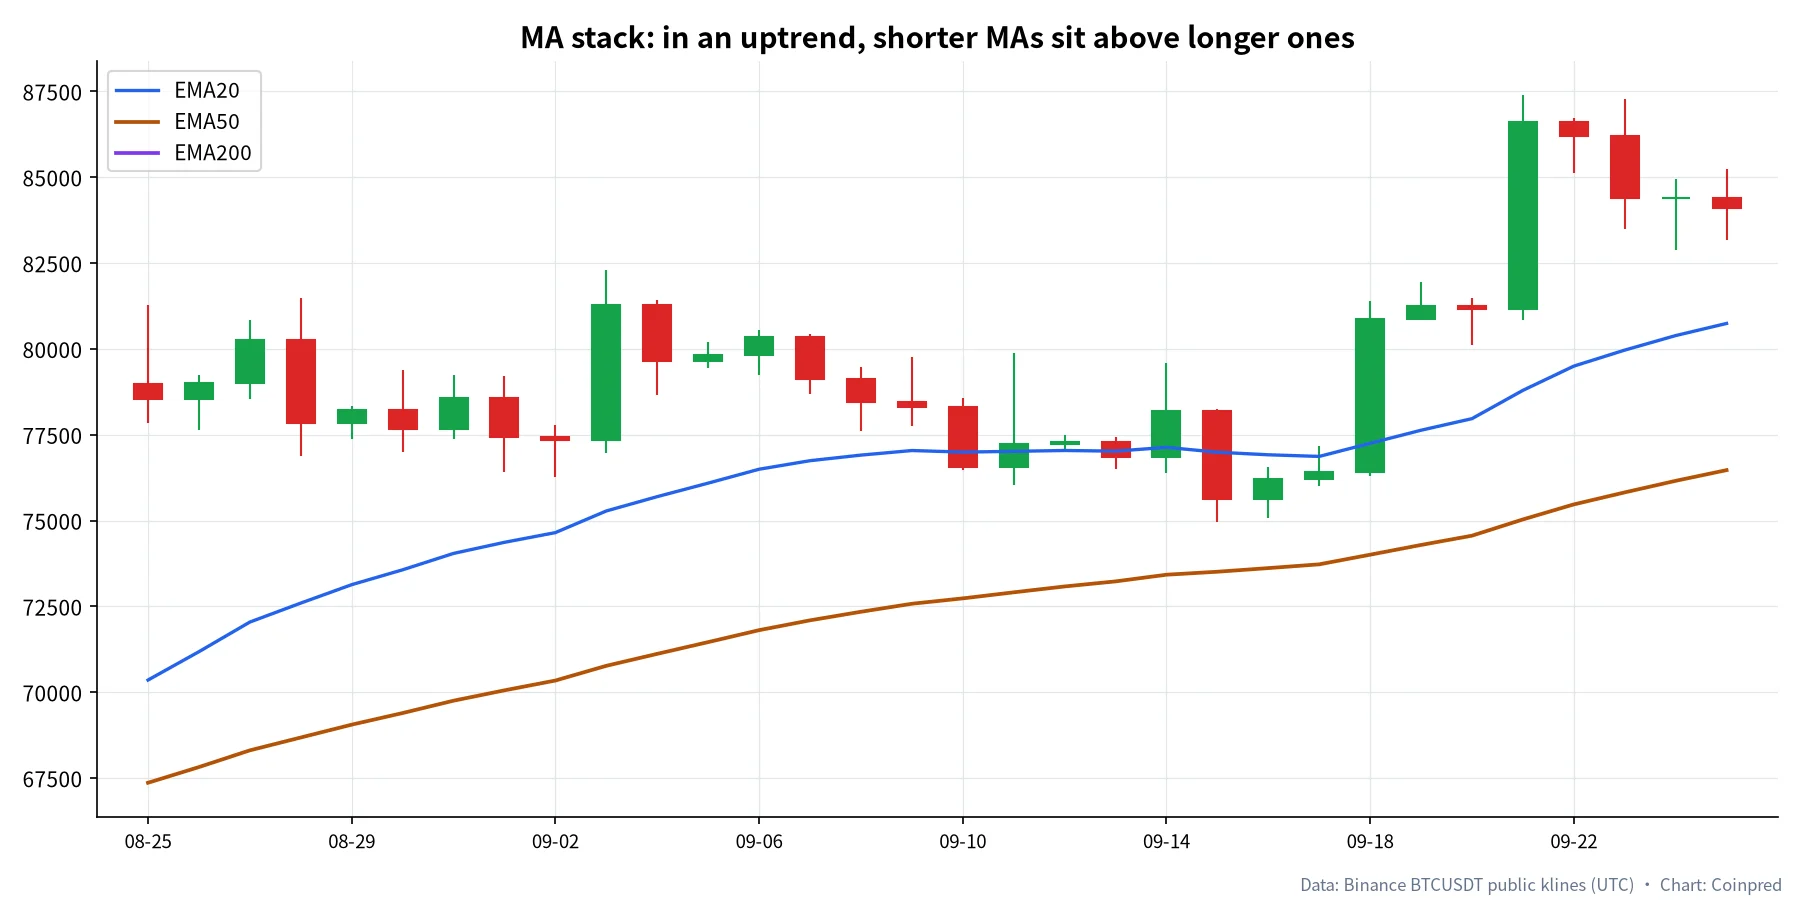
One side statistic: in the ~90 trading days before writing, closes sat above that day’s EMA50 on about 74 / 90 days. That describes a bullish backdrop after the August breakout — it does not guarantee day 91. By late October price was already under the average.
A bearish stack is the mirror. Tangled, flat averages usually mean a range; crossover signals are dirtiest there, so we trade less and lean on range highs/lows instead.
7. Same length: SMA20 slower, EMA20 closer
Overlay SMA20 and EMA20 on the recent daily stretch:
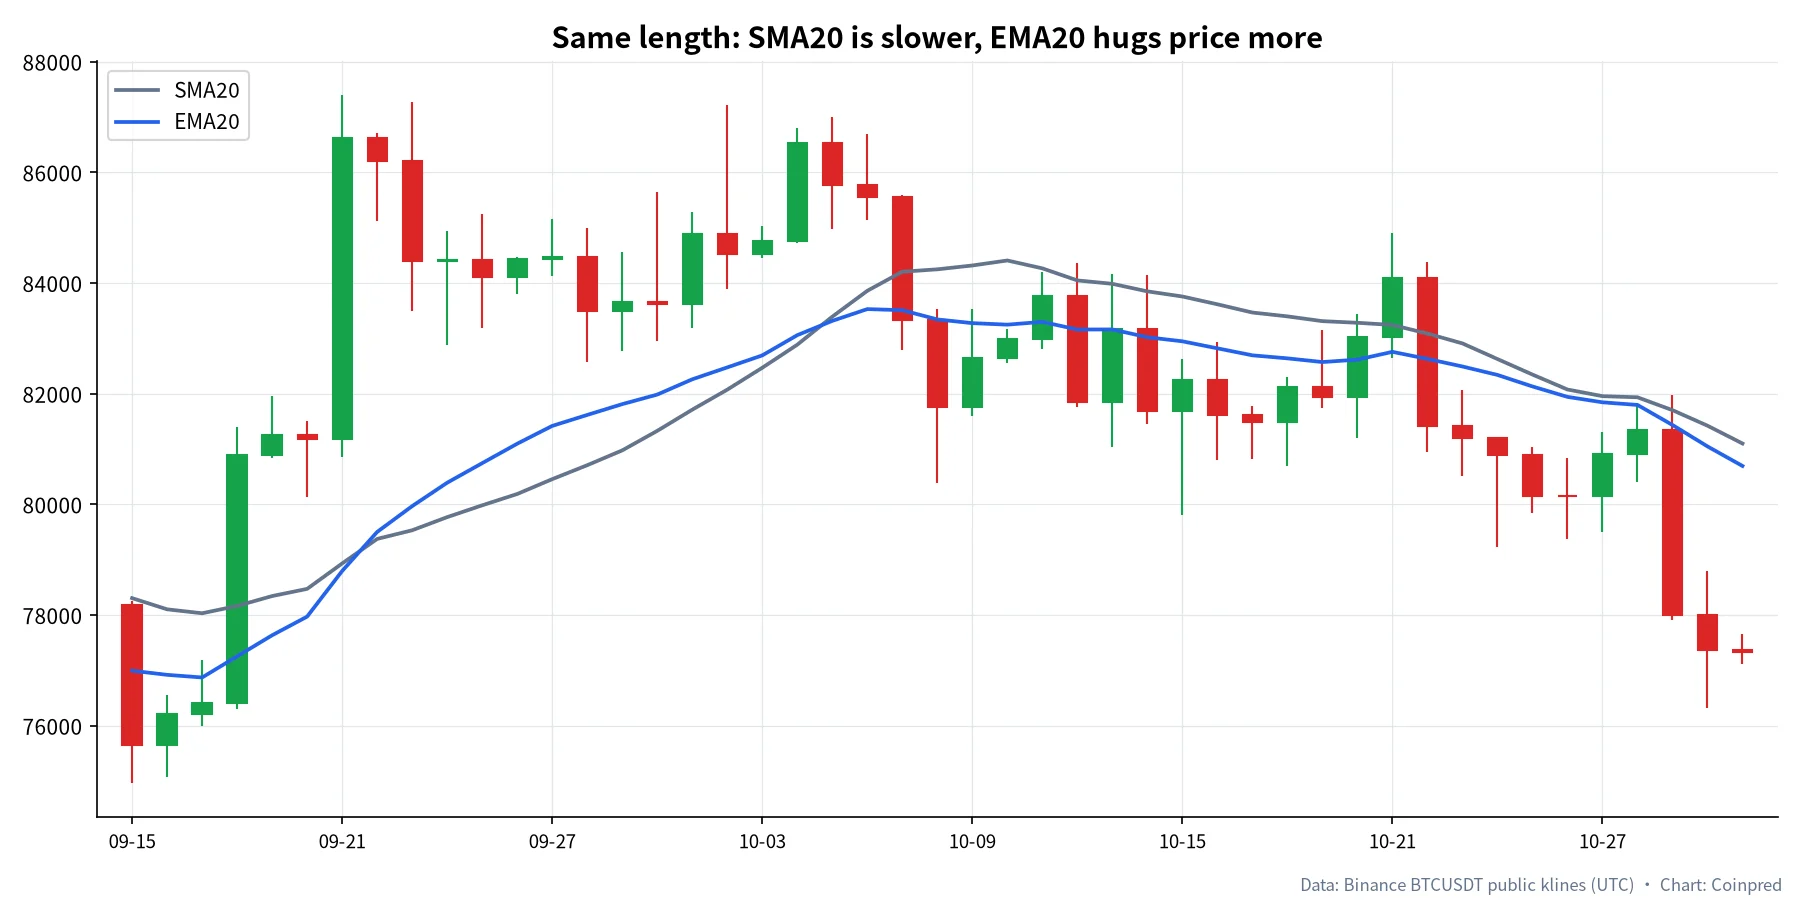
At writing time SMA20 was about 81,099 and EMA20 about 80,693 — roughly a 0.5% gap. In a decline the EMA ducks sooner; the SMA drags a longer tail. If stops or sizing rules are tied to an MA, changing the formula quietly changes your risk, so know what you are swapping.
8. What a fake crossover looks like
Golden/death crosses earn their bad reputation in chop. Schematic:
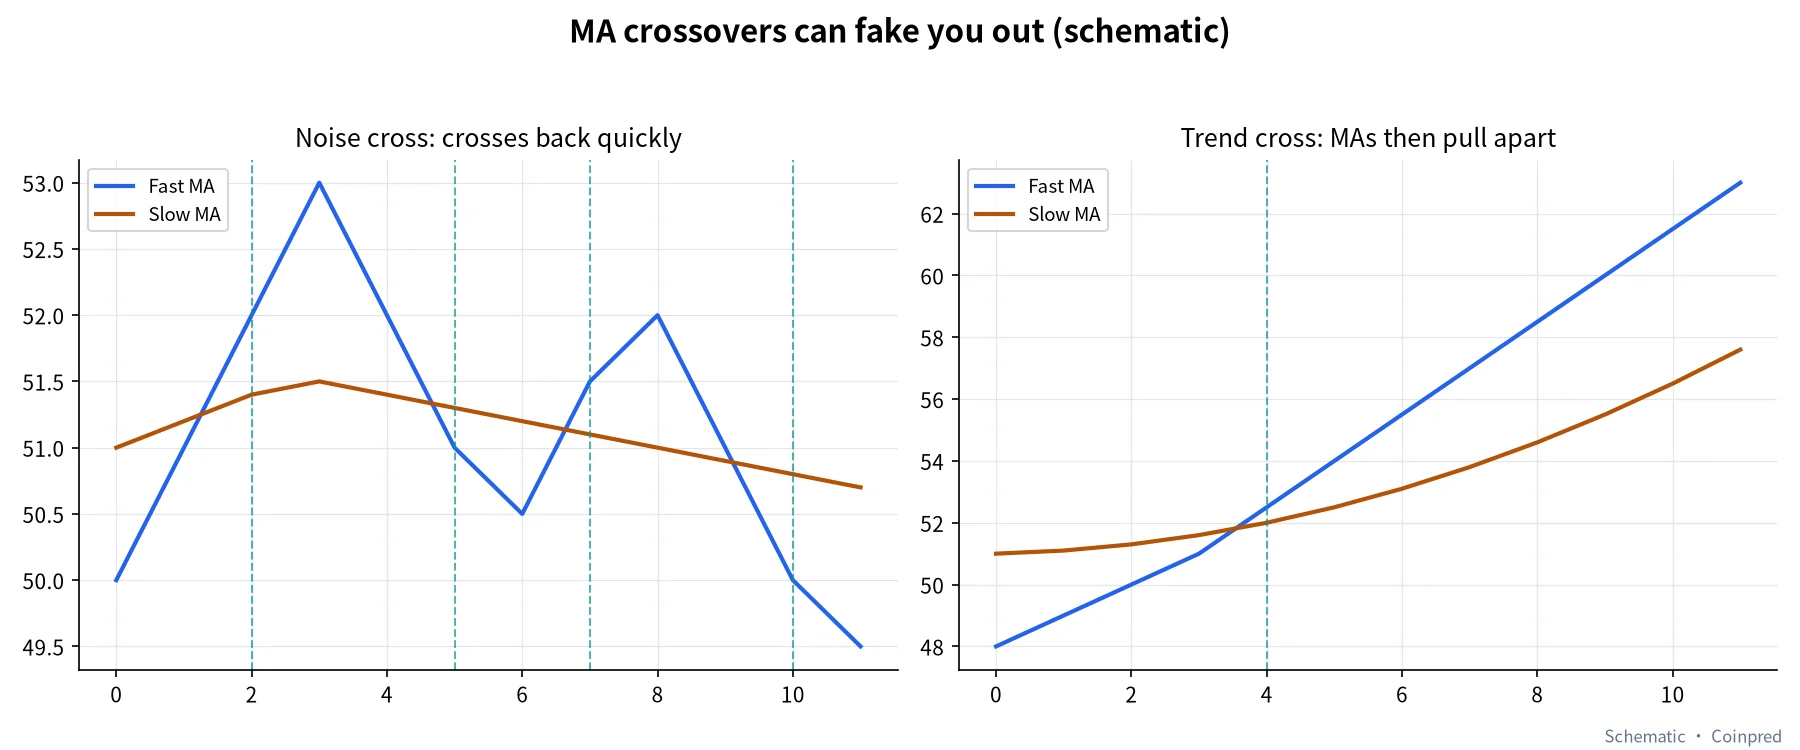
| Check | Looks like noise | Looks like trend |
|---|---|---|
| Distance after the cross | Lines re-entangle quickly | Averages keep pulling apart |
| Price structure | Still inside the old range | Range break or clear volume |
| Slope | Both lines nearly flat | Short MA steepens |
| Timeframe | Only on a low timeframe | Confirmed on the daily |
Our filter: demand a daily cross + price on the right side of a key zone + no instant reverse cross over the next 3–5 bars. Slower, fewer whipsaws.
9. A five-step moving-average habit
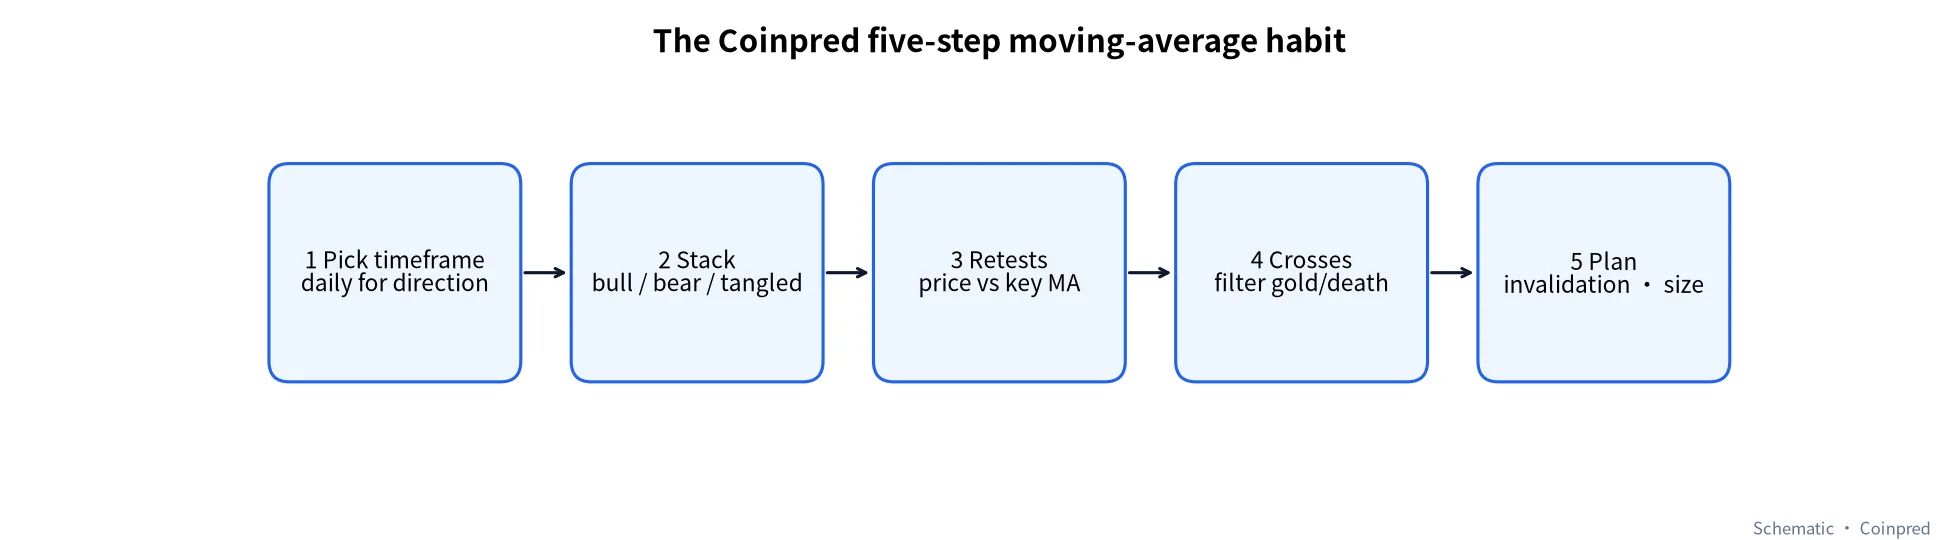
- Pick the timeframe: direction on daily (or weekly); execution on 4h/1h.
- Read the stack: bullish, bearish, or tangled?
- Watch retests: when price tags EMA20/50, does it hold or close through?
- Treat crosses carefully: always stack structure and volume; a naked cross is low weight.
- Write the plan: after a role flip, is old support now resistance? Where is invalidation?
If you make short-horizon direction calls on Coinpred, the MA stack is a useful filter for “is the backdrop even worth an active lean?” Contract mechanics are in BTC event contracts and how to use the platform.
10. Beginner pitfalls
- Too many averages — six lines is chart fog.
- Full size on every golden cross — ignoring structure and location.
- Treating an MA as unbreakable support — October 29 already demonstrated failure.
- Letting a low-timeframe death cross boss a healthy daily stack — mismatched horizons.
- SMA today, EMA tomorrow — backtest and live rules no longer match.
FAQ
Which moving averages should I use?
No universal answer. Crypto dailies often use EMA20/50/200; equities love 50/200. Lock one set for three months before you shop for new numbers.
Is a golden cross a buy signal?
At best it is one candidate confirmation of trend. The August 20 cross mattered because it lined up with a range break, volume, and a strong RSI regime. Alone, in a range, it is weak.
If price breaks an MA, should I flatten immediately?
Depends how you define “break.” We weight the close and whether price stays away or reclaims. Wick pierces are often noise.
What does losing EMA200 mean?
A sustained break of a long average usually means the center of price has shifted down, so many playbooks cut long exposure or treat rallies as fades. “Sustained” needs time: one spike and reclaim is not the same as many closes underneath.
If an MA and a support zone disagree, which wins?
Static zones (prior highs/lows, round numbers) and dynamic averages can stack: when they overlap, give the area more weight. When they conflict, favor the cleaner, more-tested side and shrink size.
Can I build a quant strategy on MAs?
Yes — with trend filters, costs and invalidation baked in. Plain dual-MA crosses can work in trends and bleed for years in ranges. Everything here is educational — not investment advice.
How do 4-hour and daily MAs work together?
Daily sets direction and the key average; 4-hour times the retest or break. Do not let one 4-hour death cross veto a still-intact daily bullish stack.
Data and references
- Candle data: Binance public API at data-api.binance.vision, BTCUSDT daily; EMA/SMA from closes; main window 2026-07-01 to 2026-10-31 (UTC), with cross and retest dates called out in the text.
- Binance Academy: Moving Averages Explained
- Investopedia: Moving Average (MA)
- Investopedia: Golden Cross / Death Cross
Charts drawn by Coinpred from public data. Markets are risky — decide and size for yourself.