In earlier tutorials we covered candlesticks, support and resistance, RSI and moving averages. The natural next question is: “Is there one tool that speaks to both trend direction and whether momentum is strengthening or fading?” In technical analysis, the usual answer is MACD.
Reset the expectation first: MACD is not an auto-buy on a golden cross or auto-sell on a death cross. It is a dashboard for the distance between two exponential moving averages. In our own reviews we look at the zero line first, then whether the histogram is expanding or shrinking, and only then at the cross — the cross is often the result, not the cause.
Every figure below comes from Binance’s public BTCUSDT daily candles (UTC). We use the common 12, 26, 9 settings: DIF = EMA12 − EMA26, DEA = EMA9 of DIF, histogram = DIF − DEA. You can download the same candles and recompute.
1. The three pieces of MACD
Strip the jargon:
- DIF (fast line): short EMA minus long EMA. Above the zero line means the short EMA is already above the long EMA; below means the opposite.
- DEA (slow line): a smoothed version of DIF, slower on purpose, used to filter noise.
- Histogram: DIF minus DEA. When the bar flips from negative to positive, that is the golden cross; the reverse is the death cross. Growing bars mean the lines are pulling apart; shrinking bars mean momentum is converging.
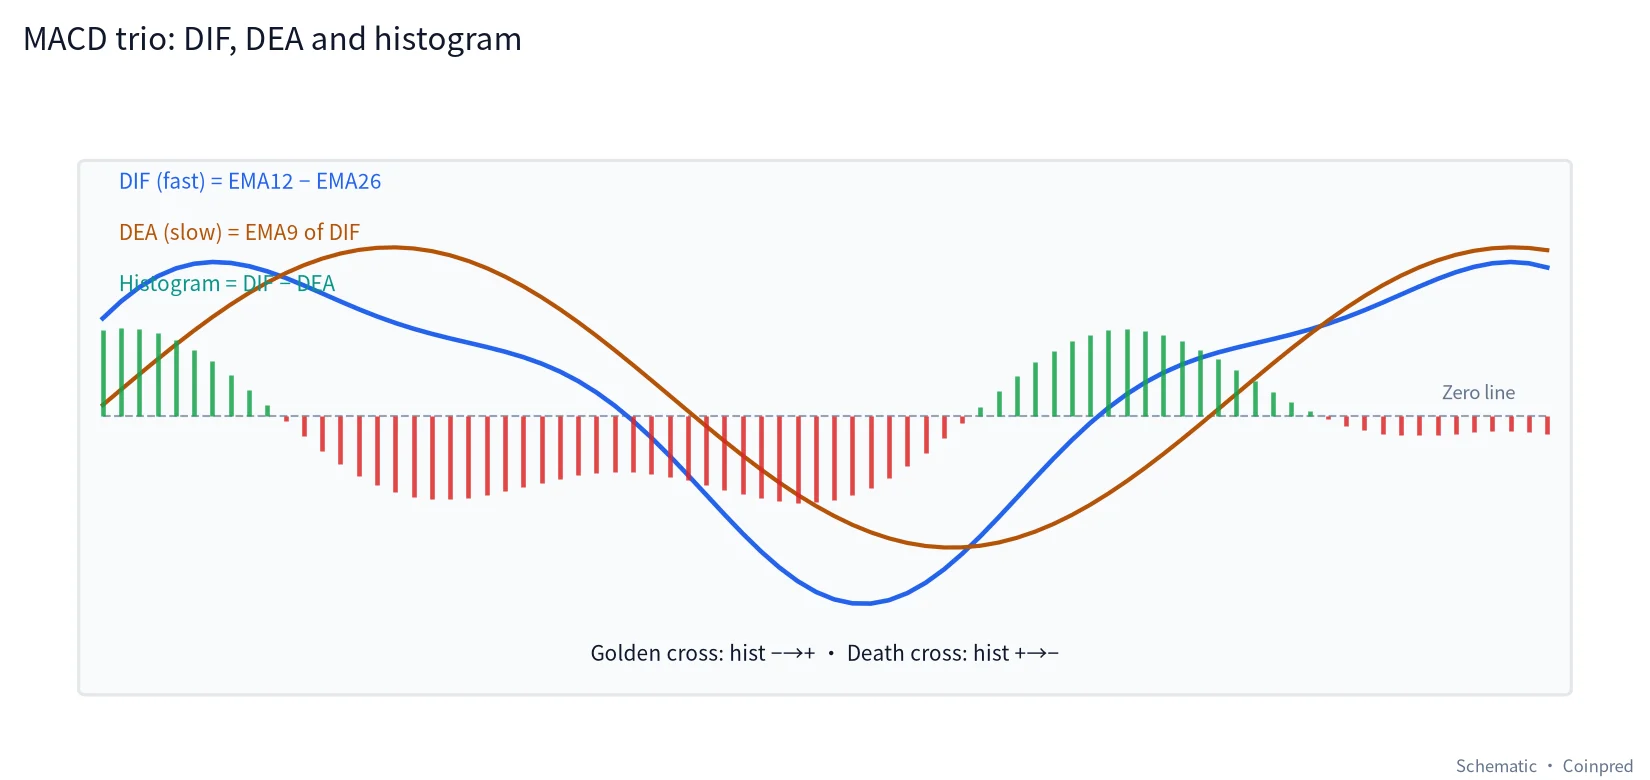
The diagram is a schematic. In live markets all three wiggle together, so a single golden cross is nowhere near enough to act on. It also pairs naturally with our moving-average guide — MACD is literally a visualization of the EMA gap.
2. The big picture: BTC MACD from July to October
Here are daily BTC candles from July 1 to October 31, 2026, with MACD underneath:
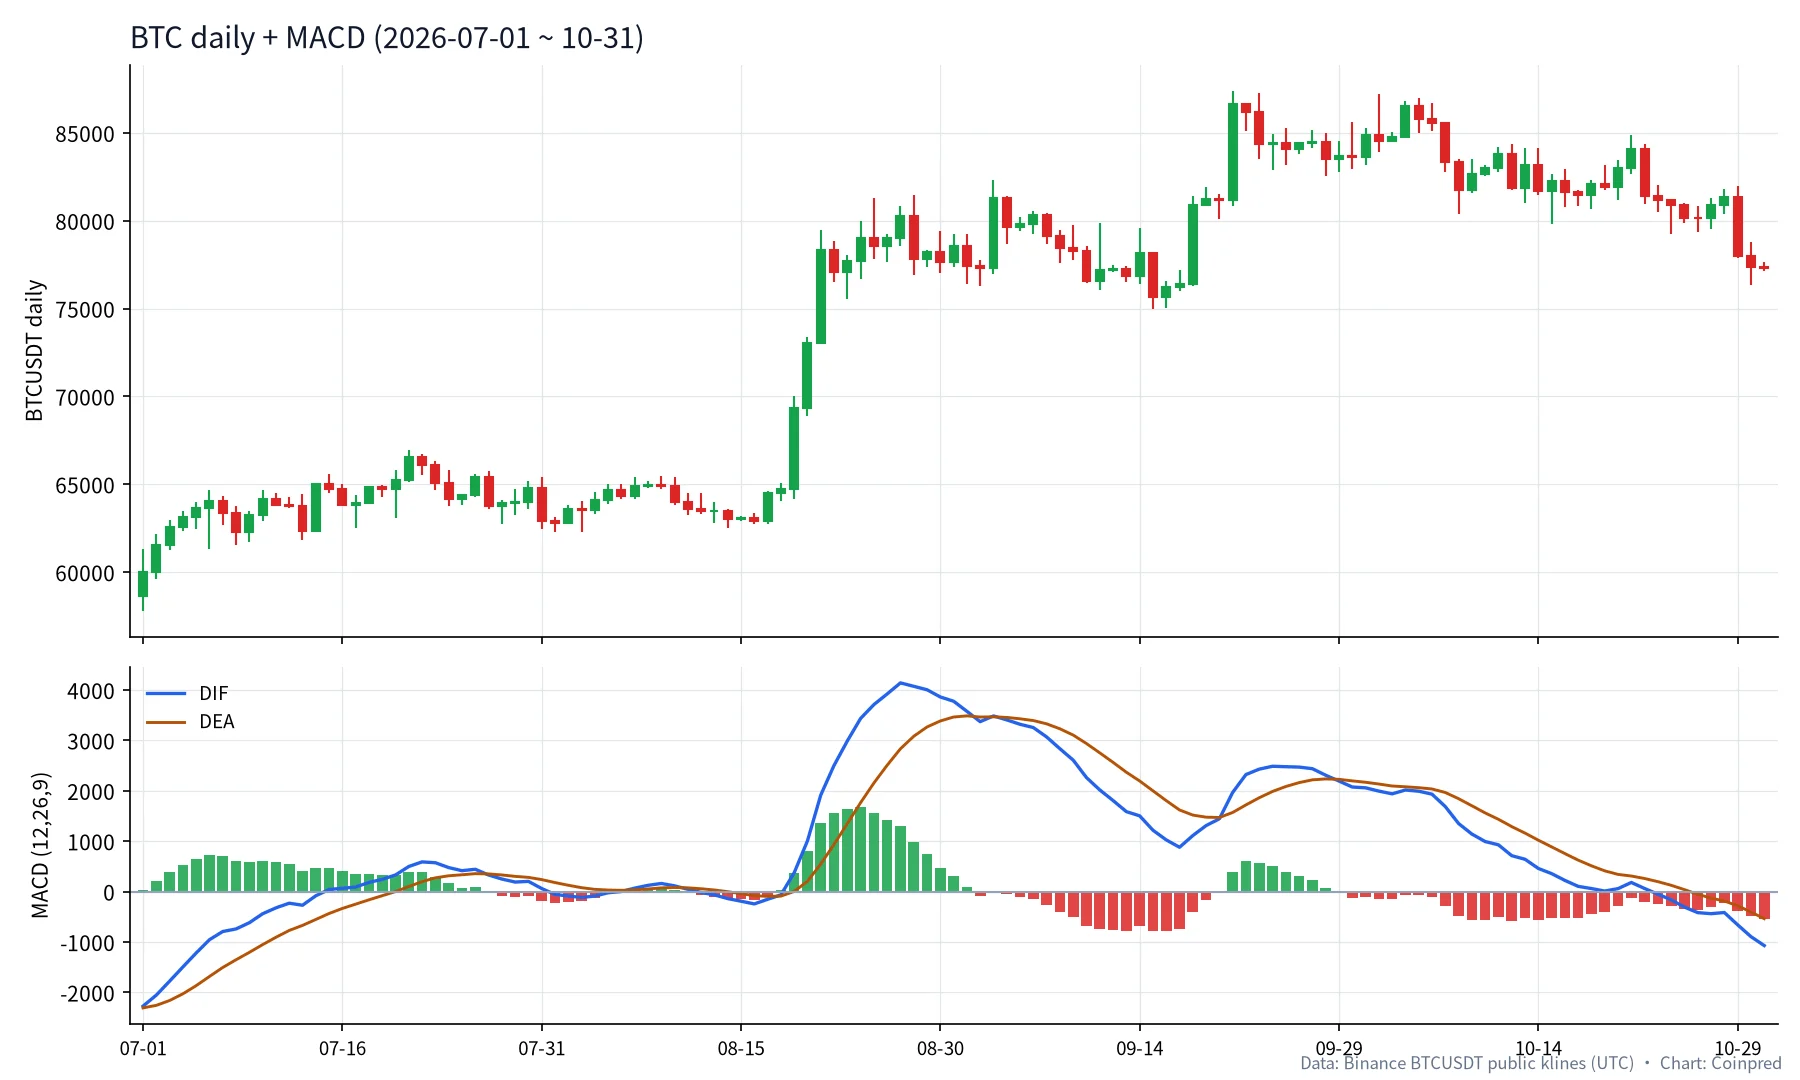
Three different moods jump out:
- Early July to mid-August: price chopped roughly 61,000–67,000; MACD flipped around the zero line with noisy crosses.
- Late August: after a golden cross, DIF punched through zero and the histogram stretched hard — momentum ignition.
- September–October: price still printed higher highs, but DIF highs stepped down; by late October DIF was back below zero with a deepening negative histogram.
The next sections unpack each mood.
3. A golden cross is cheap; an expanding histogram is not
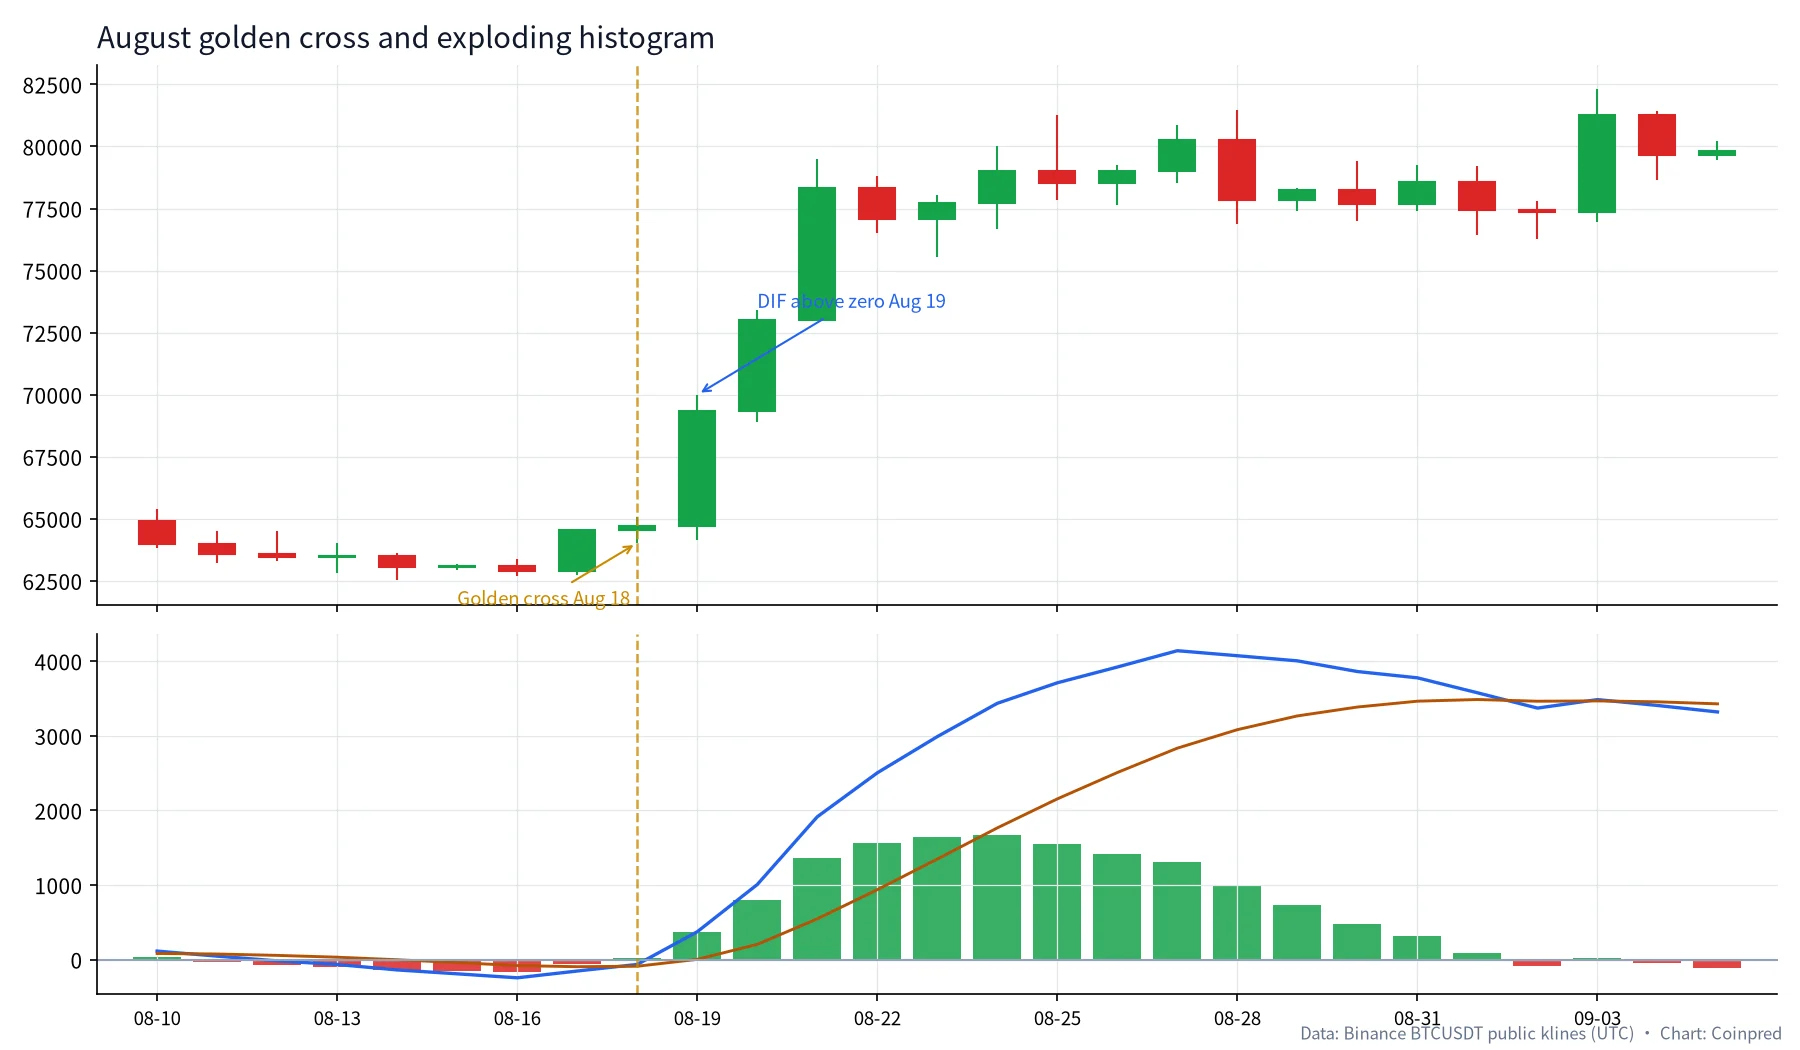
The classic beginner trap is reading “golden cross” as “time to buy.” Look at the stretch around August 18:
| Date (UTC) | Close (USDT) | DIF | DEA | Histogram |
|---|---|---|---|---|
| Aug 18 | 64,725.42 | -64.68 | -89.06 | +24.38 |
| Aug 19 | 69,334.79 | 373.09 | 3.37 | +369.71 |
| Aug 20 | 73,025.15 | 1,006.20 | 203.94 | +802.26 |
| Aug 21 | 78,338.03 | 1,914.58 | 546.06 | +1,368.51 |
| Aug 22 | 77,074.93 | 2,503.69 | 937.59 | +1,566.10 |
August 18 flipped the histogram positive (golden cross), but DIF was still below zero (about -65). What actually changed the tape was the follow-through:
- August 19: DIF crossed above zero; close near 69,335.
- August 21: histogram near 1,369; close near 78,338.
- That same stretch is the volume breakout of the July–August range we already documented.
How we read it:
- A golden cross below the zero line is often just a bounce attempt inside a downswing — wait to see whether DIF can reclaim zero and whether the histogram keeps expanding.
- Expanding histogram + price breaking a key zone is more useful than a naked cross.
- If the histogram shrinks right after the cross and price fails to leave the structure, it is usually range noise — July through mid-August printed plenty of those “fake crosses.”
4. The zero line: which side owns the momentum
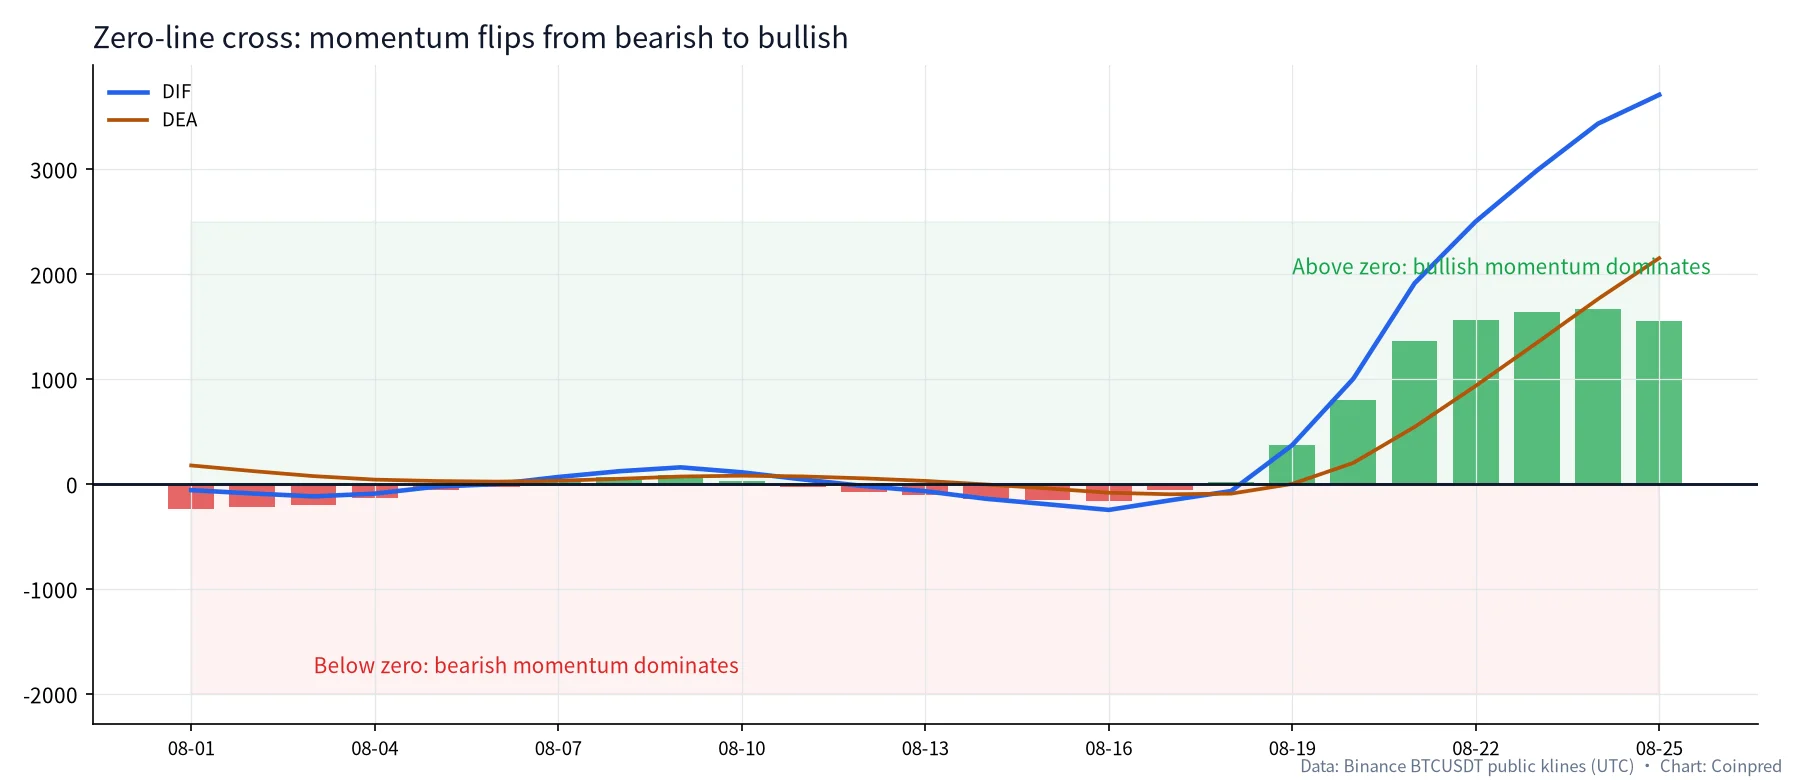
Many tutorials obsess over crosses and shrug at the zero line. For us, the zero line is the most under-used line on the MACD pane.
Plain English:
- DIF above zero: short EMA above long EMA — bullish momentum dominates.
- DIF below zero: short EMA below long EMA — bearish momentum dominates.
August makes it concrete: on August 12 DIF was still slightly negative (about -17); on August 19 it jumped to about +373. It did not fall back below zero until October 23 (about -51). Through the months in between, even the brief early-September death crosses left DIF mostly above zero — which matched price still working above the old breakout zone.
Practical note: zero-line crosses are usually later and duller than golden/death crosses, but they also get chopped less. We treat “DIF above/below zero” as a trend filter, not a standalone entry reason.
5. Bearish divergence: higher price high, lower DIF high
Divergence is the most mythologized — and most misused — MACD idea. Real numbers first:
| High | Date (UTC) | Session high | DIF that day | Histogram |
|---|---|---|---|---|
| High 1 | Aug 28 | 81,478.87 | ≈4,073.83 | ≈991 |
| High 2 | Sep 21 | 87,395.67 | ≈1,968.27 | ≈398 |
Price highs rose from about 81,479 to about 87,396 (higher); DIF highs fell from about 4,074 to about 1,968 (lower). That is a textbook bearish divergence.
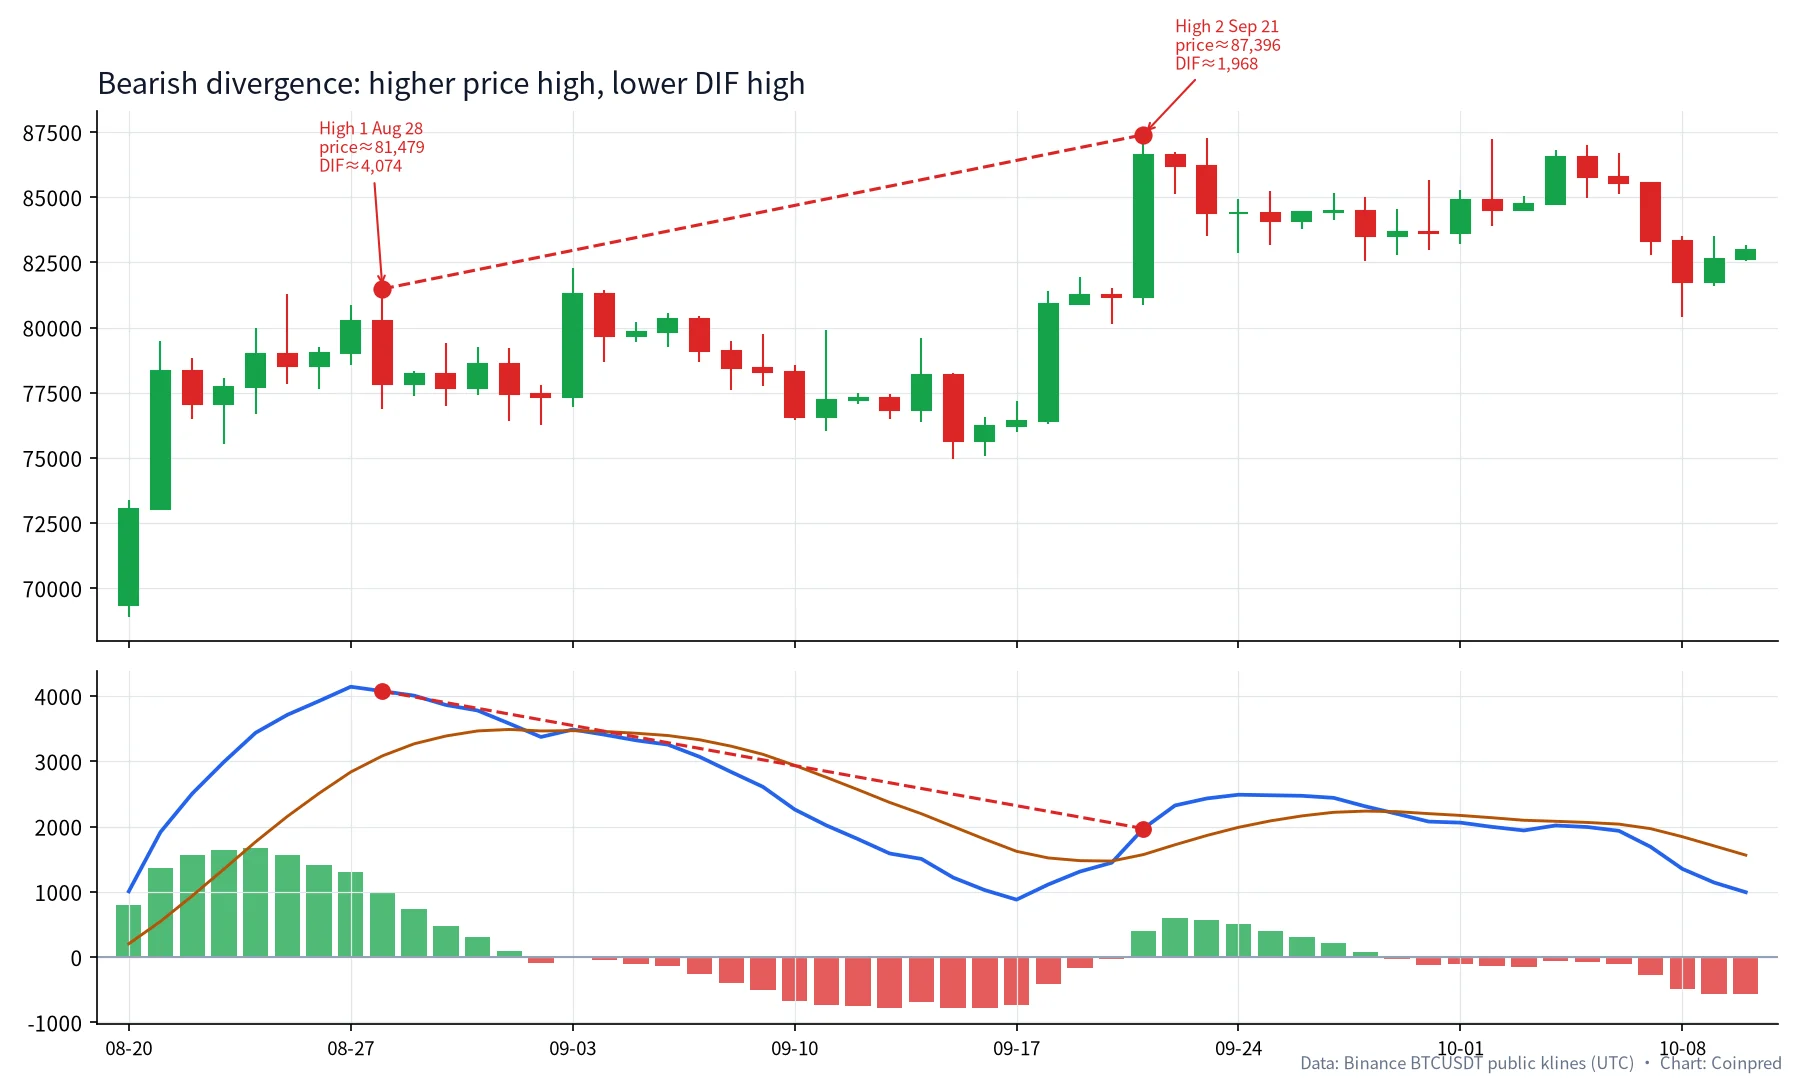
How to read it without stepping on a rake:
- Divergence says upside momentum is fading, not “it must dump tomorrow.” After September 21, BTC still tagged about 87,220 on October 2.
- We care more about whether price then loses a key support zone, and whether DIF starts a clear downshift.
- You can cross-check with RSI divergence, but two indicators diverging still is not an auto short — timeframe, location and candle confirmation all matter.
6. October: death cross, then the zero line gives way
Zoom to late September through end of October:
| Date (UTC) | Close (USDT) | DIF | DEA | Histogram | Note |
|---|---|---|---|---|---|
| Sep 29 | 83,663.66 | 2,193.85 | 2,227.64 | -33.79 | Death cross (hist flips −) |
| Oct 15 | 82,245.93 | 357.22 | 887.85 | -530.63 | Histogram stays negative |
| Oct 23 | 81,189.43 | -51.31 | — | — | DIF below zero |
| Oct 29 | 77,991.89 | -659.01 | -281.04 | -377.97 | Sharp down day |
| Oct 31 | 77,299.75 | -1,071.03 | -536.90 | -534.14 | Histogram still deepening |
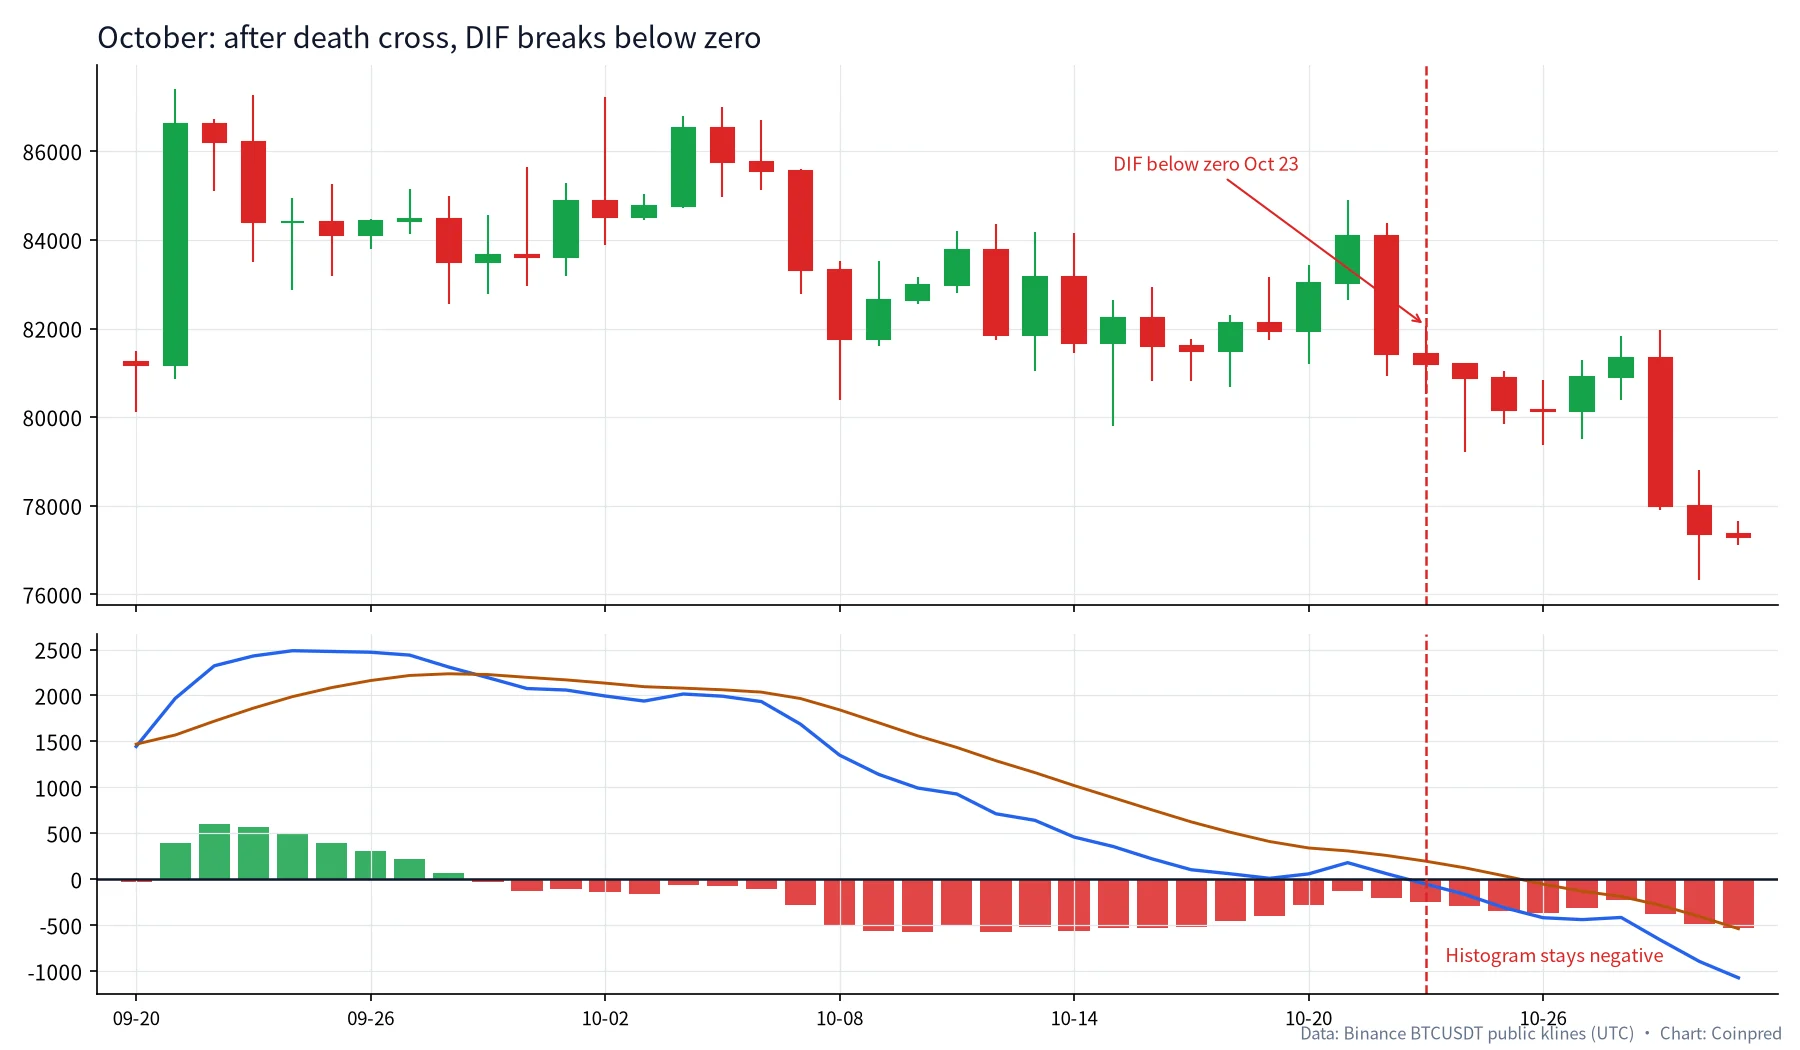
Our reading order for this stretch:
- When the September 29 death cross printed, DIF was still about 2,194 above zero — more “momentum cooling at altitude” than a full trend flip.
- October 23’s break of the zero line is when bearish momentum started to own the EMA structure.
- After the October 29 drop, the histogram deepened to about -378, then about -534 by October 31. That describes a downswing still accelerating, not a buy button.
If you execute on shorter clocks, daily MACD direction is still a useful filter. Platform mechanics are covered in our BTC event-contract note and how-to-use guide; that is the execution layer — get the daily momentum read right first.
7. How to read the histogram: expand, shrink, flip
Isolating the histogram, there are really three jobs:
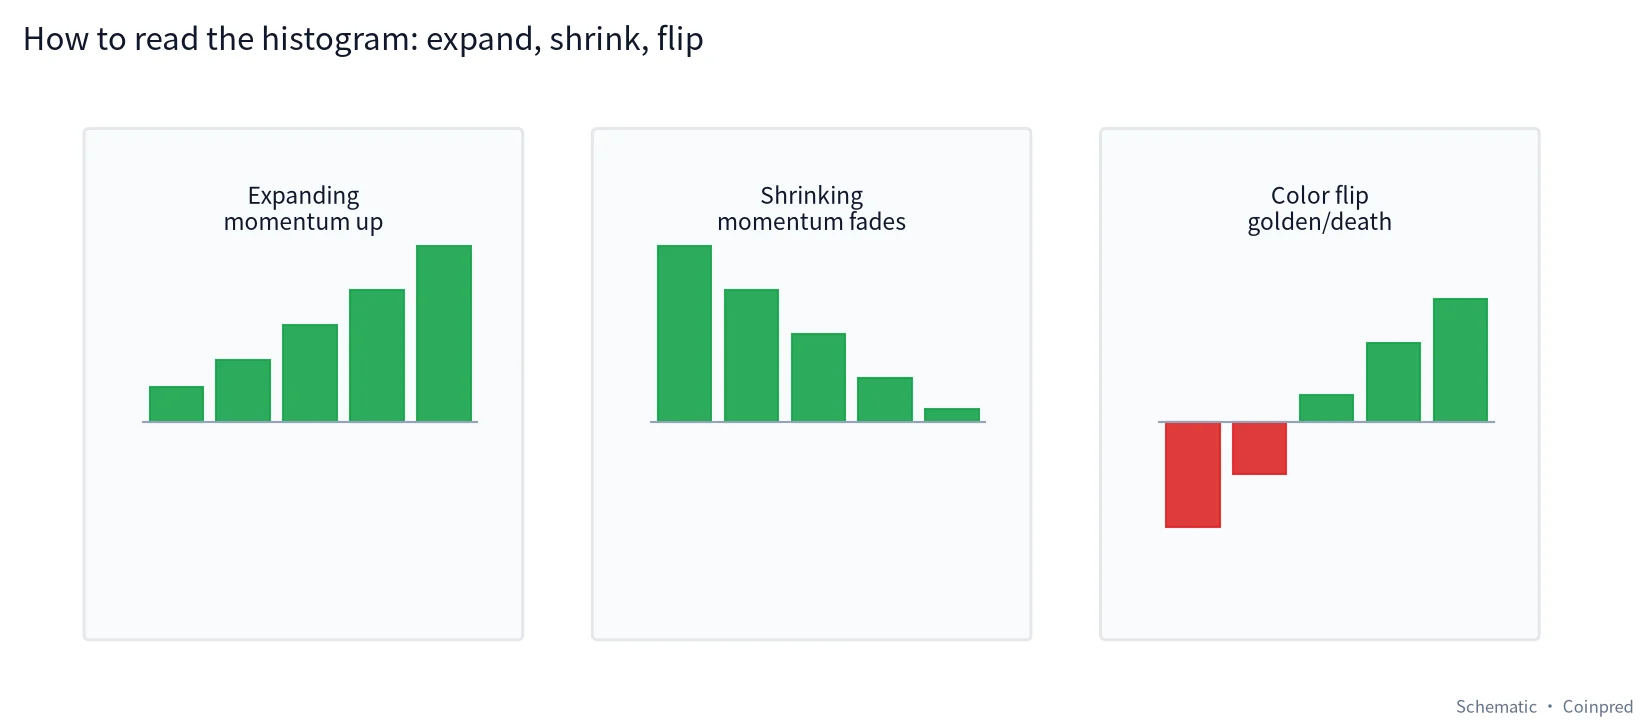
| Pattern | Meaning | Common misread |
|---|---|---|
| Expanding (larger absolute bars) | Momentum strengthening | “It must double from here” |
| Shrinking | Momentum fading | “Instant reversal” |
| Color flip (+↔−) | Golden/death cross | “The only trade signal” |
August 18–22 is a clean expansion; early September’s quick flips are classic range noise. We prefer to ask “is the histogram expanding or shrinking, and did price structure move with it?” rather than “was today a golden cross?”
8. A five-step MACD reading habit
Compress it into something you can run daily:
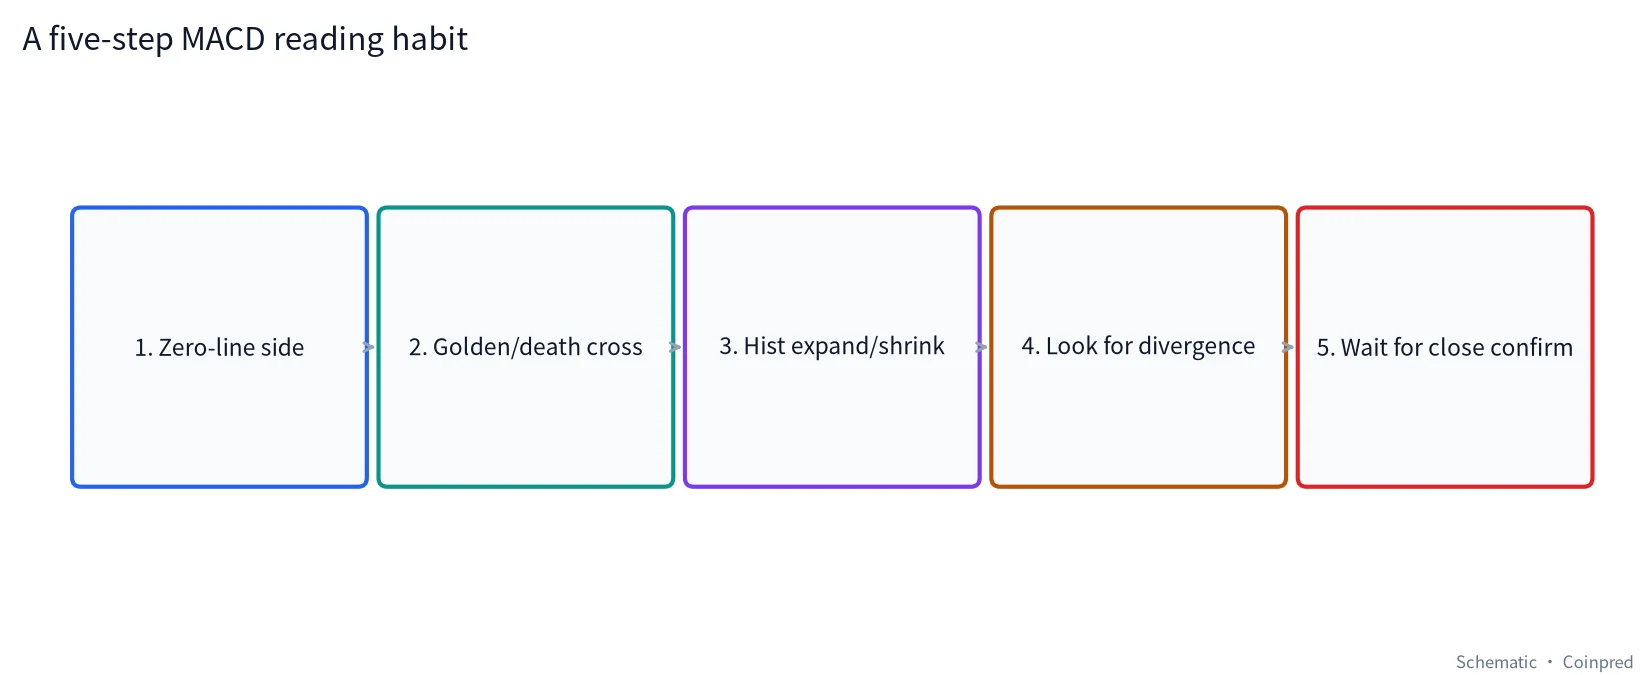
- Zero-line side: is DIF above or below? That is the big-picture filter.
- Golden/death cross: did a cross fire, and on which side of zero?
- Histogram expand/shrink: after the cross, is momentum strengthening or decaying?
- Divergence: do price swings and DIF swings still agree?
- Wait for the close: use the daily close, check nearby support/resistance, write down what would invalidate the read.
9. Beginner traps
- Treating every cross as a trade signal — ranges will whipsaw you.
- Ignoring the zero line — a golden cross below zero is not the same animal as one above.
- Shorting the moment divergence appears — divergence can last, or get resolved by a new high.
- Forcing a 5-minute MACD conclusion onto the daily chart — mismatched clocks.
- Tweaking 12/26/9 after every article until it “fits” history — fix a rule set and review it.
FAQ
Who invented MACD, and why 12 / 26 / 9?
Gerald Appel introduced it in the 1970s. 12/26/9 is the most common default — roughly two weeks and a month of trading days — not a law of physics. You may lock a different set, but do not change it every week.
Does a golden cross mean buy?
No. Especially below the zero line, with a histogram that shrinks immediately, July–mid-August printed those crosses repeatedly. We care more about what the histogram and price structure do afterward.
Is a zero-line cross more important than a golden cross?
For us, the zero-line cross is the trend filter; the golden cross is timing color. In August the golden cross (Aug 18) came a day before the zero-line cross (Aug 19), but the regime change was the zero-line break plus the volume breakout.
How soon after bearish divergence does price fall?
There is no fixed answer. Some divergences reverse quickly; others chop for weeks or print a new high that “cancels” the divergence. Use it to lower expectations for continuation, not as an order ticket.
How should MACD sit next to RSI and moving averages?
Moving averages sketch location and trend skeleton; RSI is the speed thermometer; MACD is the EMA-gap momentum gauge. When they disagree, we listen to higher-timeframe price structure first, not whichever indicator is loudest.
Can I automate MACD signals?
You can write rules, but add a trend filter (for example, only golden crosses above zero) and clear invalidation. Naked “buy golden / sell death” gets chopped in ranges. Every example here is for study and review only — not investment advice.
Why does my platform’s histogram look twice as tall?
Some softwares multiply (DIF − DEA) by 2 for display. Compare direction and relative size, not whether the absolute number matches a screenshot.
Data and references
- Candle data: Binance public API via data-api.binance.vision, BTCUSDT daily, window 2026-07-01 to 2026-10-31 (UTC); MACD(12,26,9) computed from closes.
- Binance Academy: MACD Explained
- Investopedia: MACD
- Appel, Gerald. Technical Analysis: Power Tools for Active Investors (MACD discussion)
All charts were drawn by Coinpred from the public data above. Trading involves risk; judge independently and size carefully. This article is educational only and is not investment advice.