In our last tutorial we covered how to draw support and resistance zones. The natural follow-up was: “When price reaches a zone, is there a number that tells me whether this side is overheated or washed out?” In technical analysis, the tool most often asked to answer that is the RSI (Relative Strength Index).
Cold water first: RSI is not a buy/sell switch. It does not auto-buy at 30 or auto-sell at 70. In our own reviews we treat it as a thermometer — it tells you how “hot” recent swings have been — then we read it together with candlesticks and support/resistance.
Every figure below comes from Binance’s public BTCUSDT daily candles (UTC). RSI uses the common Wilder smoothing with period 14. You can download the same candles and recompute.
1. What RSI actually measures
In plain language: RSI asks whether recent ups or recent downs have been stronger, then squeezes the answer into 0–100.
- Near 100: almost everything recent was up, and it was fast.
- Near 0: almost everything recent was down, and it was fast.
- Near 50: ups and downs roughly balance.
Traders conventionally call above 70 overbought and below 30 oversold, with 40–60 as a neutral band. Those thresholds are conventions, not laws of physics. Crypto is volatile, so some people prefer 80/20. We stick with 70/30 in this article so it matches most platforms’ defaults.
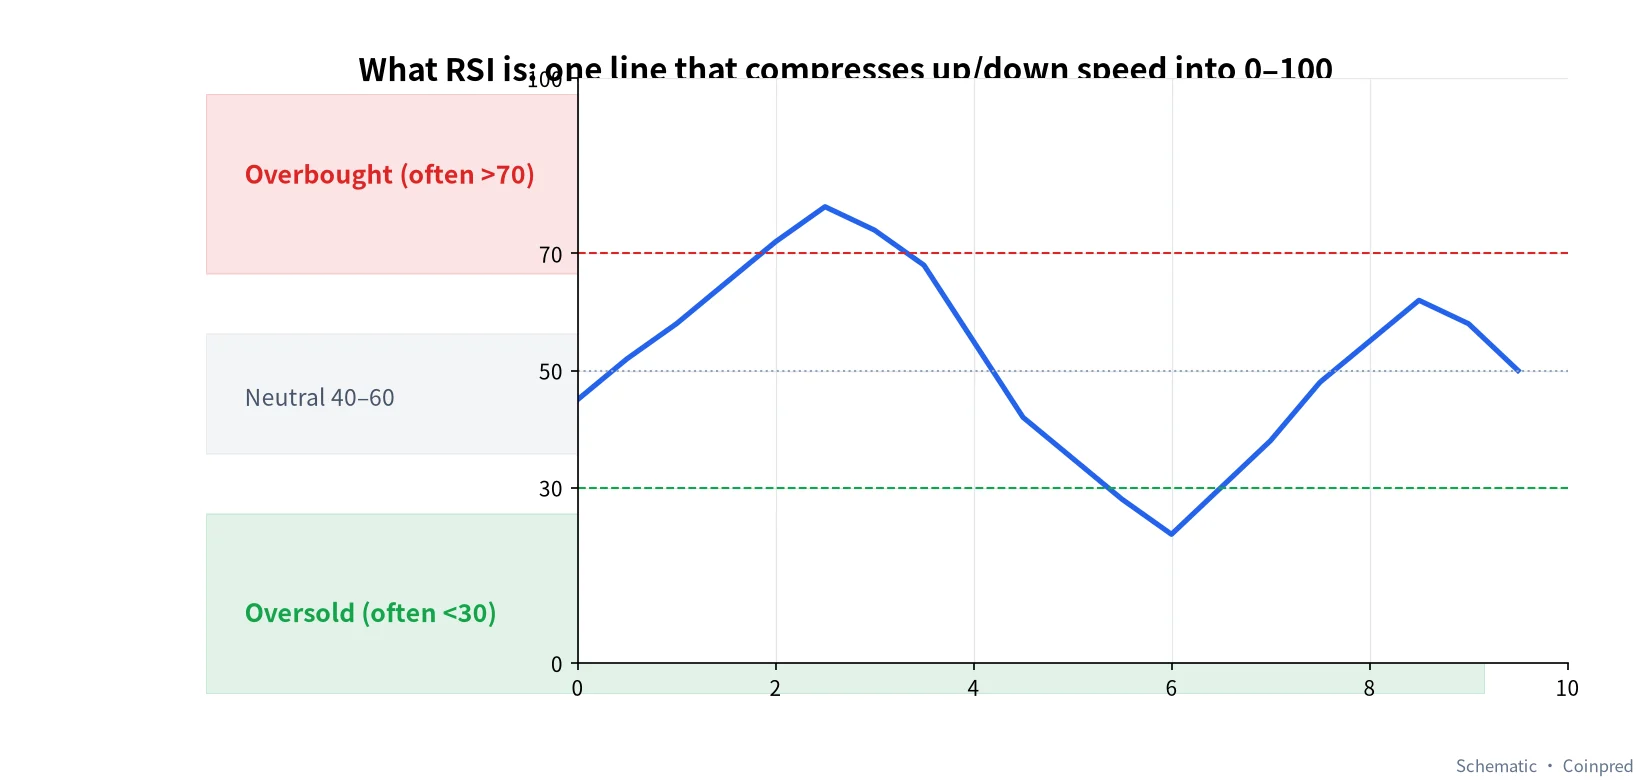
The diagram is a schematic: one line swings between 0 and 100, with a red band up top, a green band below, and a grey mid band. In live markets the line pokes in and out constantly, so a single touch of 70 or 30 is nowhere near enough to act on.
2. The big picture: BTC RSI from July to October
Here are daily BTC candles from July 1 to October 31, 2026, with RSI(14) underneath:
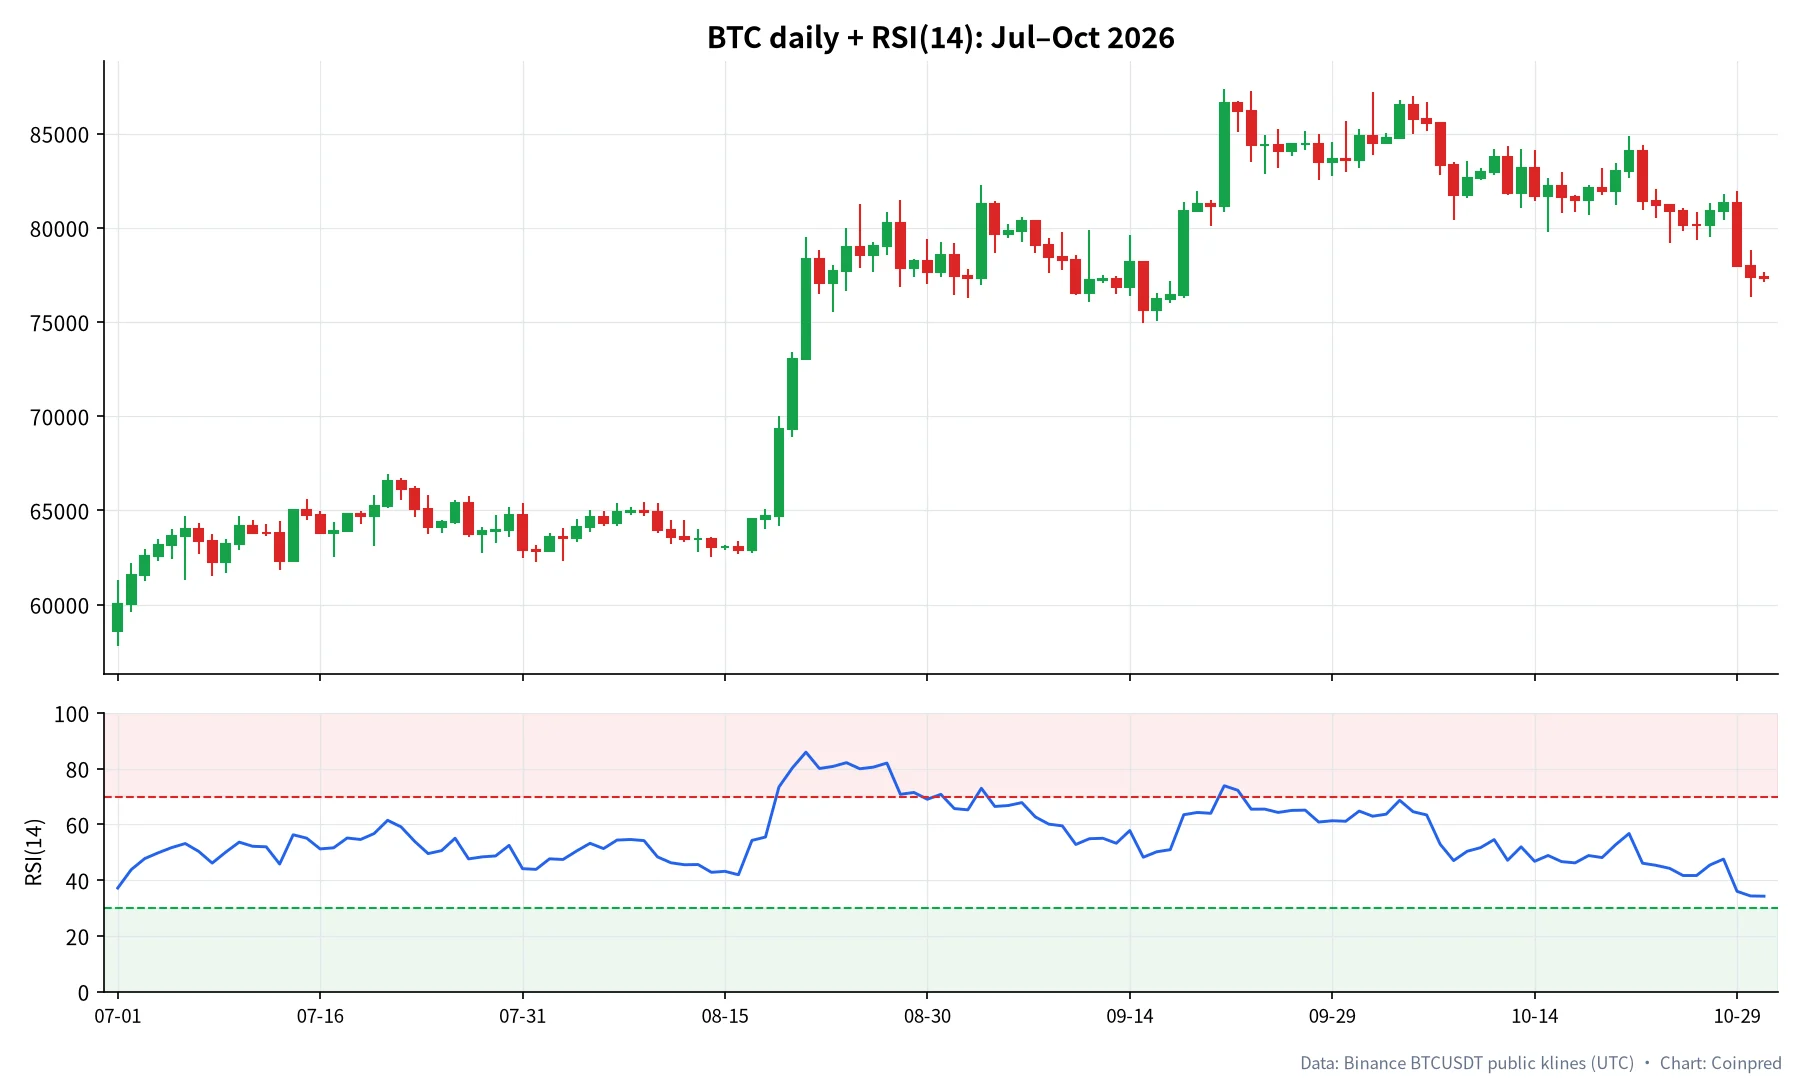
Three different moods jump out:
- Early July to mid-August: price chopped roughly 61,000–67,000; RSI mostly hugged the middle.
- Late August: price ripped higher and RSI parked in overbought — for a long time.
- September–October: the high cooled off; after the October 29 drop, RSI sat near 34.
The next sections unpack each mood.
3. Overbought ≠ an instant top: 11 straight days in August
The classic beginner trap is reading “RSI > 70” as “time to short.” Look at August:
| Date (UTC) | Close (USDT) | RSI(14) |
|---|---|---|
| Aug 19 | 69,334.79 | 73.47 |
| Aug 20 | 73,025.15 | 80.32 |
| Aug 21 | 78,338.03 | 85.95 |
| Aug 22 | 77,074.93 | 80.08 |
| Aug 23 | 77,734.00 | 80.82 |
| Aug 24 | 78,992.75 | 82.17 |
| Aug 25 | 78,539.14 | 79.98 |
| Aug 26 | 79,023.75 | 80.58 |
| Aug 27 | 80,249.58 | 82.03 |
| Aug 28 | 77,845.87 | 70.82 |
| Aug 29 | 78,230.00 | 71.49 |
From August 19 to 29, RSI spent 11 trading days above 70, peaking near 85.95 on August 21. Price? It climbed from about 69,335 to an August 27 close near 80,250 — price kept rising while RSI was overbought.
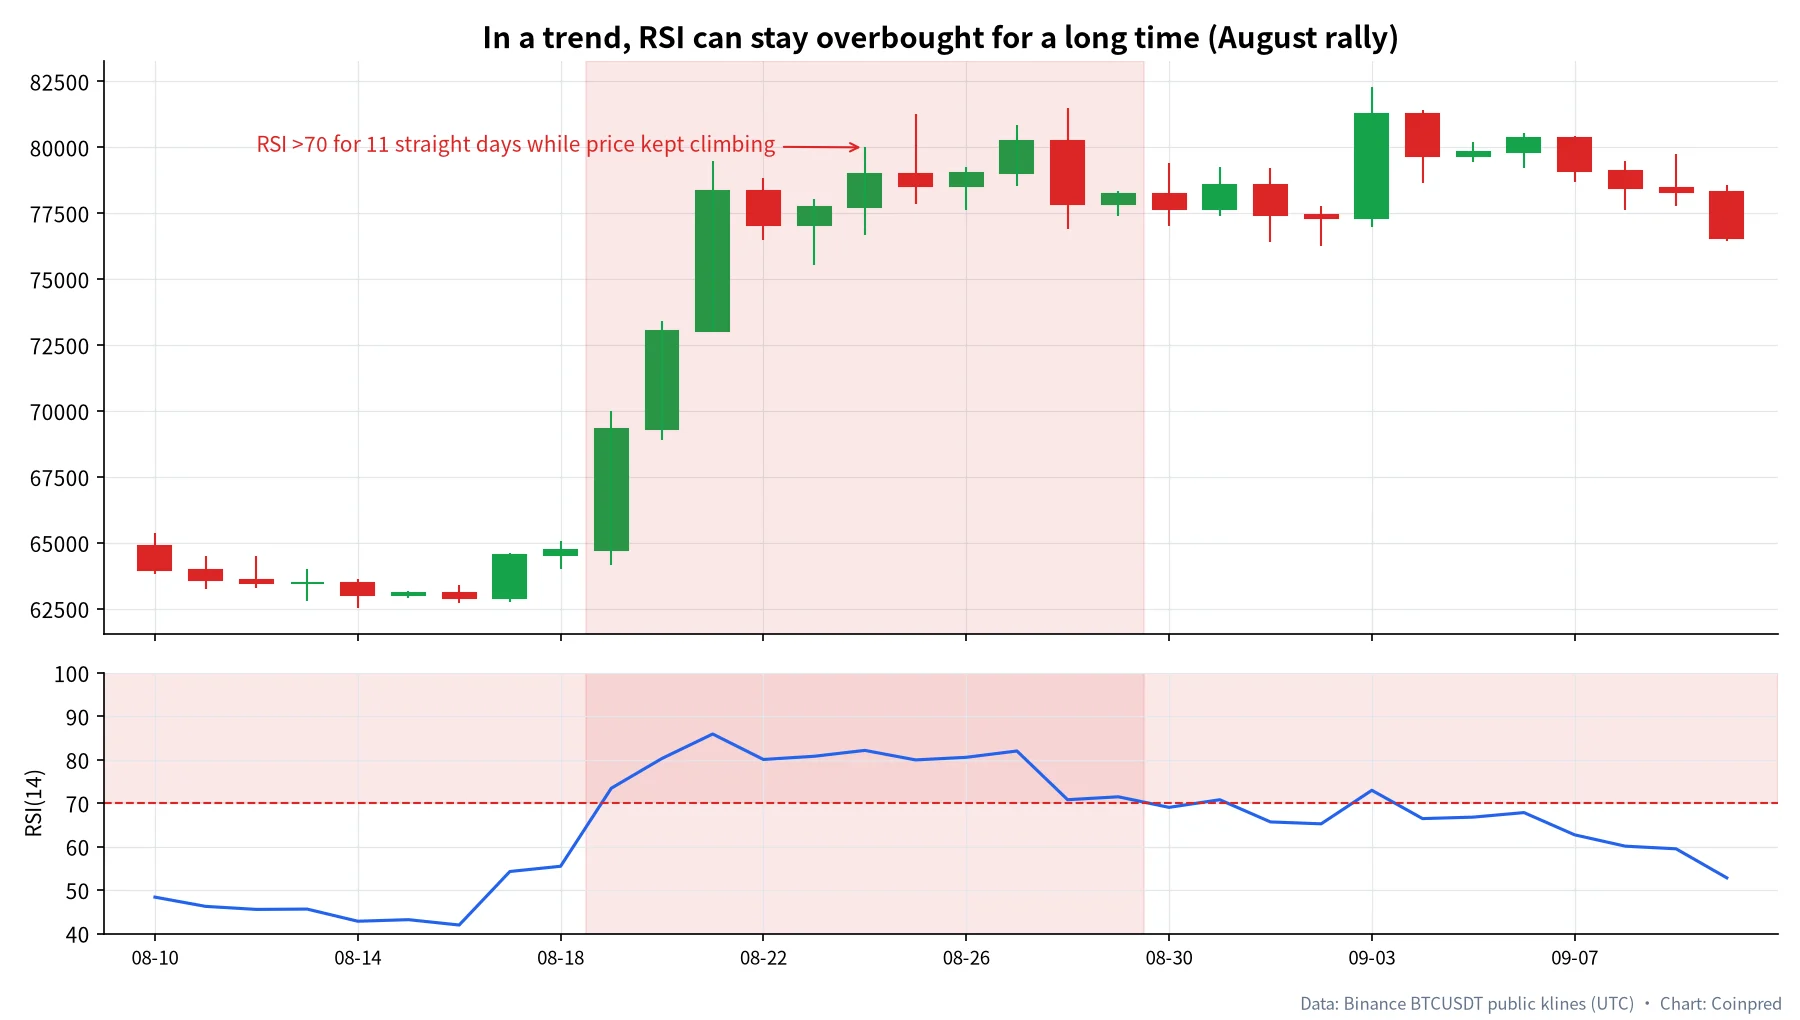
How we read it:
- In a clear uptrend, overbought RSI often means “the trend is strong,” not “reverse now.”
- More useful is when RSI falls back under 70 while price also loses a key zone — not the first kiss of 70.
- This August stretch is the same breakout we described in the support/resistance guide; RSI just confirms the move was violent from another angle.
4. Oversold ≠ an instant bottom: the June example
So should RSI < 30 auto-buy? Early June 2026:
| Date (UTC) | Close (USDT) | RSI(14) | ~10 sessions later | ~10-day change |
|---|---|---|---|---|
| Jun 2 | 66,760.83 | 21.81 | 63,580.01 | -4.8% |
| Jun 3 | 64,142.75 | 18.63 | 64,458.01 | +0.5% |
| Jun 4 | 63,885.99 | 18.35 | 65,746.45 | +2.9% |
| Jun 5 | 61,056.47 | 15.55 | 66,328.74 | +8.6% |
| Jun 6 | 60,884.62 | 15.40 | 65,675.01 | +7.9% |
| Jun 9 | 61,730.00 | 24.14 | 63,543.91 | +2.9% |
| Jun 10 | 61,510.99 | 23.82 | 64,298.01 | +4.5% |
On June 5–6 RSI hit about 15.4–15.6 — extreme oversold. But RSI was already under 30 on June 2, and price kept probing lower for several days. The cleaner bounce showed up only after oversold persisted and price stopped making fresh extremes. From the June 5 close near 61,056 to about 66,329 ten sessions later is roughly +8.6% — that is a hindsight statistic, not a target you could have known in advance.
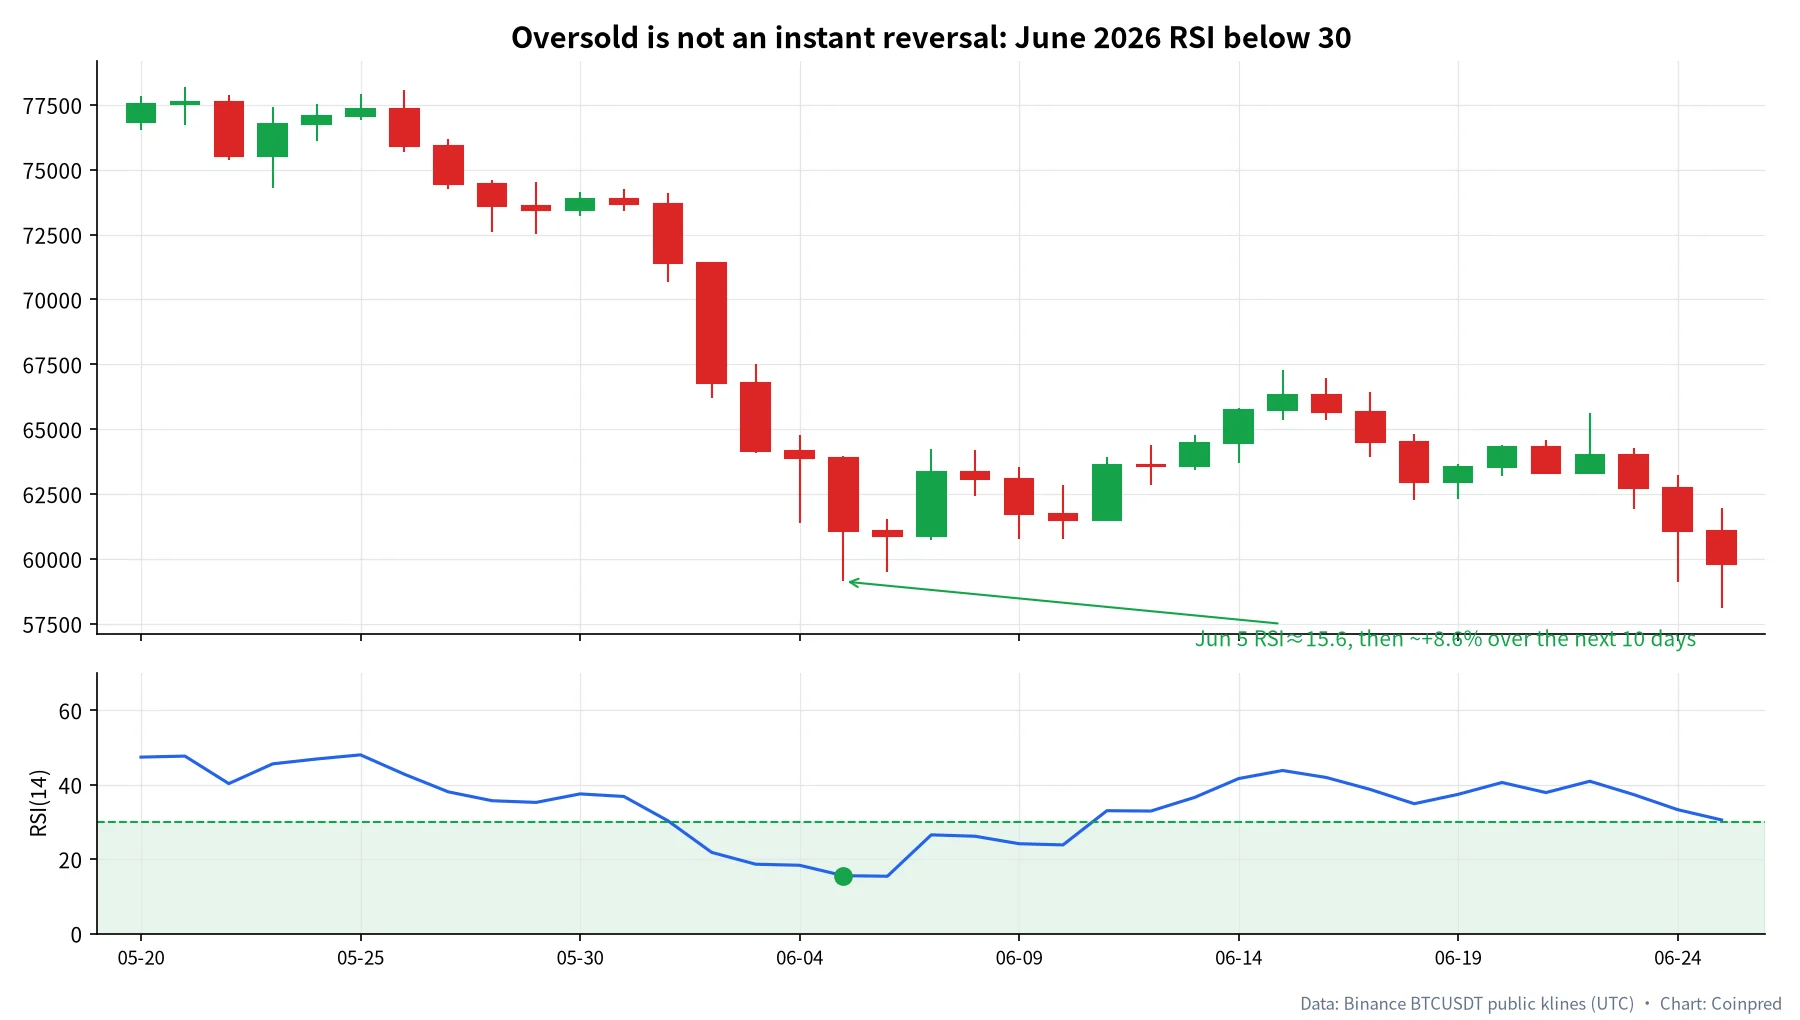
Practical takeaways:
- Oversold means the drop was sharp, not that the floor is in.
- The first break of 30 often still sees a second probe lower.
- We care more about candle reaction inside oversold and whether price sits on a pre-drawn support zone than about the raw RSI print.
5. Divergence: price higher high, RSI lower high
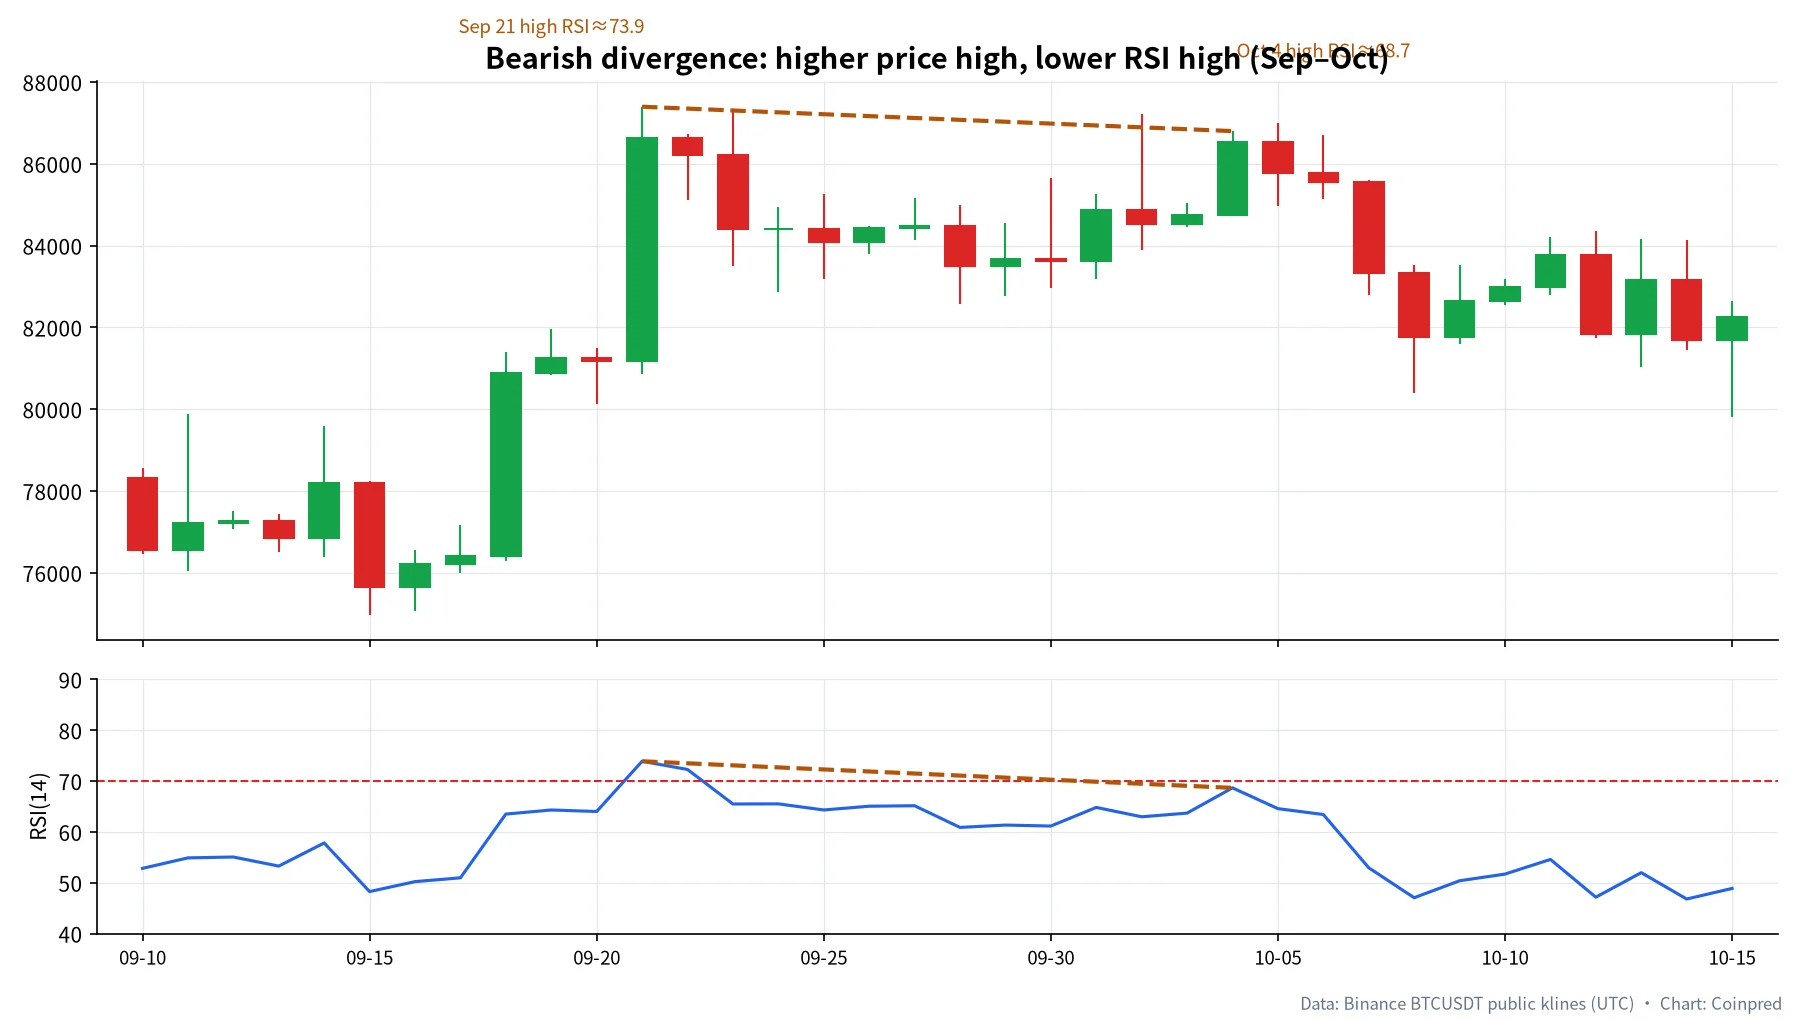
Divergence is the most dramatic — and most over-interpreted — RSI story. A classic bearish divergence: price prints a higher high while RSI prints a lower high — upside energy is fading.
September–October 2026:
| Checkpoint | Date (UTC) | Day’s high | Close | RSI(14) |
|---|---|---|---|---|
| Earlier high | Sep 21 | 87,395.67 | 86,620.00 | 73.90 |
| Later high | Oct 4 | 86,800.00 | 86,530.00 | 68.66 |
On the price side, September 21’s high near 87,396 and October 4’s high near 86,800 both sit in the upper-86k area; on the RSI side, the reading cooled from about 73.9 to about 68.7. Connect those highs and you get a textbook bearish-divergence sketch.
How we use divergence:
- It is a warning, not a trigger. It says “this push is weaker than the last one,” not “sell tomorrow.”
- Pair it with structure: if divergence prints while price still holds a key average or support, we usually just trim or tighten stops rather than flip short.
- Bullish divergence is the mirror image (lower price low, higher RSI low); we will not redraw it here.
6. Ranges: RSI mostly lives in 40–60
Many traders memorize “sell 70 / buy 30” and forget RSI’s home turf in chop — the mid band.
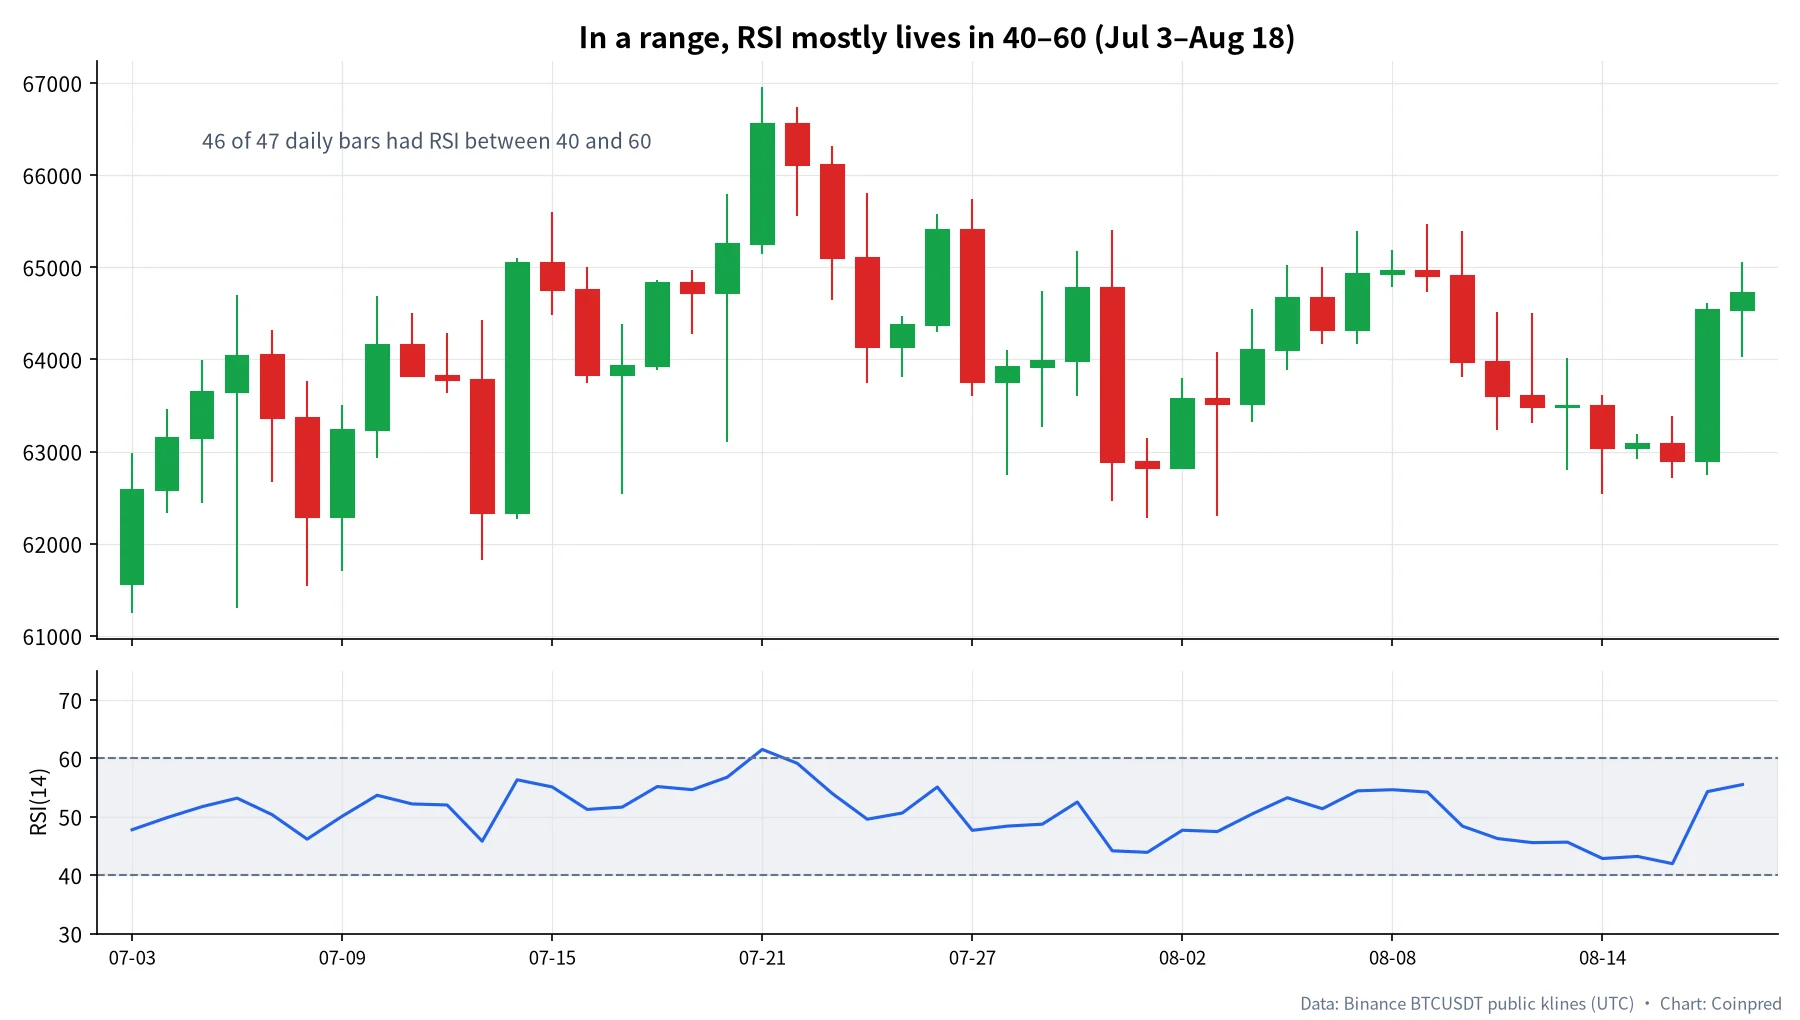
From July 3 to August 18, 2026 (the stretch when BTC sat roughly 61,249–66,956), there were 47 daily bars:
| Metric | Value |
|---|---|
| RSI low | ~41.97 |
| RSI high | ~61.51 |
| RSI average | ~50.76 |
| Days with RSI in 40–60 | 46 / 47 |
For a month and a half, RSI almost never printed classic overbought or oversold, yet price swept the range several times. If you only wait for 30/70, you sit on your hands. The better play is back at support and resistance: look for buyer reactions near the range floor and seller reactions near the ceiling, and let RSI simply confirm “neither hot nor cold.”
7. Recently: late-October RSI near 34
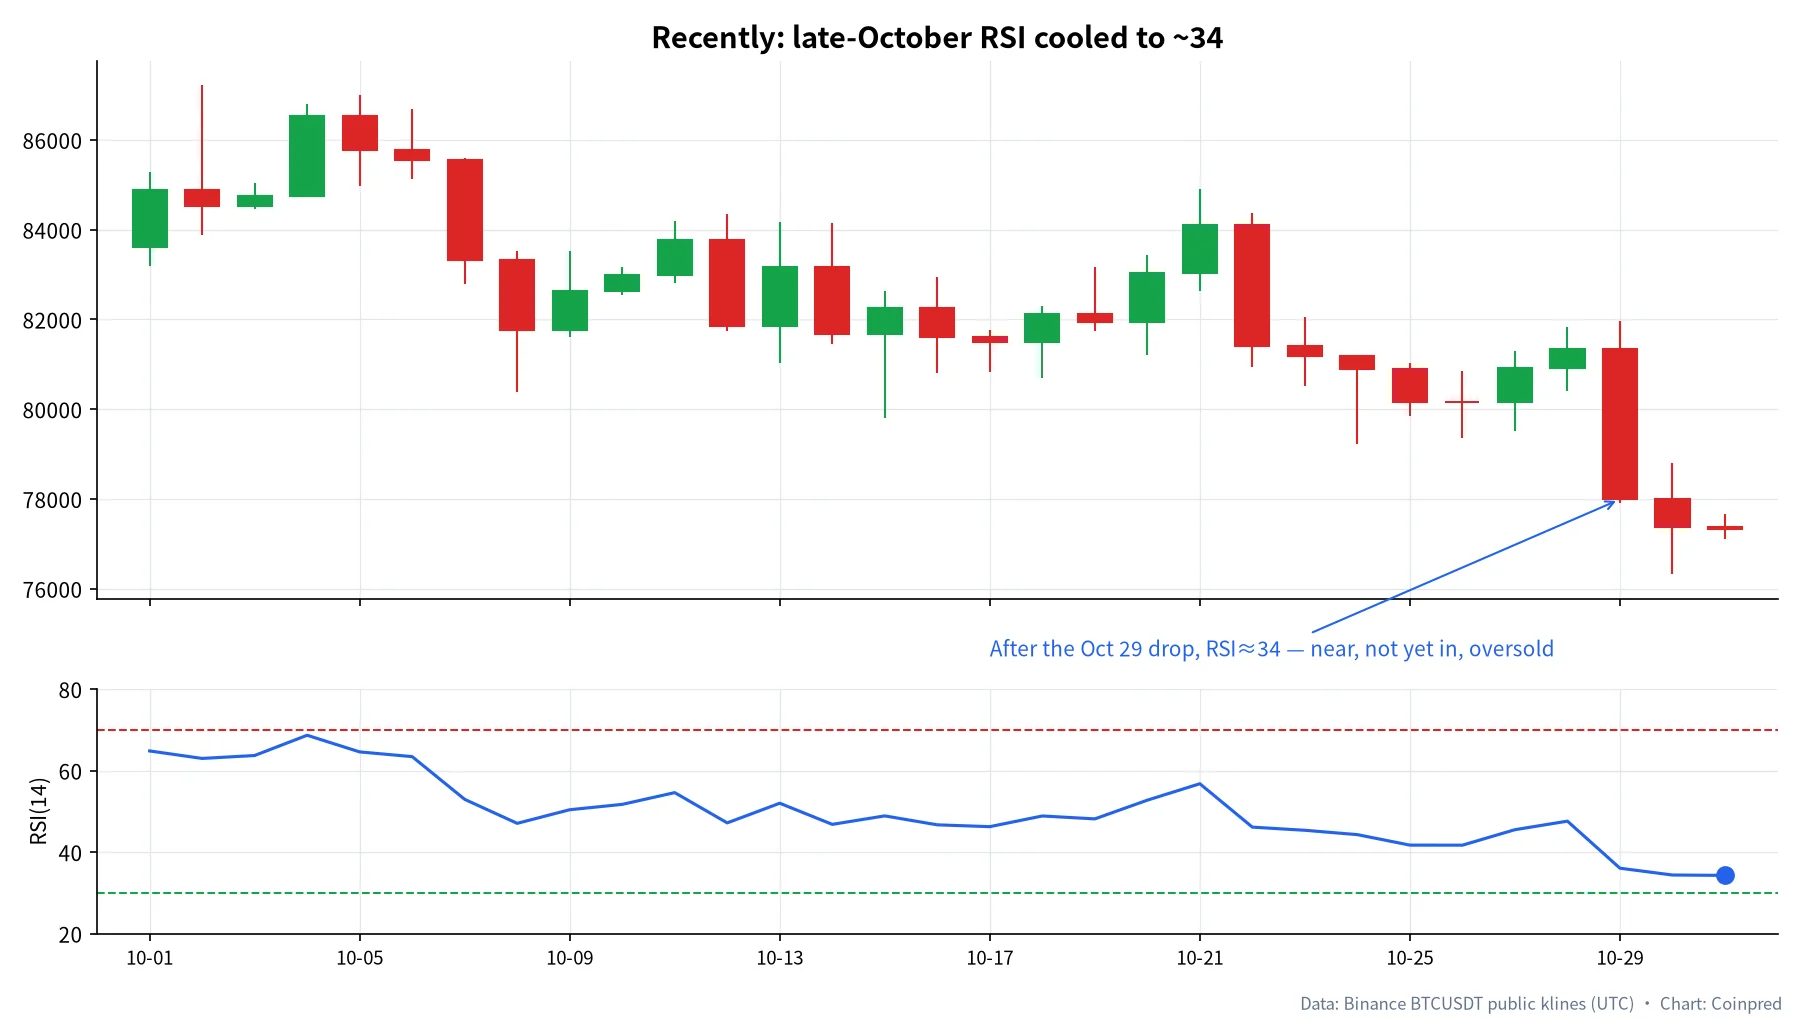
As of the 2026-10-31 UTC daily bar, the latest prints look like this:
| Date (UTC) | Close | RSI(14) |
|---|---|---|
| Oct 28 | 81,343.50 | 47.59 |
| Oct 29 | 77,991.89 | 36.04 |
| Oct 30 | 77,368.77 | 34.37 |
| Oct 31 | 77,336.01 | 34.28 |
After the October 29 drop, RSI fell from the mid-40s into the mid-30s and then hovered near 34 — close to oversold, not yet under 30. We read that as “clearly cooler,” not as a buy signal. Whether it later tags 30 or stabilizes in the 30–40 band is for future closes to answer.
If you also trade short-horizon direction calls, you can combine RSI context with event-contract windows — but that is execution detail. Reading the daily temperature first matters more. See our BTC event contracts overview and how to use the platform.
8. Period settings: 7 vs 14 vs 21
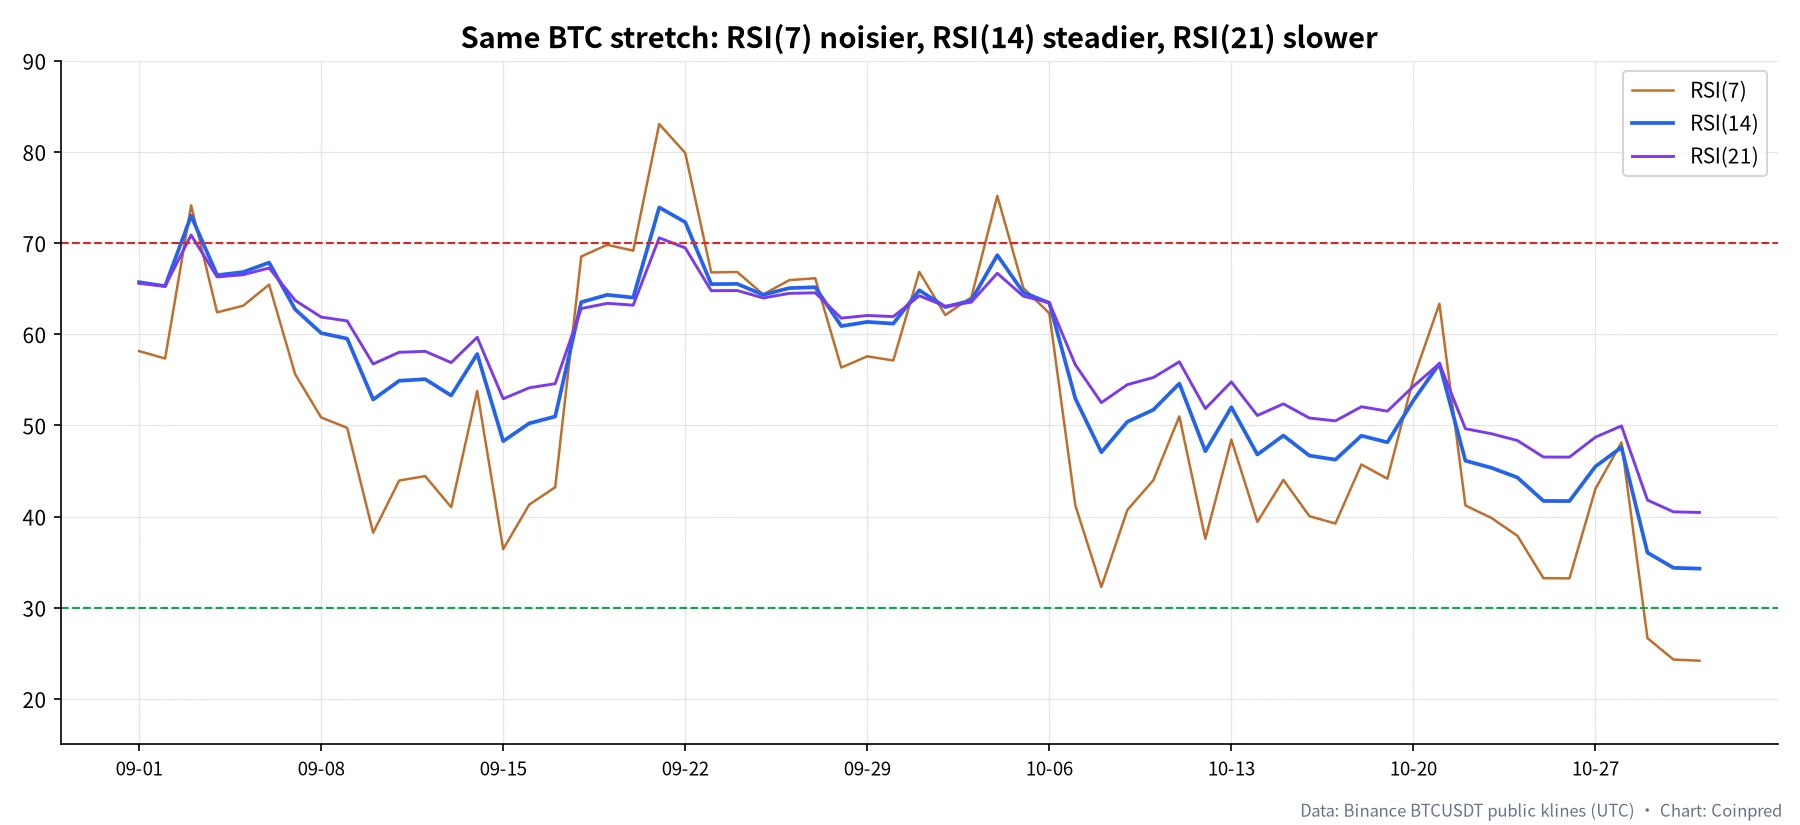
Fourteen is not sacred. Overlaying RSI(7), RSI(14) and RSI(21) on the same Sep–Oct BTC stretch:
| Period | Behavior | Better for |
|---|---|---|
| RSI(7) | Turns fast, noisy | Short-term watching with strict filters |
| RSI(14) | Balanced, software default | Daily teaching and routine reviews |
| RSI(21) | Slower, fewer signals | Filtering noise, catching larger swings |
Our habit: main pane on 14, glance at 21 for confirmation; we rarely decide from RSI(7) on the daily alone unless we are also managing a 4-hour or 1-hour entry.
9. A five-step RSI habit
Compress the above into a daily routine:
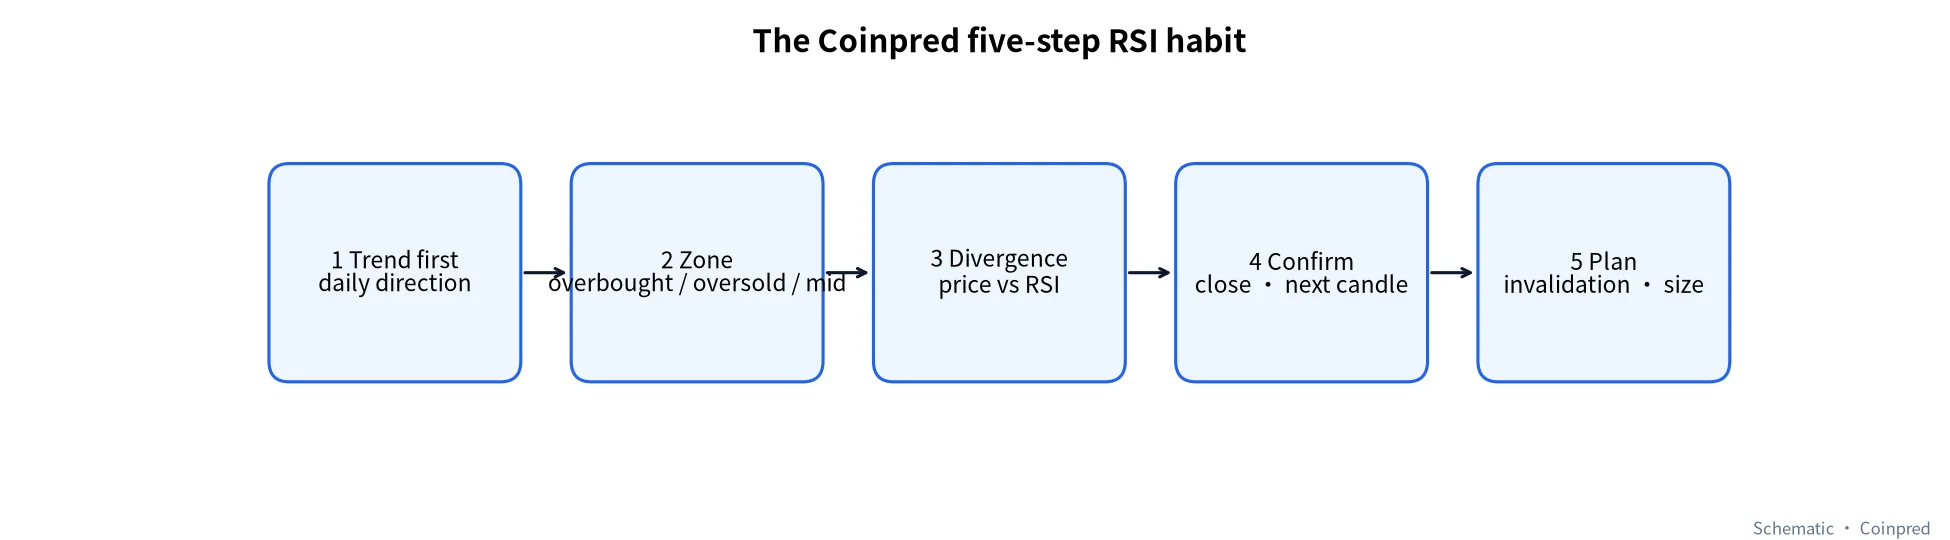
- Trend first: is the daily up, down, or ranging? Overbought/oversold mean different things in each case.
- Zone next: is RSI in overbought, oversold, or the 40–60 mid band?
- Check divergence: do price swings and RSI swings agree?
- Wait for confirmation: the close, the next candle, and whether price sits on support/resistance.
- Write the plan: if the idea is wrong (for example a daily close back through a zone), what will you do?
10. Common beginner mistakes
- Treating 70/30 as a switch — trends can stay extreme for days.
- Reading RSI without price structure — a thermometer without a room.
- Forcing daily conclusions from 5-minute divergences — mismatched timeframes.
- Ignoring the mid band — in ranges, 40–60 is normal.
- Tweaking the period until history looks perfect — fix a rule and review it for months.
FAQ
Who invented RSI, and why is 14 common?
J. Welles Wilder introduced it in the 1970s and often used 14 in examples. Fourteen is a convention, not magic. You may standardize on 21 — just do not change it every week.
Should crypto use 80/20 instead?
Higher volatility makes 70/30 fire more often. Some traders move to 80/20 to cut noise. Our advice: lock one pair of thresholds for a few months of reviews before you change anything.
Is RSI more important than support and resistance?
For us, location (S/R) comes first; RSI describes energy. A key zone plus divergence or an exit from an extreme is more useful than either tool alone.
How soon does price fall after a bearish divergence?
No fixed answer. Some divergences reverse quickly; others chop for weeks or even make a new high that “cancels” the divergence. Use it to lower expectations, not to place the order.
What if daily and 4-hour RSI disagree?
Defer to the higher timeframe. Daily still trending up with 4-hour overbought usually means a short pullback; daily already broken with 4-hour oversold is not automatically a major bottom.
Can I automate RSI signals?
Yes, but add trend filters and invalidation rules. A naked “buy when RSI < 30” rule will catch falling knives in a one-way decline. Every example here is for study and review — not investment advice.
Must RSI use Wilder smoothing?
Most charting platforms default to Wilder’s smoothing. A simple-moving-average variant will print slightly different numbers. When you compare with someone else, match the formula.
Data and references
- Candle data: Binance public API at data-api.binance.vision, BTCUSDT daily, windows spanning 2026-05-20 to 2026-10-31 (UTC) as cited above; RSI(14) computed from closes with Wilder smoothing.
- Binance Academy: RSI Explained
- Investopedia: Relative Strength Index (RSI)
- Wilder, J. Welles. New Concepts in Technical Trading Systems (original RSI source)
All charts were drawn by Coinpred from the public data above. Trading involves risk — size positions and decide for yourself.