The short version: a candle is a receipt, not a forecast
Most people start learning candlesticks by memorising names — hammer, engulfing, morning star — and then open a live chart and still feel lost. Our take is simple: the names can wait. First understand what a single candle actually records, and everything built on top of it stops feeling like rote learning.
A candle answers exactly one question: over this period, where did price start, how far did it travel, and where did it finish? It does not tell you what happens next. Reading candles is about judging who is stronger right now, by how much, and at what location — so you can decide whether to wait, look for confirmation, or act on a plan you already made.
This guide moves from a single candle to location, timeframes, patterns, confirmation and finally a routine, with a chart at every step. The real market charts were drawn by Coinpred from Binance’s public BTCUSDT kline data; all times are UTC.
The four prices behind every candle
Every candle is drawn from four numbers: open, close, high and low. The box between open and close is the body. The thin line from the top of the body to the high is the upper wick, and the line from the bottom of the body to the low is the lower wick.
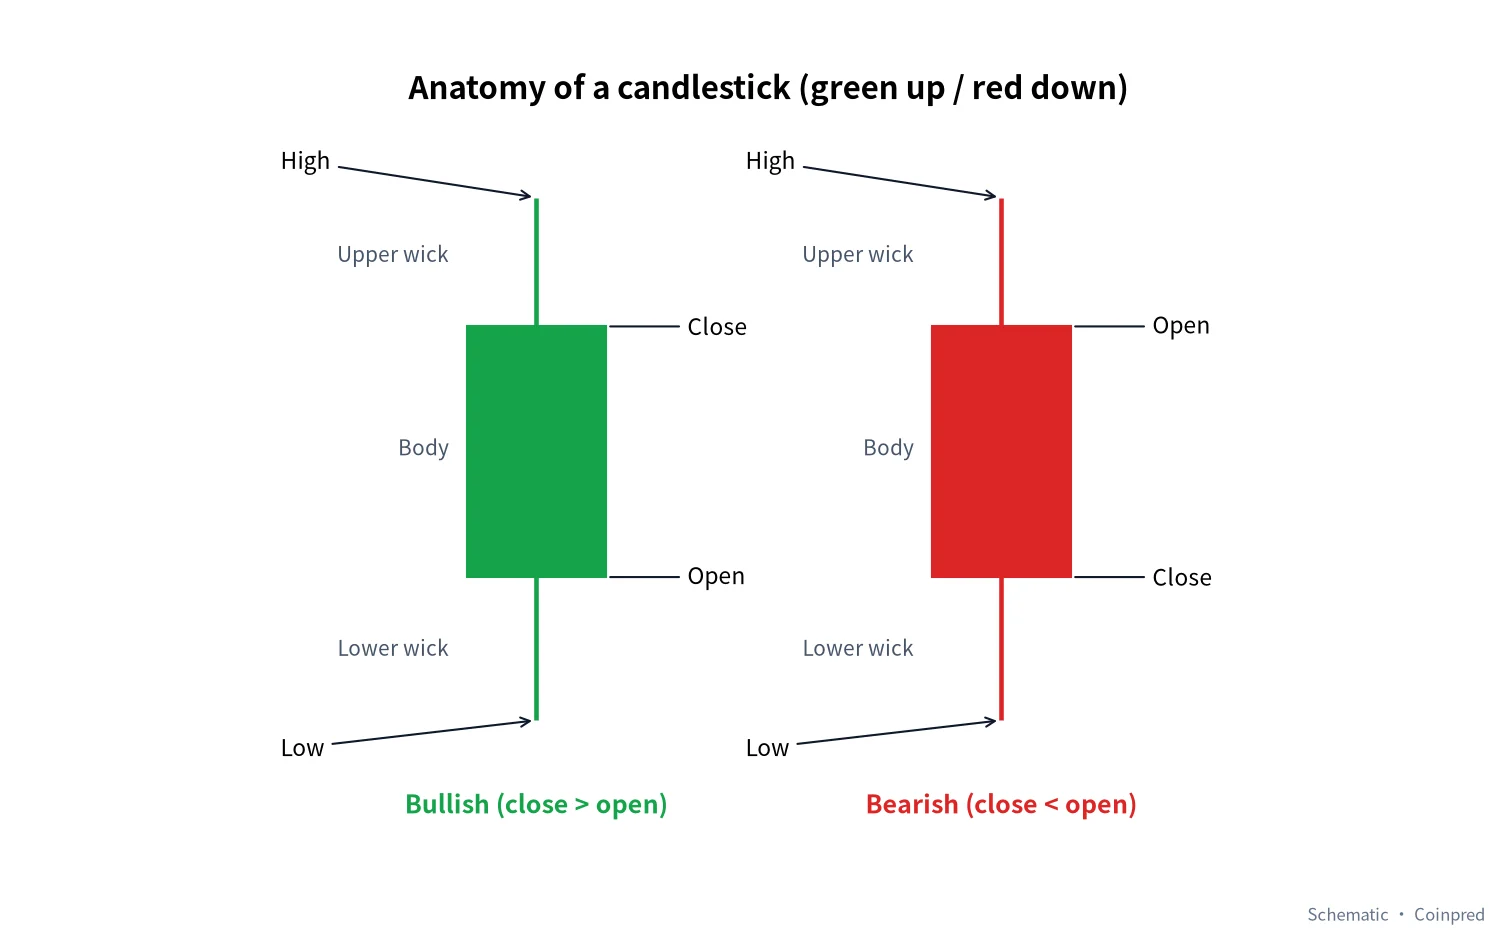 Figure 1: Candle anatomy. Left, a bullish candle closing above its open; right, a bearish candle closing below it. Diagram: Coinpred
A word on colour. Most international platforms default to green for up, red for down, while many Chinese equity apps use the opposite. If you switch between markets, don’t rely on colour at all — rely on position. A close above the open is an up candle, full stop. Every chart in this article uses green-up, red-down.
| Part | Set by | What we look for |
|---|---|---|
| Body | Open and close | Net change over the period, and which side won it |
| Upper wick | High vs. top of body | Whether a push higher was sold back |
| Lower wick | Low vs. bottom of body | Whether a drop was bought back |
| Close position | Where the close sits within the high–low range | Who was in control at the finish — often more telling than colour |
| Timeframe | The interval you choose (1m, 1h, 1d…) | How much time one candle represents; the same shape carries very different weight on different intervals |
Body size is relative; the close matters more
There is no fixed definition of a “big” candle. On a quiet day Bitcoin might move a percent or two; in a volatile session it can cover the same distance in an hour. Always judge a body against the candles around it, not against a number in your head.
What deserves more attention than size is where the candle closes. The three candles below share the same high and low — only the close differs:
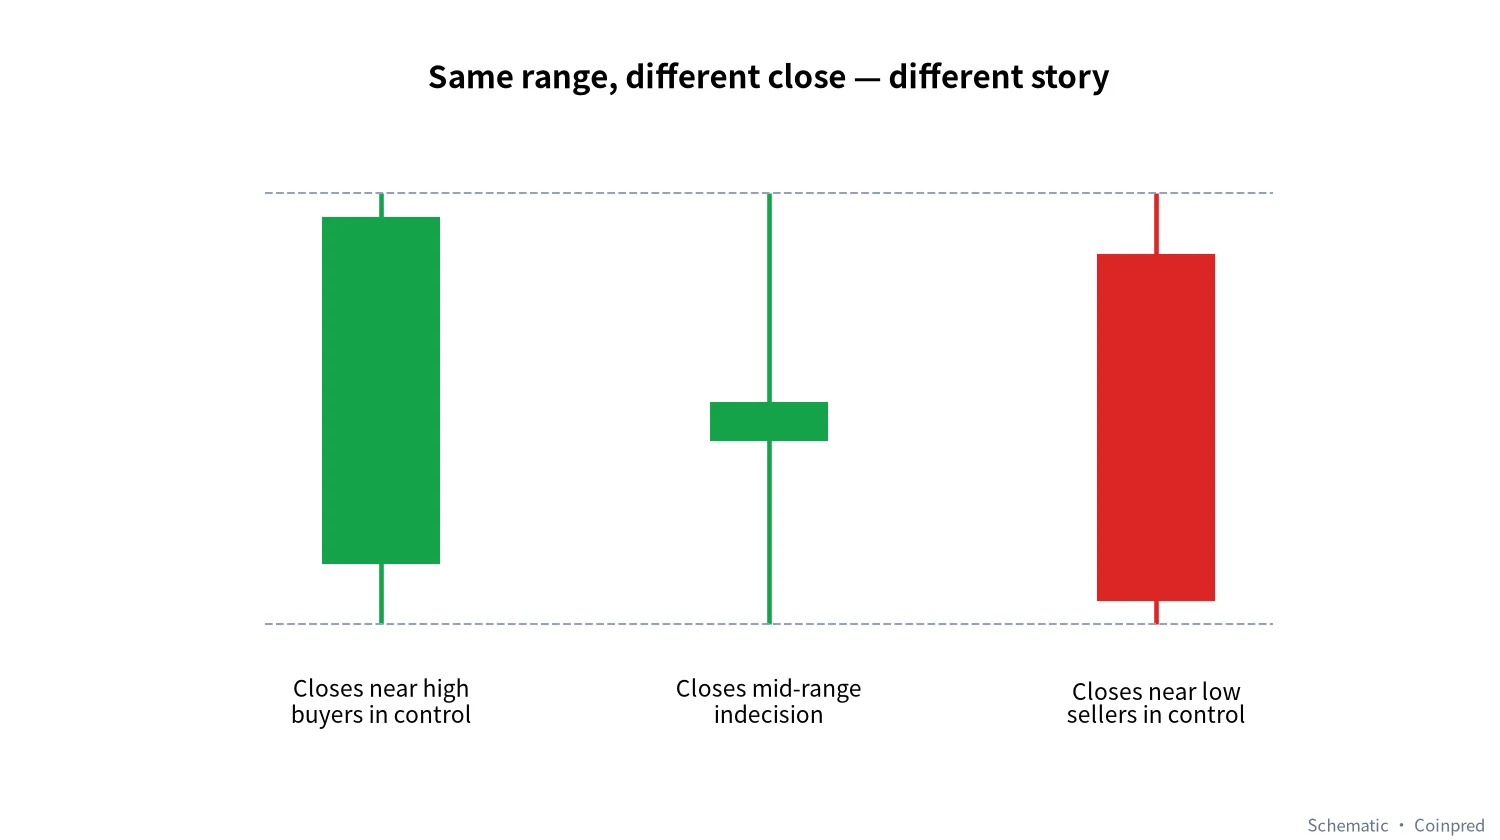 Figure 2: Same range, three different stories. Diagram: Coinpred
- Close near the high: price dipped at some point, but buyers pushed it back to the top before the period ended.
- Close mid-range: a full period of back-and-forth with no winner — typical of indecisive consolidation.
- Close near the low: sellers held control to the end. After a run-up, that is worth noticing.
Our habit is to ask “where did it close?” before “what colour is it?”. That order alone filters out a lot of panic selling on red and chasing on green.
A wick means what its location says
A wick marks prices that were reached but not held. A long lower wick says someone bought the dip; a long upper wick says someone sold the rally. That is only half the story, though — the same wick means very different things in different places.
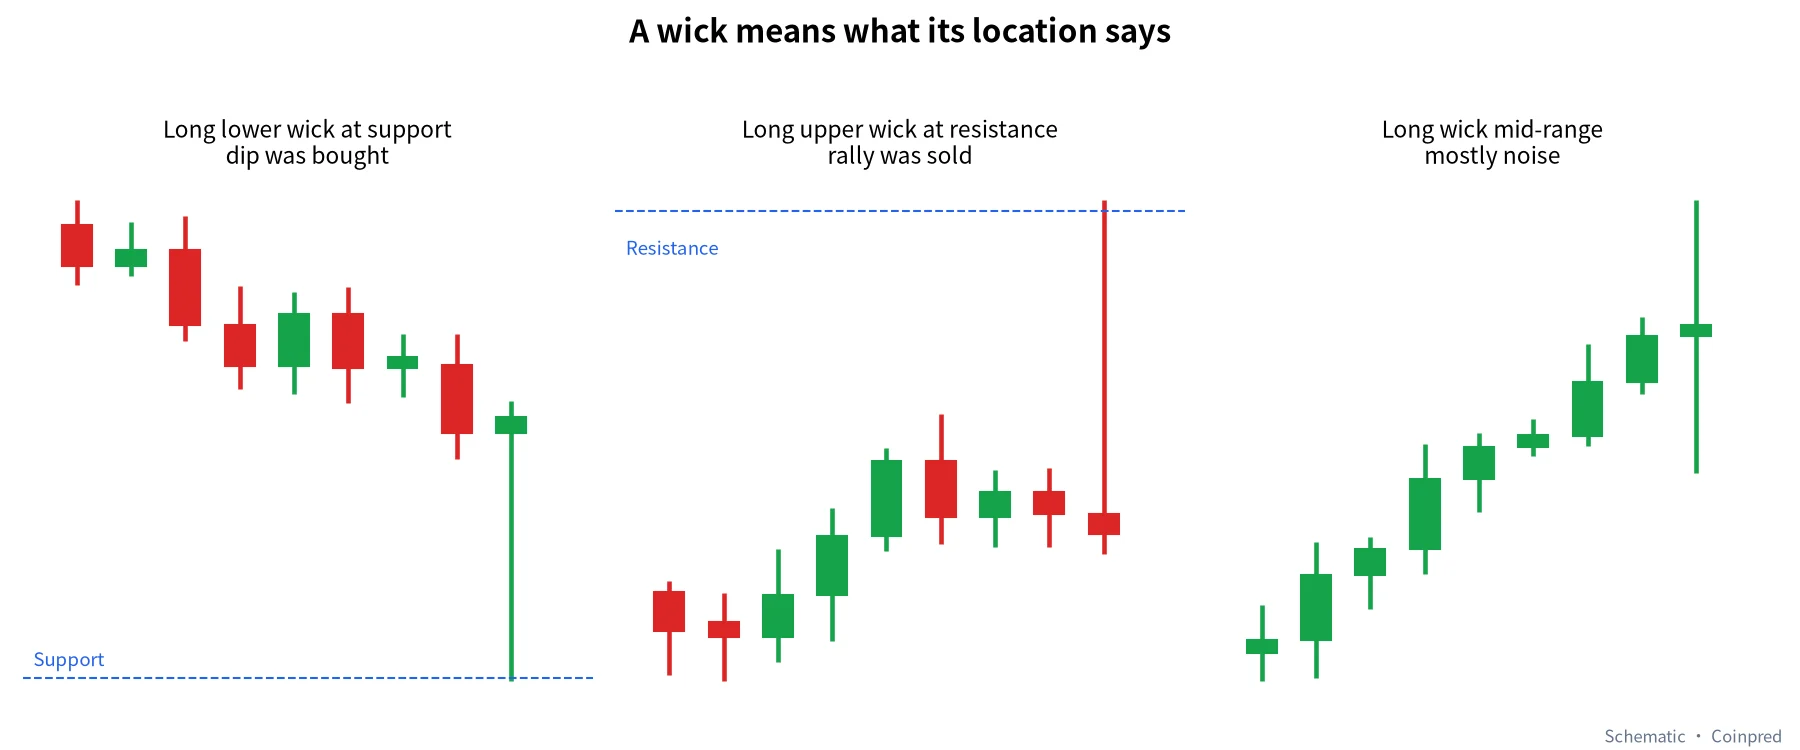 Figure 3: Wicks at support or resistance carry information; wicks in the middle of a range are mostly noise. Diagram: Coinpred
Crypto trades around the clock, and liquidity varies a lot between sessions. Late at night or over weekends you will occasionally see a spike that slices through a level in a minute or two and snaps straight back. On a 1-minute chart it looks dramatic; on a 4-hour or daily chart it may be an ordinary wick.
Here is a real BTC 1-hour chart. We had a script scan the last ten days and mark the longest lower wick and the longest upper wick:
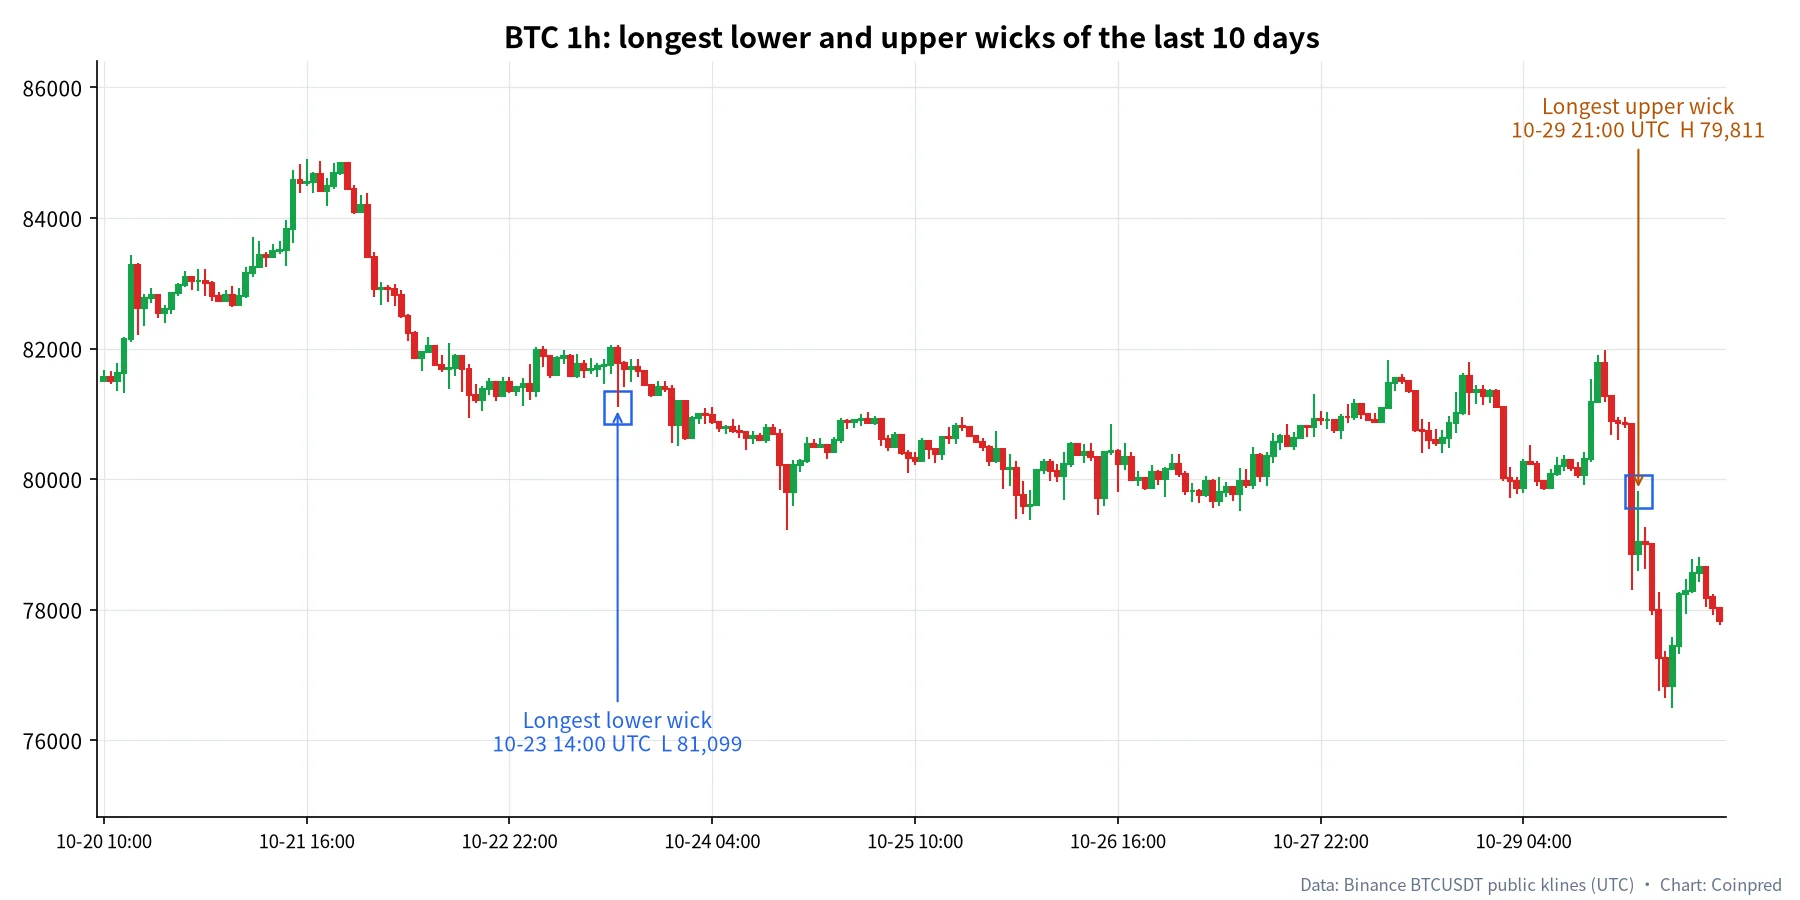 Figure 4: BTCUSDT 1-hour, Oct 20–30. Data: Binance public klines (UTC); chart: Coinpred
Two takeaways. First, the long lower wick on October 23 appeared inside a sideways stretch and, in hindsight, changed nothing — a mid-range wick. Second, the long upper wick on October 29 came after a bounce and was followed by a string of lower closes. The wick hinted at selling pressure above, but what really made the case was each following candle closing lower than the last. The wick is a clue; the closes that follow are the evidence.
Pick your timeframe top-down
The same stretch of market can tell a completely different story on a different interval. Below are BTC’s last 60 days on the daily, last 15 days on the 4-hour and last 4 days on the 1-hour:
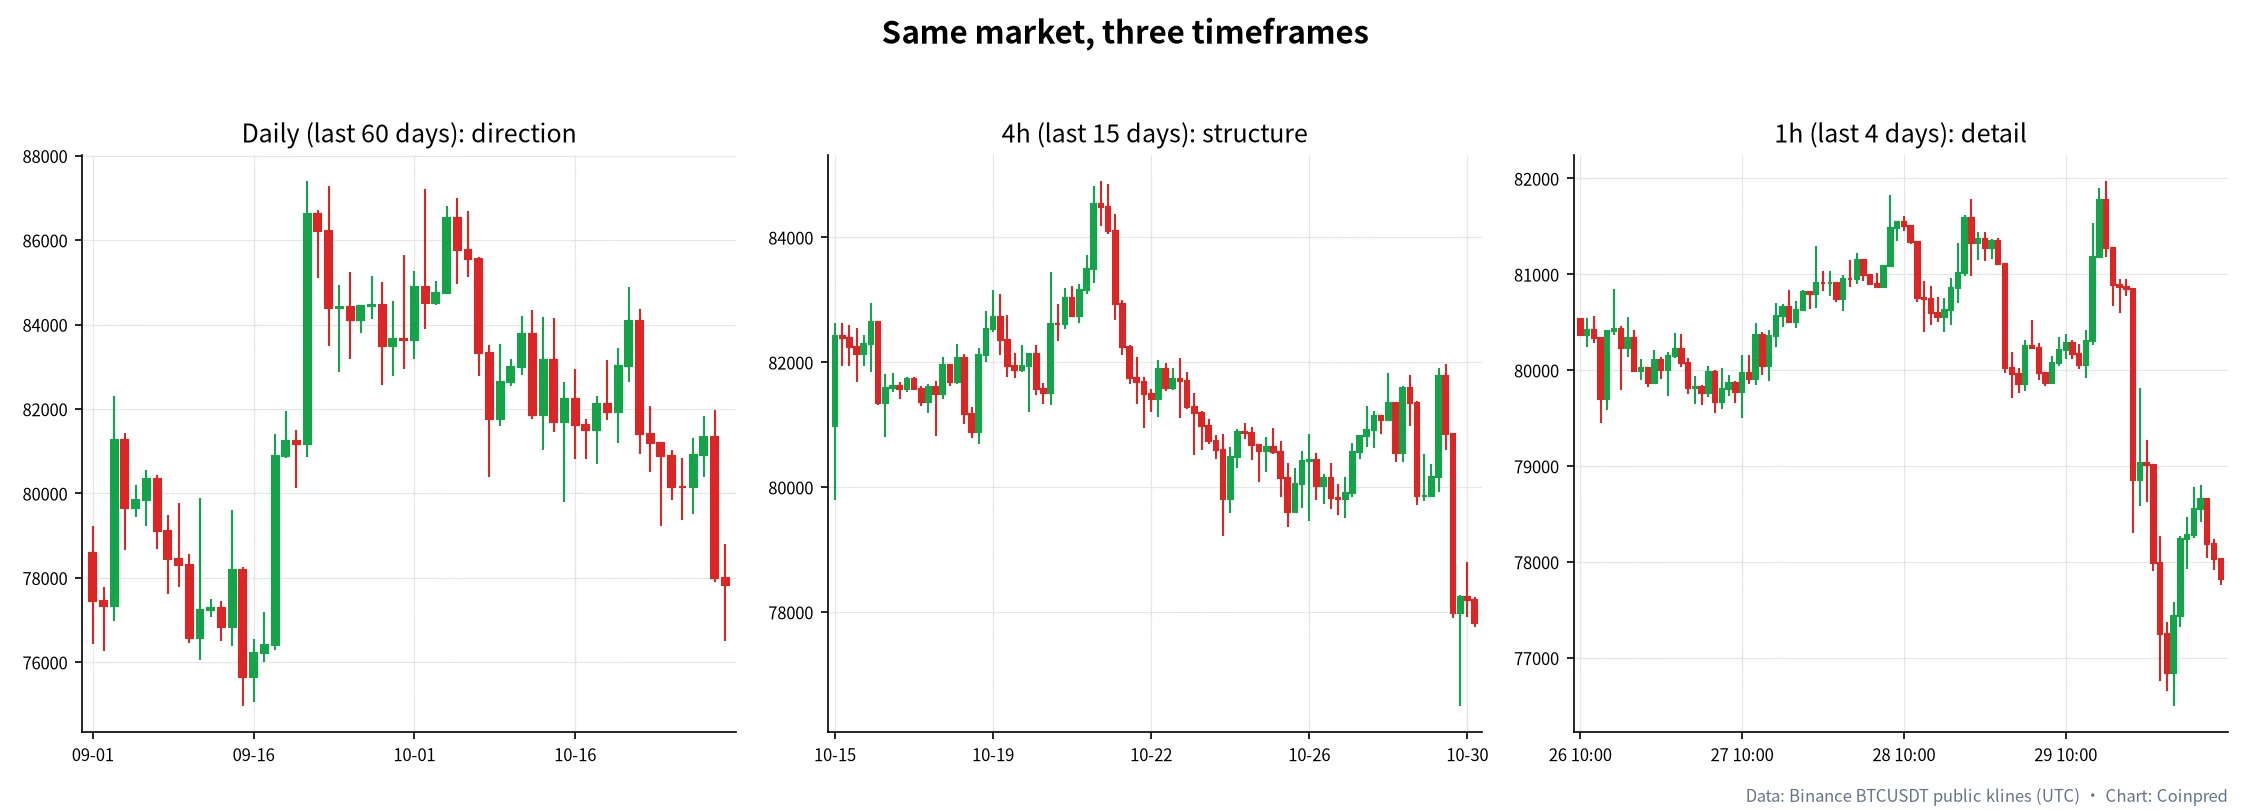 Figure 5: Daily for direction, 4h for structure, 1h for detail. Data: Binance public klines (UTC); chart: Coinpred
We work top-down: daily or 4-hour first to decide whether the backdrop is up, down or sideways, then 1-hour or lower to find location. Doing it the other way round — hunting setups on the 1-minute chart — is the fastest way to get pushed around by noise.
| Timeframe | Question it answers | Noise per candle | How we use it |
|---|---|---|---|
| Daily | What is the bigger direction? Where are the key highs and lows? | Low | Check once a day to set the bias |
| 4-hour | Trending or consolidating? | Low–medium | Main chart for drawing support and resistance |
| 1-hour | How is price behaving at key levels? | Medium | Read wicks and closes in detail |
| 15-minute | Short-term rhythm and timing | Higher | Only once the bigger picture is clear |
| 1–5 minute | Very short-term swings | Very high | Beginners should mostly skip it |
One detail people miss: when does the daily candle start? Crypto never closes, so a “daily close” is just where your platform slices the day. Many venues, Binance included, cut daily candles at 00:00 UTC. If you check “today’s candle” a few hours before that, it is not finished — and conclusions drawn from an unfinished candle are premature.
Common patterns: know the name, but know what to confirm
With single candles covered, here are the five patterns we see referenced most. We stop at five on purpose: the more elaborate a pattern, the harder it is to spot reliably and the easier it is to read into.
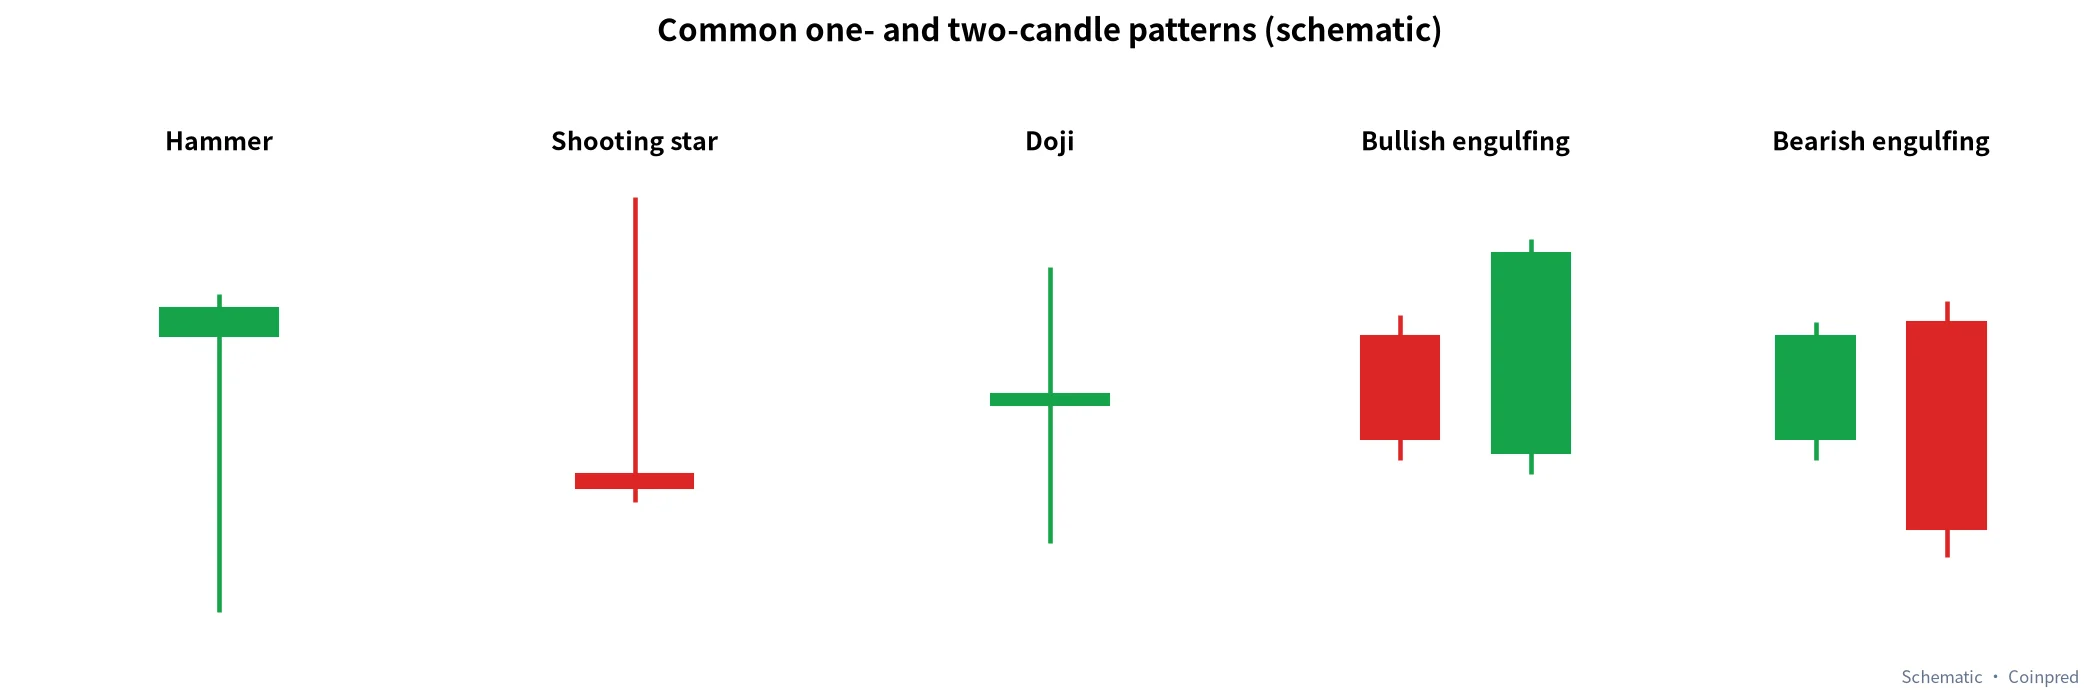 Figure 6: Five common one- and two-candle patterns. Diagram: Coinpred
| Pattern | What it looks like | Usual reading | Reliability (our experience) | What to confirm next |
|---|---|---|---|---|
| Hammer | Small body on top, long lower wick | Selling pressure fading in a decline | Medium; better at support | Next candle closes above the hammer’s body |
| Shooting star | Small body at the bottom, long upper wick | Buying fading in an advance | Medium; better at resistance | Next candle closes below its body |
| Doji | Open ≈ close, wicks both sides | Temporary balance | Low on its own | Location, and which side breaks first afterwards |
| Bullish engulfing | Green body fully covers the prior red body | Buyers strike back | Medium–high with volume | Clearly higher volume and follow-through |
| Bearish engulfing | Red body fully covers the prior green body | Sellers strike back | Medium–high with volume | Higher volume and further lower closes |
The reliability column is our own working judgement from day-to-day chart reading, not a statistic. A pattern is a prompt; location, the next close and volume together are what make it worth acting on.
Confirm with volume
Candles show how price moved; volume shows how many participated. A big green candle on heavy volume and the same candle on thin volume are different events: one has real money behind it, the other may just be price drifting through an empty order book.
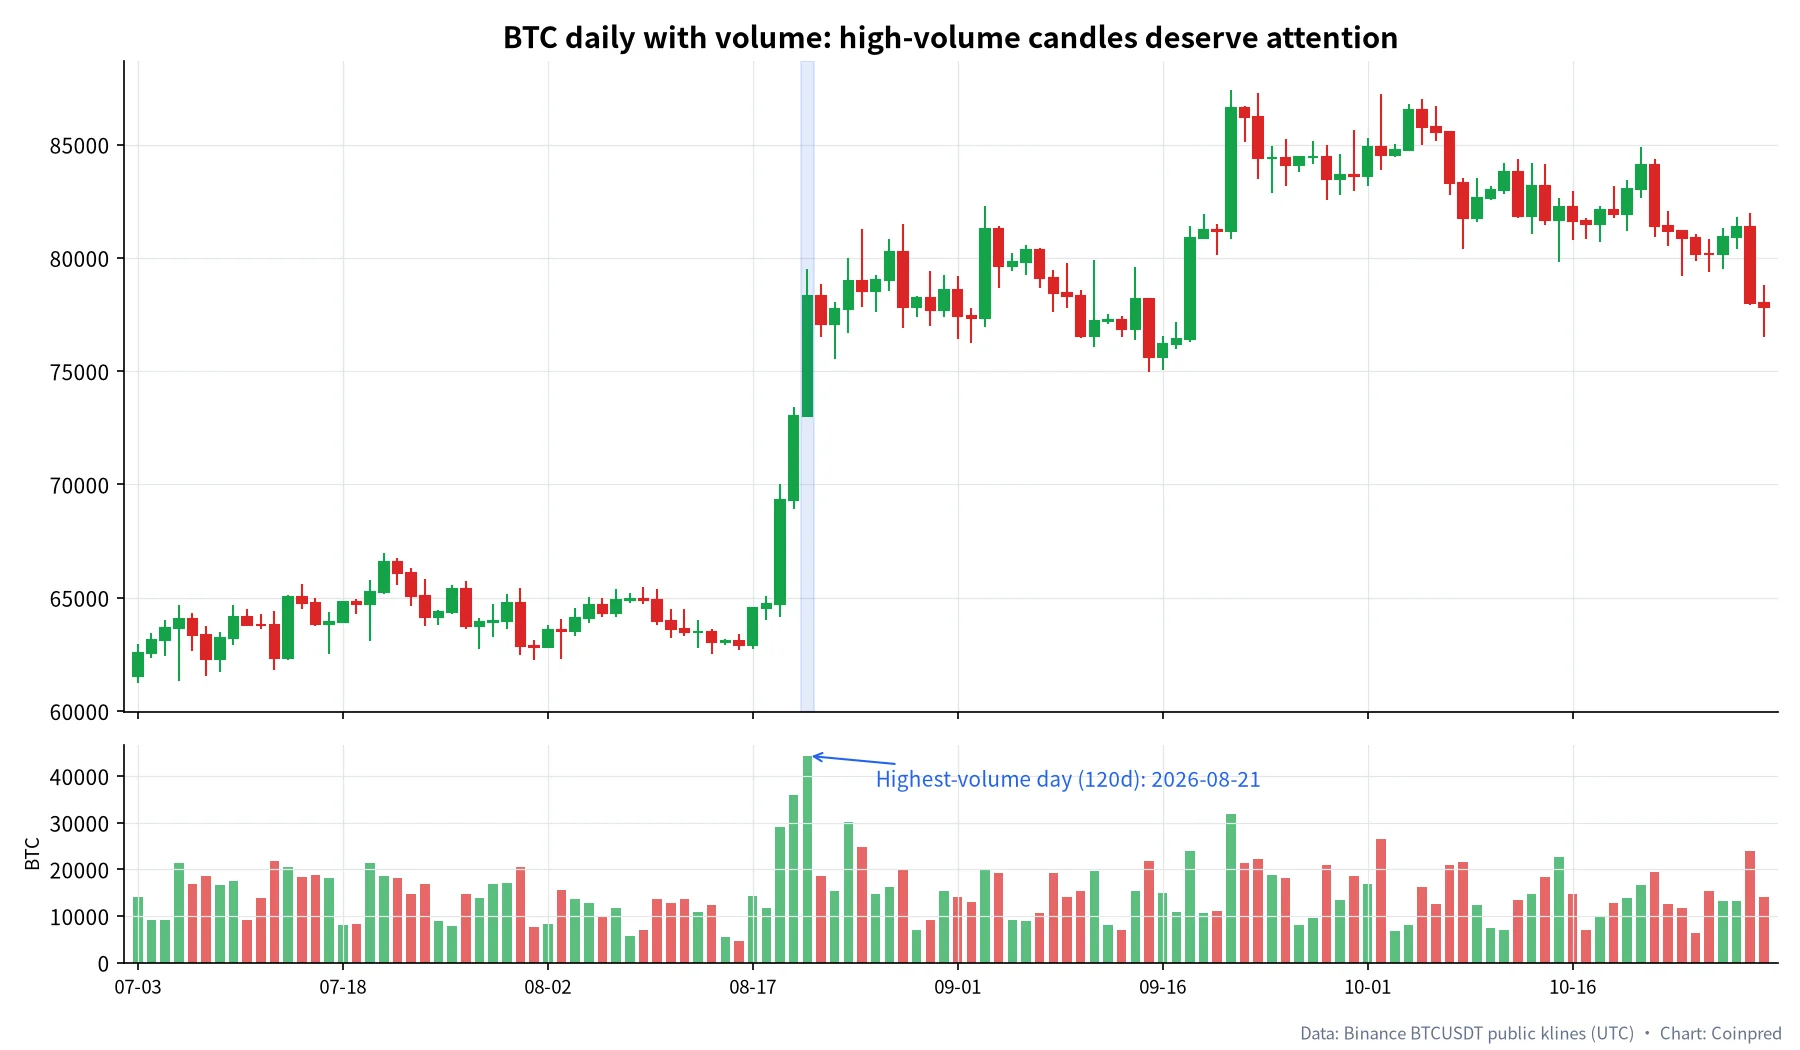 Figure 7: BTCUSDT daily with volume, Jul 3 – Oct 30, 2026. Data: Binance public klines (UTC); chart: Coinpred
In this chart, three consecutive high-volume green candles from August 19 to 21 carried price from about $64,700 to about $78,300 (Binance BTCUSDT daily closes). August 21 alone traded roughly 44,300 BTC — the busiest day in the 120-day window and about three times the period’s median daily volume of roughly 14,400 BTC. Price pulled back in the following months but never returned to the pre-breakout range. A high-volume breakout that holds is more convincing than any pattern name.
The reverse matters too: new highs on shrinking volume suggest the fuel behind the move may be running low.
Our five-step routine
Put everything together and you get the order we follow every time we open a chart:
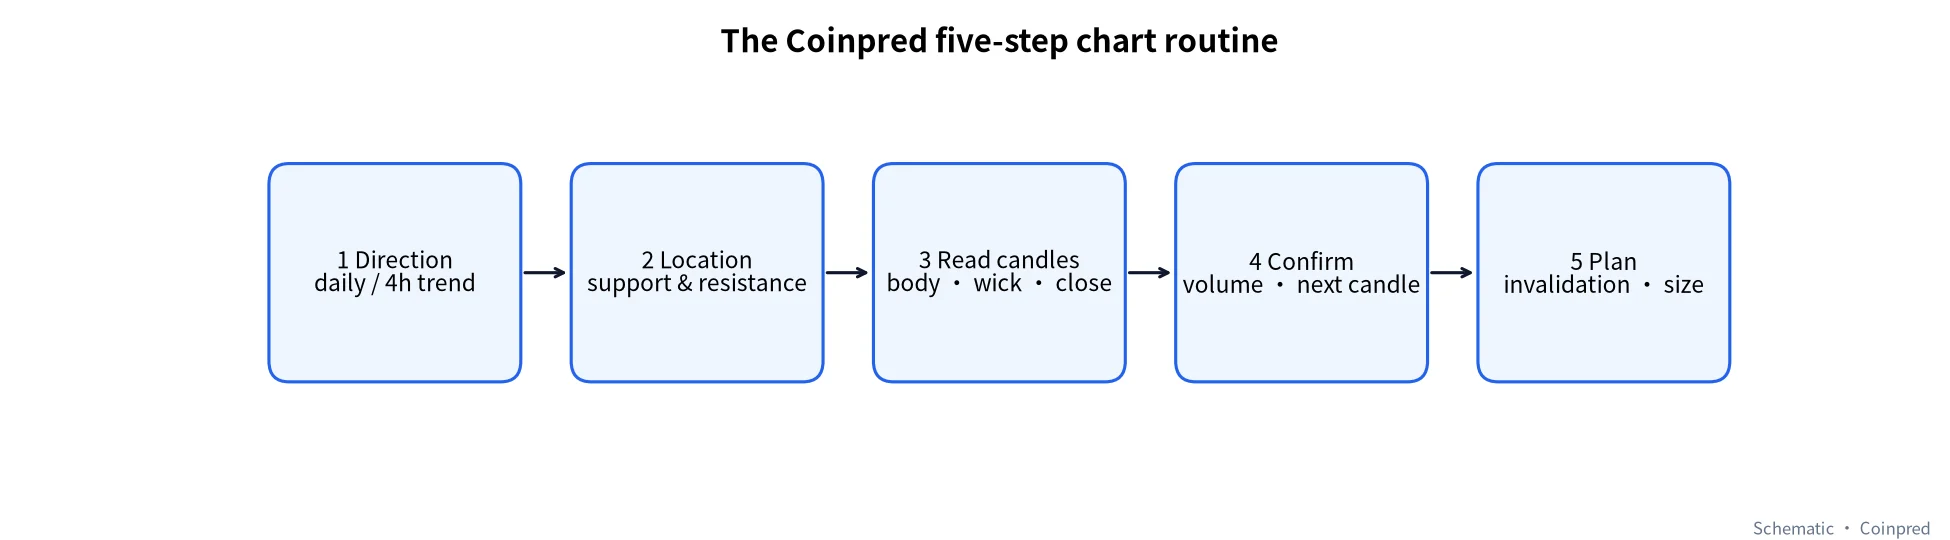 Figure 8: The five-step routine. Diagram: Coinpred
- Direction: on the daily and 4-hour, are recent highs and lows rising or falling?
- Location: mark the levels where price turned clearly in the recent past.
- Read candles: when price reaches those levels, how big are the bodies, how long the wicks, where are the closes?
- Confirm: does volume agree? Does the next candle close in the same direction?
- Plan: where would you be proven wrong, and how much can you afford to lose? Decide before you act.
| Check | Yes / No | Notes |
|---|---|---|
| I have checked the daily or 4-hour direction | ||
| Price is near a level I marked | ||
| The key candle has closed — it is not an intraday shape | ||
| Volume or the next candle confirms | ||
| I know my invalidation price and accept the loss |
If two or more answers are “no”, we usually wait. Missing a move almost always costs less than forcing a bad read.
Mistakes we see most often
- Judging a candle before it closes. An intraday “big green candle” can finish as a long upper wick.
- Living on small timeframes. A 1-minute “breakout” may not exist on the hourly.
- Treating patterns as signals. Buying every hammer and selling every shooting star ignores location and confirmation.
- Ignoring volume. Breakouts on thin volume fail more often.
- Getting shaken out by spikes. In a 24/7 market, brief wicks happen. Check the timeframe and location before reacting.
Practise on Coinpred
Reading about candles only goes so far; you learn by looking at charts again and again. The Coinpred terminal offers intervals from 1 minute to 1 day plus the JEV model’s direction and confidence. Try the five steps on your own first, then compare with the model and see where you disagree.
- New here? Read the Coinpred how-to guide
- Wondering how candle intervals differ from contract expiry? See BTC event contracts explained
- Want to understand confidence scores? See the JEV model
FAQ
1. Why are crypto candles green for up and red for down?
That is the default on most international platforms; many Chinese equity apps use the reverse. Most platforms let you switch. Pick one and stick with it, and always judge by whether the close is above or below the open.
2. Which timeframe should a beginner start with?
Start with the daily and 4-hour to find direction and key levels, then use the 1-hour for detail. The 1- and 5-minute charts are noisy; leave them until you are comfortable.
3. When does the crypto daily candle close?
Crypto trades 24/7, so there is no real close. The platform decides where to slice the day; many, including Binance, use 00:00 UTC. Check your own platform’s documentation.
4. Does a long lower wick mean price will go up?
Not necessarily. It only shows that part of a drop was bought back. It matters most near important support and when the next candle closes higher; mid-range it is mostly noise.
5. How accurate are candlestick patterns?
There is no universal accuracy figure. Performance depends heavily on market conditions, timeframe, location and volume. Treat patterns as clues that need confirmation, not as buy or sell signals.
6. Can I make trading decisions from candles alone?
Candles are a foundation, but combine them with trend, key levels and volume, and decide your invalidation point and acceptable loss before acting. No chart-reading method guarantees an outcome.
7. What is a wick spike and how should I handle it?
A spike is a very fast move away from the range and back, leaving a long wick. It is more common when liquidity is thin. Step up to a higher timeframe to see whether it changed the structure before reacting.
Sources
- Coinbase Learn: How to read candlestick charts
- Binance Academy: A Beginner’s Guide to Candlestick Charts
- MoonPay Learn: How to read candlestick charts for crypto
- Market data: Binance Spot public kline endpoint (BTCUSDT), retrieved and charted by Coinpred on October 30, 2026
This article is educational only and is not investment advice.