On coinpred.com this is the eighteenth piece in our indicator tutorial series. We are the Coinpred editorial team — the same group that maintains the guides and the author page. The companion ADX tutorial asked how strong a trend is. Moving averages ask where the close sits relative to an average. Ichimoku Kinko Hyo — the “equilibrium chart,” usually just called the cloud — stacks several related questions onto a single pane: midpoints of recent highs and lows, a zone plotted 26 sessions ahead, and today’s close plotted 26 sessions back.
It looks busy, which is why it is so often reduced to “green cloud, long; red cloud, short.” The time is better spent on three more concrete questions: is the close above, inside, or below the cloud; where do the Tenkan and Kijun cross; and is the colour you are looking at today actually a calculation from 26 sessions earlier?
Every figure below is computed from Binance’s public BTCUSDT daily klines, in UTC. The settings are the common (9, 26, 52) with the cloud displaced 26 sessions forward. The main window is 2026-07-01 through 2026-11-19. 20 November was still trading when we drafted this, so that unfinished session is not treated as a complete day. The extra cloud drawn to the right of the last candle is projected from already completed dates; it does not use the open 20 November bar. You can recompute the same series. This is a reading guide, not a trading system, and it is not investment advice.
1. What the five lines are actually measuring
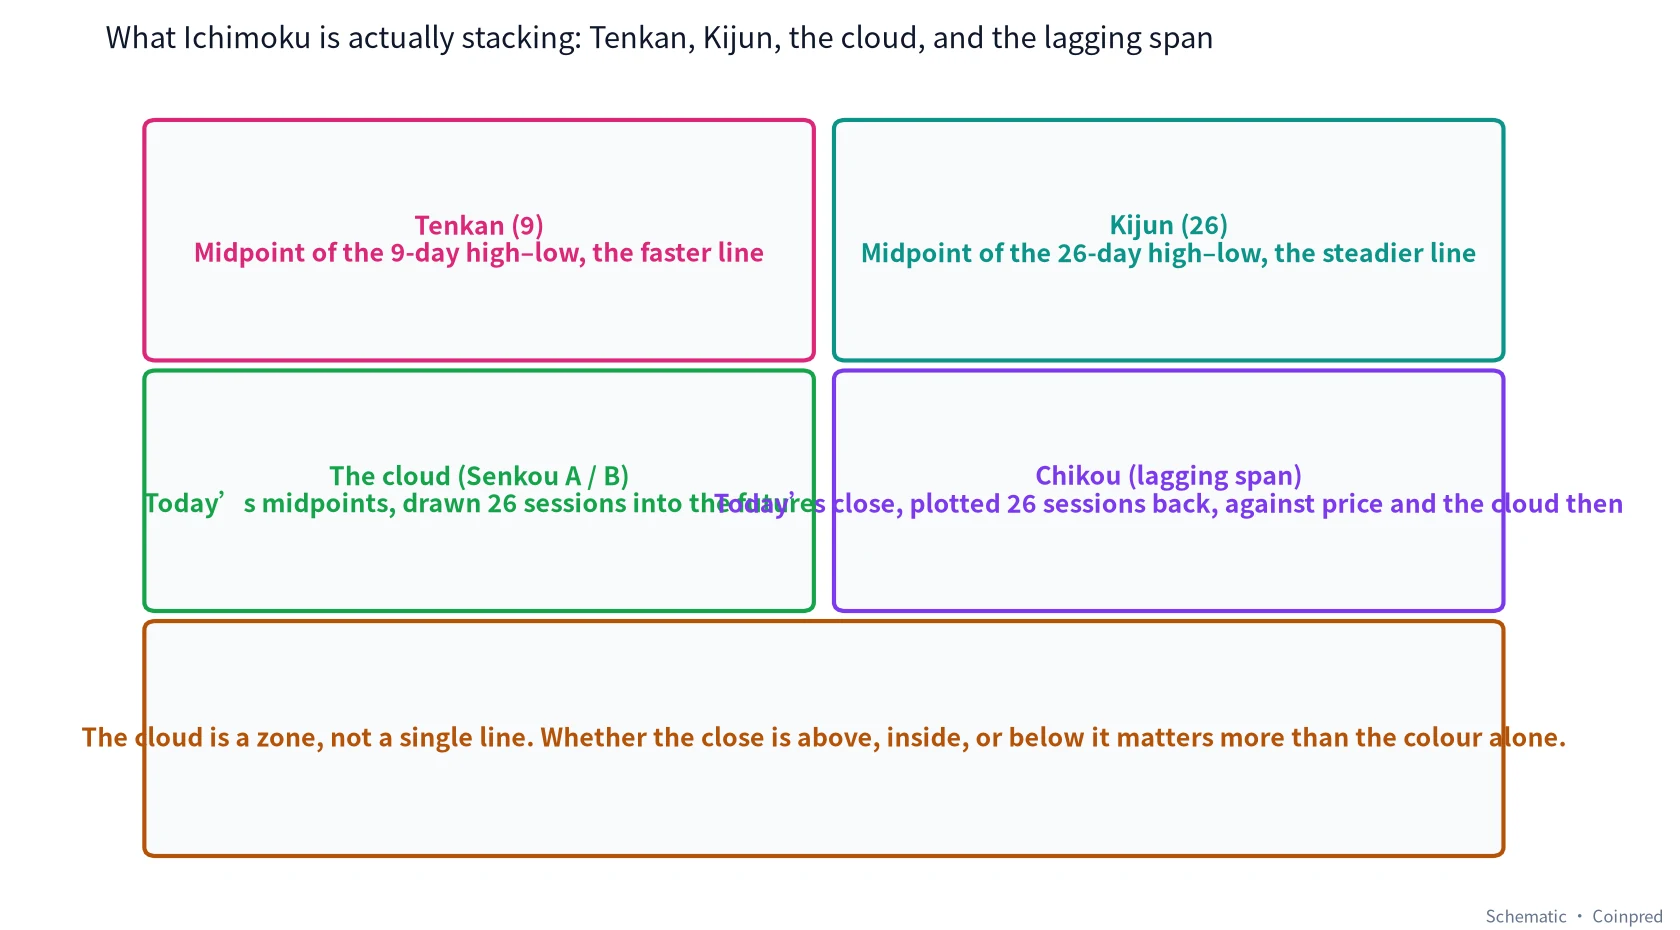
This is not a moving-average stack with extra paint. Tenkan and Kijun are midpoints of a high–low range, not averages of closes:
- Tenkan-sen (conversion line, 9) = (9-day high + 9-day low) ÷ 2
- Kijun-sen (base line, 26) = (26-day high + 26-day low) ÷ 2
- Senkou Span A = (Tenkan + Kijun) ÷ 2, plotted 26 sessions forward
- Senkou Span B = (52-day high + 52-day low) ÷ 2, also plotted 26 sessions forward
- Chikou Span (lagging span) = today’s close, plotted 26 sessions back, against the candles and the cloud that were there then
The zone between Span A and Span B is the cloud. When A is above B we colour that zone green; when A is below B we colour it red. The colour only describes the relationship between the two leading spans. It is not a long or short instruction. Because both spans are shifted forward 26 sessions, the colour sitting in front of price on any given day comes from a calculation made 26 sessions earlier, not from today’s candle “painting” the cloud.
A worked example from 19 August 2026. The session high was 70,000.00, the close 69,334.79. In the nine sessions from 11 August through 19 August, the highest high was that 70,000.00 and the lowest low was 62,535.24 on 14 August:
Tenkan = (70,000.00 + 62,535.24) ÷ 2 = 66,267.62
In the 26 sessions from 25 July through 19 August, the high was still 70,000.00 and the low was 62,275.00 on 1 August:
Kijun = (70,000.00 + 62,275.00) ÷ 2 = 66,137.50
Tenkan recaptured Kijun that day, by only about 130 dollars. The cloud you actually see on the 19 August chart, though, was not drawn from those two numbers. It comes from the leading spans already computed 26 sessions earlier, on 24 July: Span A near 63,562.51, Span B near 62,658.10. Because A was already above B in that earlier calculation, the cloud in front of price flipped from red to green on 19 August. The day’s rally decided where the close, the Tenkan and the Kijun sat. The colour flip had been written into the chart 26 sessions earlier. You can stack those facts on the same session. You should not say “the cloud turned green because price rallied today.”
2. The July–November picture, in one chart
Here is BTC’s daily candle from 1 July through 19 November 2026, with Tenkan, Kijun, the cloud and Chikou. To the right of the dashed line is the 26-session projection of a cloud that has already been calculated, for dates that have not yet closed:
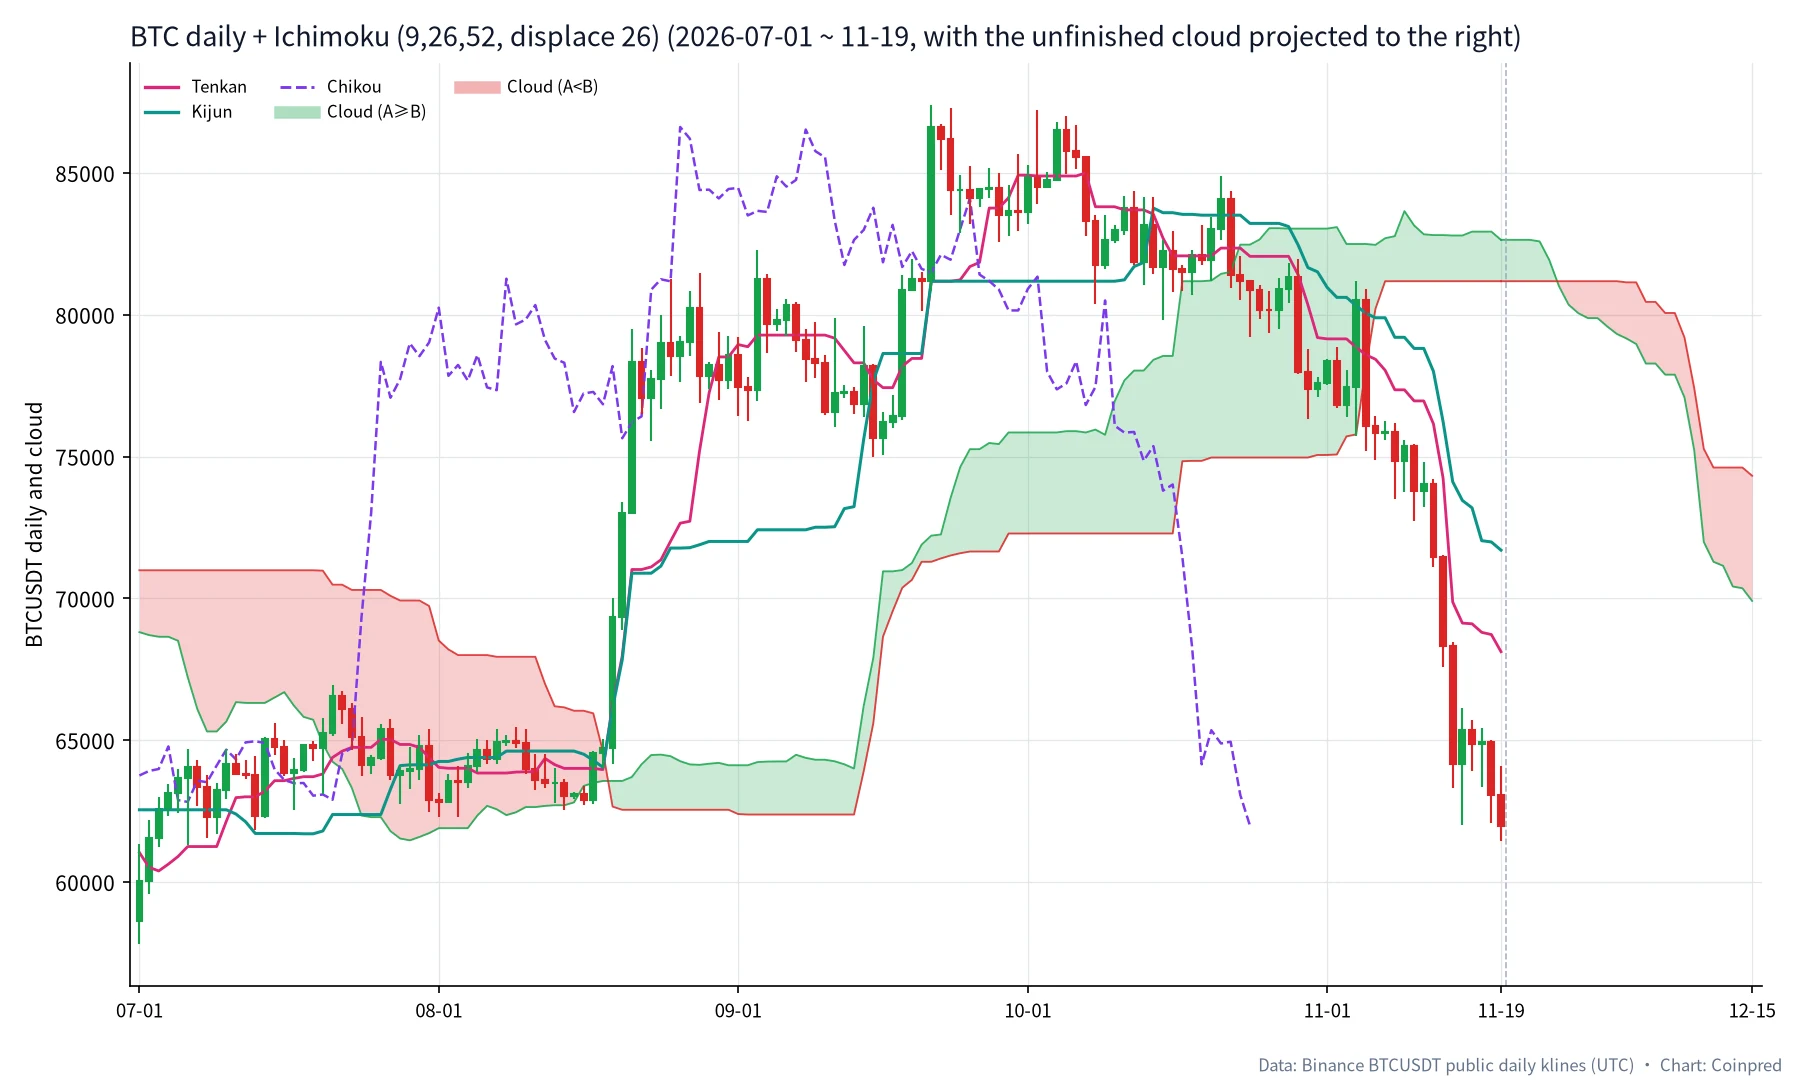
On 1 July the close was 60,024.00, underneath a red cloud whose top was near 70,990 and whose bottom was near 68,808. For a little more than a month after that, price ran below the cloud, stepped inside it on 20 July, and then spent mid-August rubbing along the lower edge. The location actually changed on 18–19 August: the close first edged above the cloud, then Tenkan crossed above Kijun, and the cloud in view flipped green. Price then stayed above the cloud into late October. On 22 October the close fell back inside the cloud; on 5 November it closed below it. By 19 November the close was 61,986.73, about 19,000 dollars under the cloud bottom at 81,181.82 — and the cloud still sitting in front of price was green. Look to the right, and the projected cloud has already turned red and rolled lower. That lag in colour is the part of this window worth lingering on.
The cloud is a zone, not a single line. Like support and resistance, it is more useful as a band than as a precise trigger price. A moving average asks where the average sits. The cloud asks whether a high–low mid-range computed 26 sessions earlier still contains the close.
3. Mid-to-late August: the close leaves the cloud, Tenkan crosses up, the cloud flips green
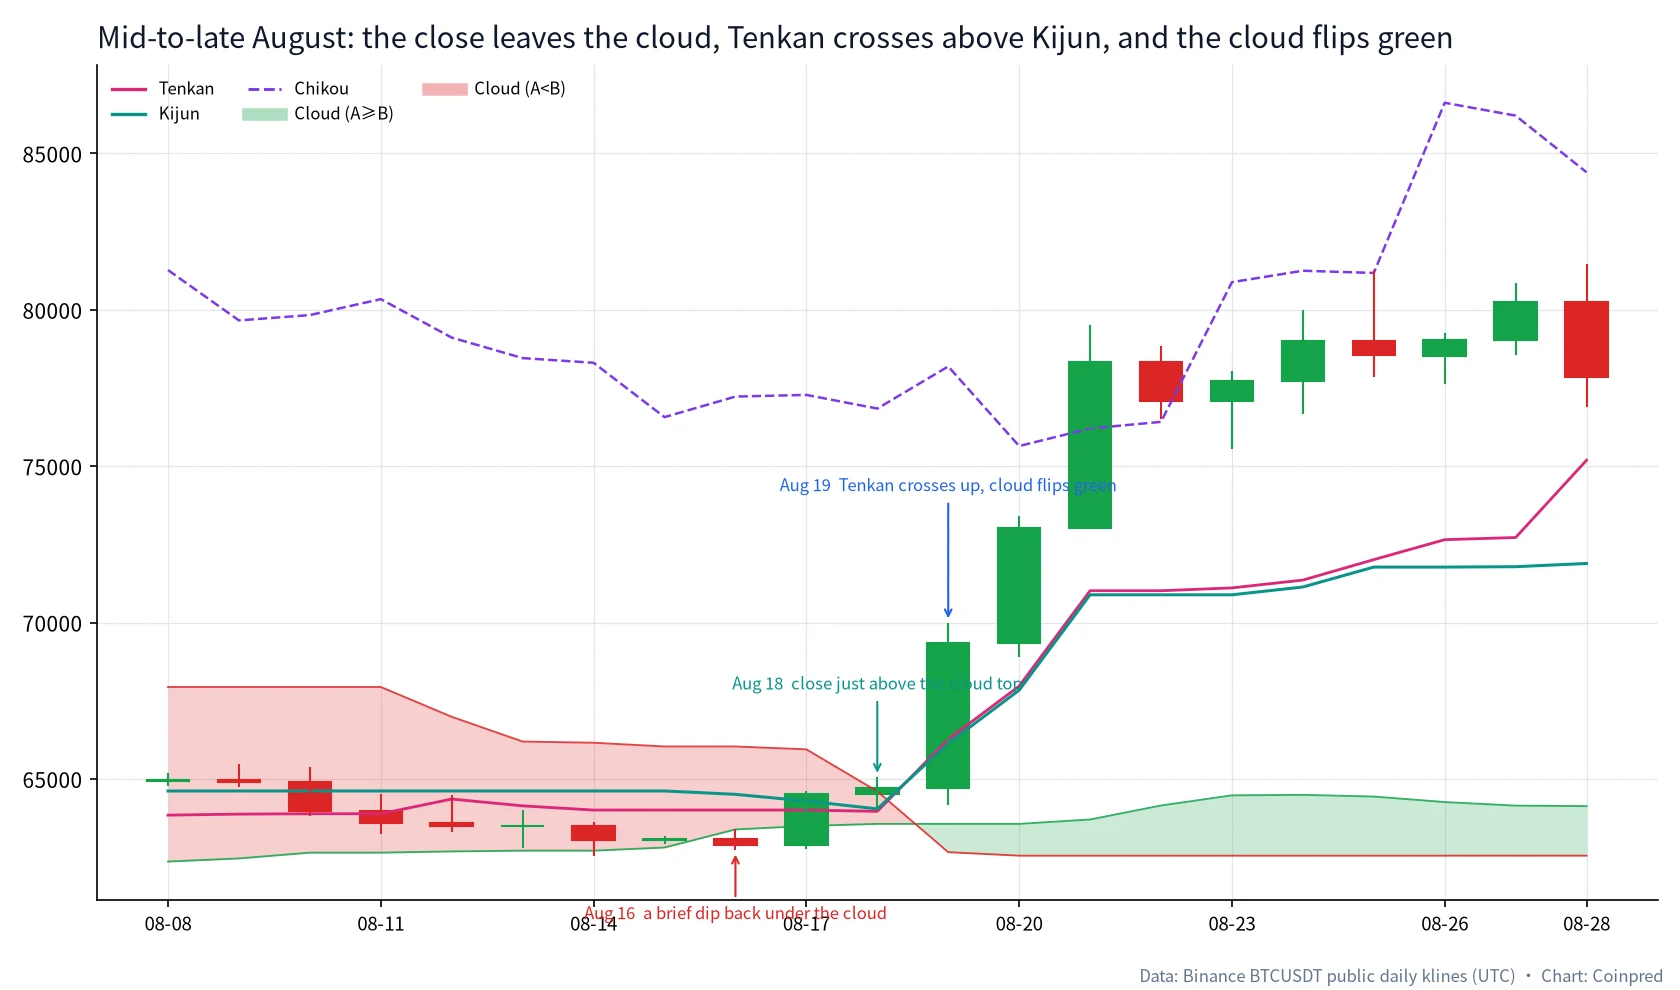
By mid-August the daily range had gone quiet — the same stretch we already measured from the Bollinger, ATR and ADX sides. On the Ichimoku pane, price was still rubbing along the lower edge of the cloud.
| Date (UTC) | Open | High | Low | Close | Change | Tenkan | Kijun | Cloud top | Cloud bot | Position |
|---|---|---|---|---|---|---|---|---|---|---|
| 08-15 | 63,043.56 | 63,187.98 | 62,920.00 | 63,086.01 | +0.07% | 64,004.85 | 64,615.57 | 66,037.93 | 62,805.79 | Inside the cloud |
| 08-16 | 63,086.01 | 63,390.00 | 62,716.00 | 62,900.00 | −0.29% | 64,004.85 | 64,507.44 | 66,037.93 | 63,384.36 | Briefly back below |
| 08-17 | 62,900.00 | 64,610.01 | 62,751.10 | 64,532.10 | +2.59% | 64,004.85 | 64,294.07 | 65,946.10 | 63,496.17 | Back inside |
| 08-18 | 64,532.11 | 65,058.81 | 64,027.85 | 64,725.42 | +0.30% | 63,963.19 | 64,041.79 | 64,604.54 | 63,562.51 | Just above the top |
| 08-19 | 64,725.42 | 70,000.00 | 64,166.00 | 69,334.79 | +7.12% | 66,267.62 | 66,137.50 | 63,562.51 | 62,658.10 | Above; TK cross; cloud flips green |
| 08-21 | 73,027.02 | 79,500.00 | 73,027.02 | 78,338.03 | +7.28% | 71,017.62 | 70,887.50 | 63,703.12 | 62,546.17 | Well clear of the cloud |
On 16 August the close of 62,900.00 slipped under the then-bottom of 63,384.36 — a short dip back below the cloud. 17 August moved back inside. On 18 August the close of 64,725.42 finished only about 121 dollars above the cloud top of 64,604.54. The first day above the cloud was a close that almost sat on the edge. It took the +7.12% session on 19 August to leave that seam.
The Tenkan–Kijun cross also happened on 19 August. The two lines were close (66,267.62 vs 66,137.50); one did not travel from a long way away. The same day, the cloud in view flipped from red to green, for the reason already given: that was the 24 July calculation arriving on the chart. Three things stacked on one daily candle, so the picture looks unusually “aligned.” They are not three outputs of a single formula.
Chikou adds a fourth check. The 19 August close of 69,334.79 is plotted back at 24 July, whose high was 65,808.59, whose close was 64,139.99, and whose cloud top was still near 70,297. So the lagging span had already cleared the high and the close from 26 sessions earlier, but had not yet cleared the cloud that was in place then. By 21 August, the close of 78,338.03 plotted back was clearly above that older cloud. If “all four conditions” is treated as a same-day checklist, 19 August was still missing the Chikou-versus-cloud step.
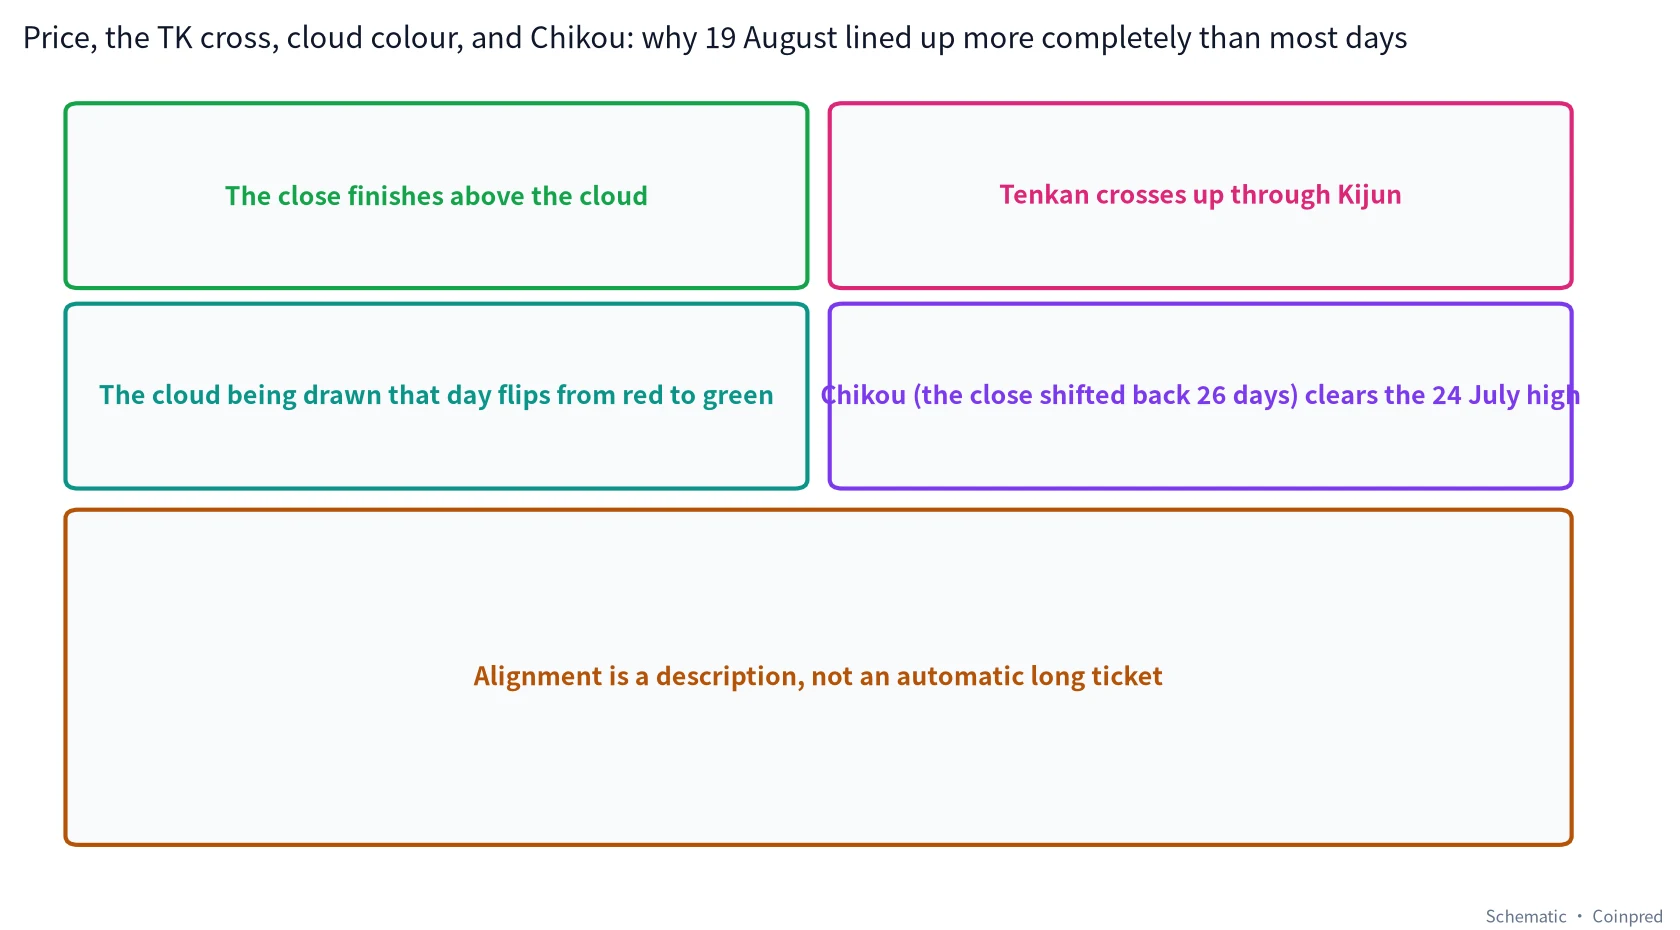
We would not have taken that alignment as a standalone long even in hindsight. The close was also leaving the quiet mid-August shelf, and volume and ATR were changing at the same time — that is the structure layer. Ichimoku’s job on the desk is to lay “leave the cloud, the TK cross, cloud colour, and the lagging-span check” next to each other, so you can see whether they are meeting in the same stretch. Alignment is a description, not an automatic long ticket.
4. Mid-September: Tenkan crosses down, but the close stays above the cloud
Running above the cloud does not mean Tenkan and Kijun are forbidden to cross. Mid-September splits those two facts apart.
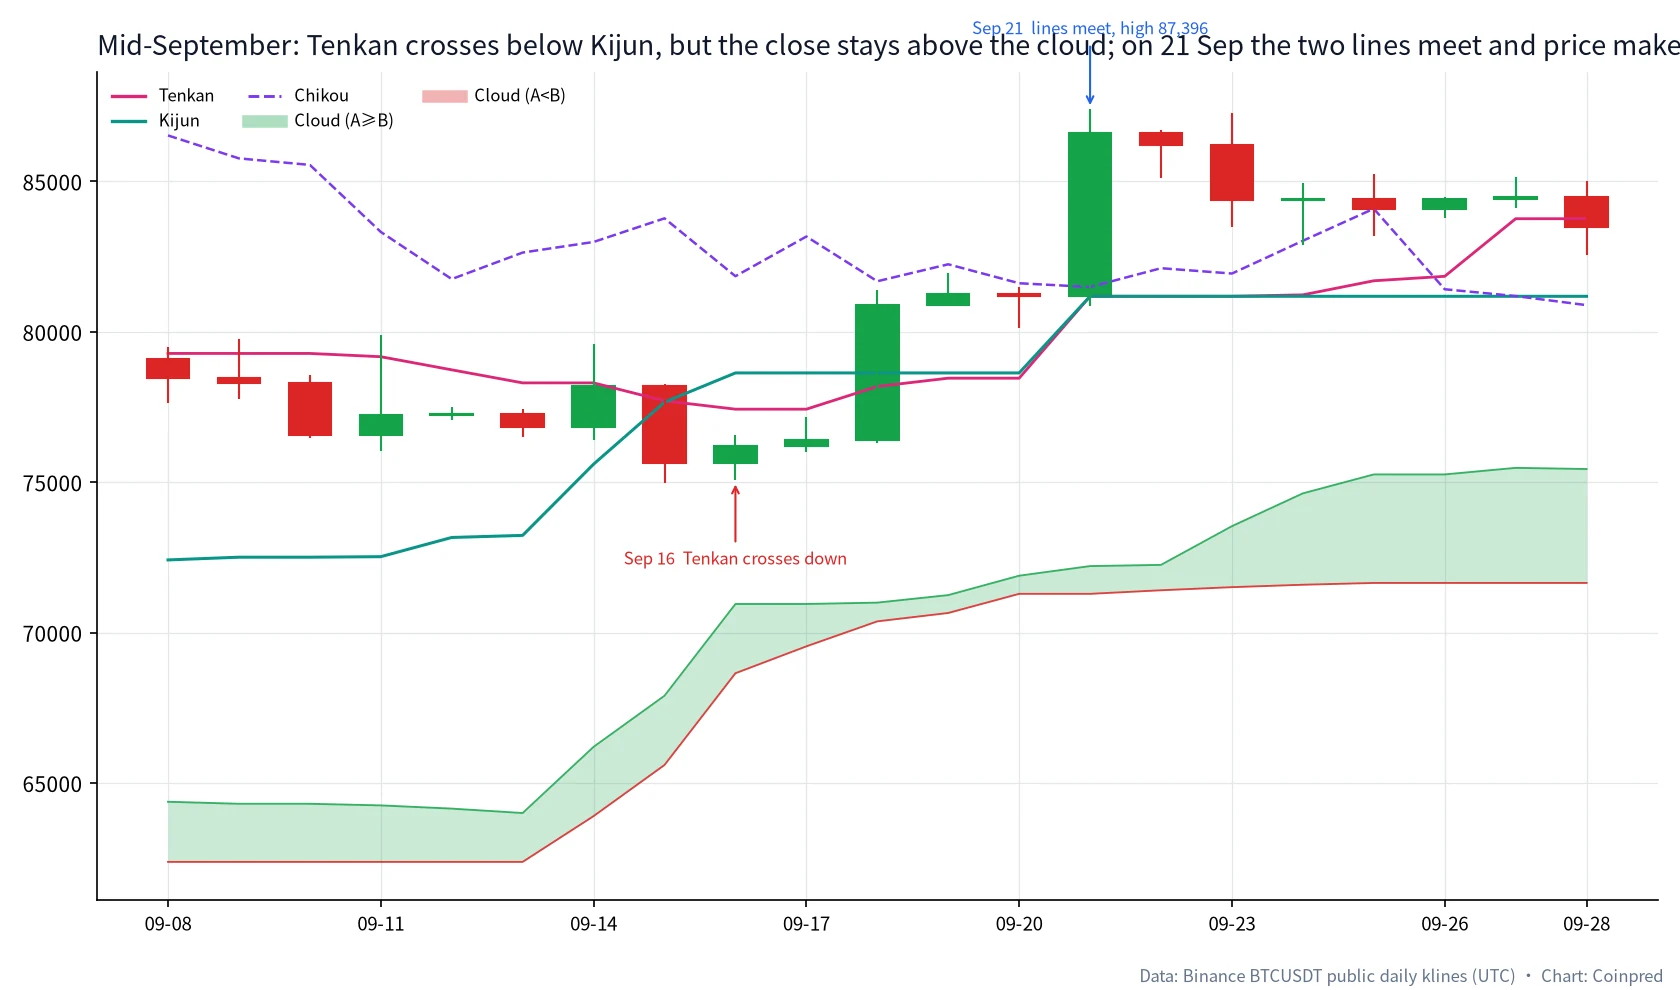
On 16 September, Tenkan fell under Kijun: 77,428.99 against 78,633.99. The close was 76,206.01, still above the cloud — the top was near 70,952.56, the bottom near 68,650.10. The cross happened; the location did not change from “above the cloud.” Tenkan then spent the next few sessions under Kijun, and the close still rallied 5.85% on 18 September, to 80,883.87.
21 September is the unusual day. The session high was 87,395.67, the close 86,620.00, up 6.70%. Tenkan and Kijun met at the same number: 81,181.82. That is not a typo. The 9-day window and the 26-day window used the same high and the same low that day — the high was the session’s 87,395.67, the low was 74,967.97 from 15 September. The two lines went flat, and price printed the highest high of the whole window. If “Tenkan has crossed below Kijun” is allowed to mean the trend is over, you would have been leaning against the window high.
| Date (UTC) | Open | High | Low | Close | Change | Tenkan | Kijun | Cloud top | Cloud bot | Position |
|---|---|---|---|---|---|---|---|---|---|---|
| 09-16 | 75,644.48 | 76,560.76 | 75,064.82 | 76,206.01 | +0.74% | 77,428.99 | 78,633.99 | 70,952.56 | 68,650.10 | Above; Tenkan crosses down |
| 09-18 | 76,417.01 | 81,400.00 | 76,296.00 | 80,883.87 | +5.85% | 78,183.99 | 78,633.99 | 70,997.75 | 70,374.43 | Still above the cloud |
| 09-21 | 81,178.01 | 87,395.67 | 80,850.22 | 86,620.00 | +6.70% | 81,181.82 | 81,181.82 | 72,212.02 | 71,289.73 | Lines meet; window high |
The companion ADX note is useful on the same stretch: ADX had already peaked on 7 September, and price still made a new high on the 21st. A TK cross down, and a rollover in strength, can both mean “less one-sided than it was.” Neither is an automatic top ticket.
5. Mid-to-late October: Tenkan crosses down again, and the close falls back inside the cloud
In the second half of autumn the location itself started to give. After this next cross, the close did not stay above the cloud.
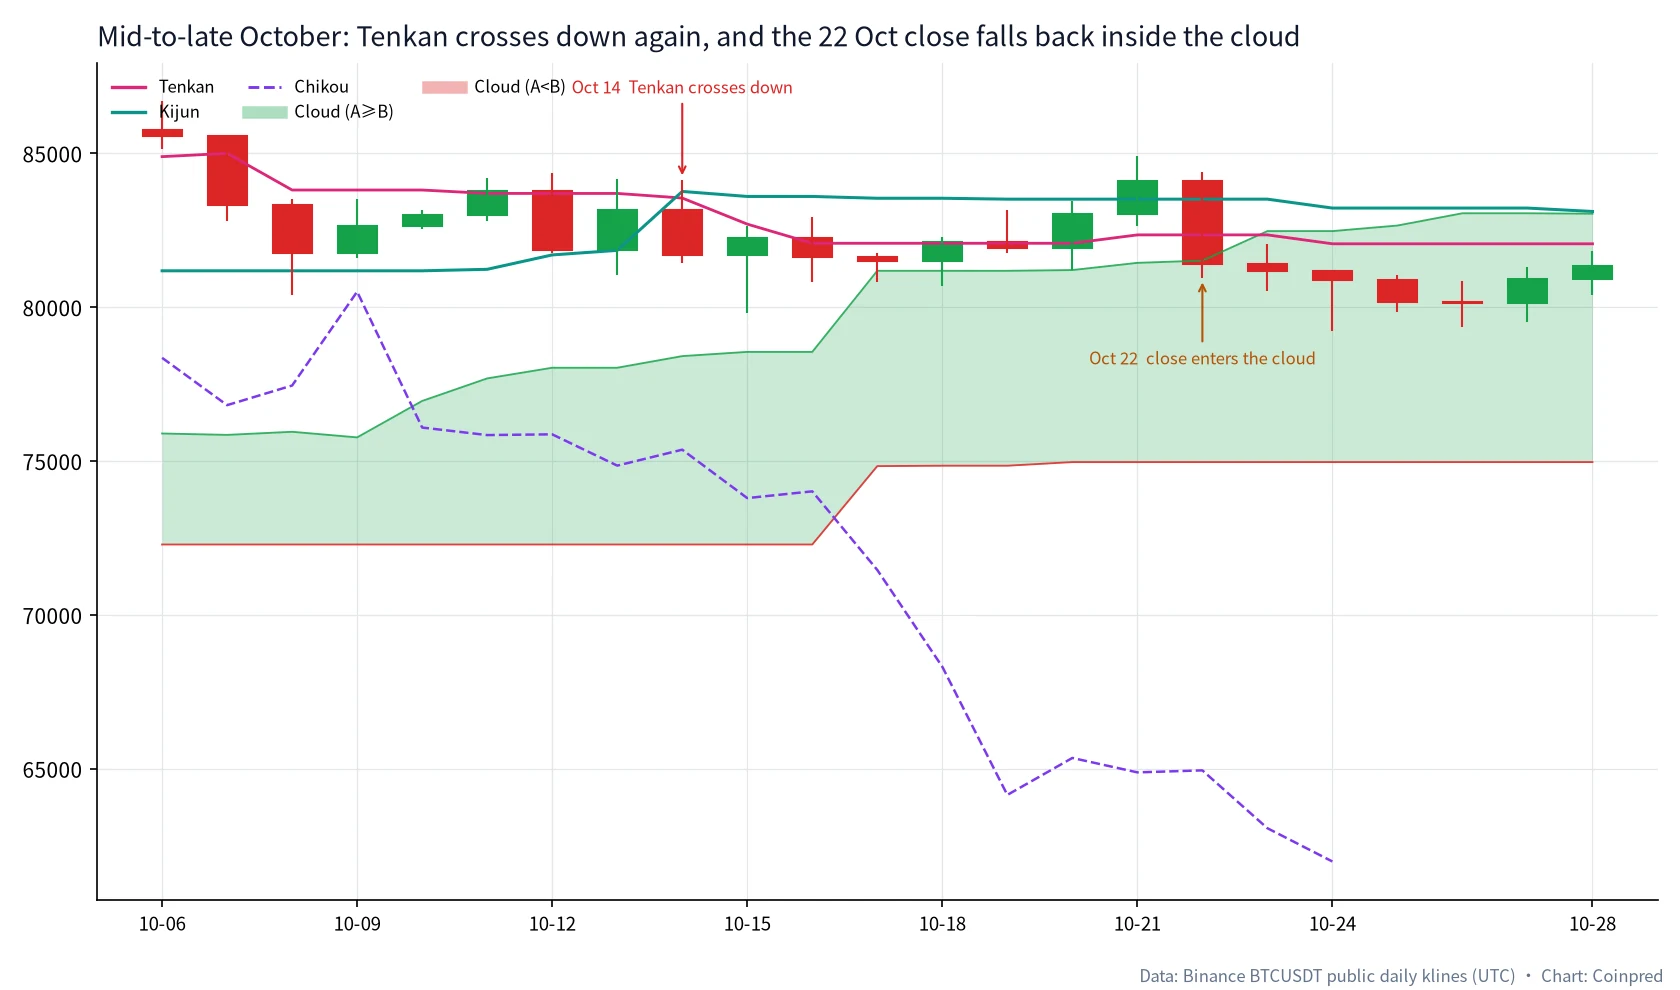
On 14 October, Tenkan crossed below Kijun again: 83,546.27 against 83,760.85. The close was 81,682.01, still above the cloud, whose top was near 78,408.99 and whose bottom was near 72,287.50. As on 16 September, the first thing you see is a change in the two midpoints, not yet a change in location.
The location changed on 22 October. The session fell 3.18% and closed at 81,416.09, against a cloud top of 81,513.83. The close was only about 98 dollars under that top — almost the mirror image of 18 August, when price had edged out above the cloud by about 121 dollars. From that session through 4 November, the close then walked inside the cloud. It did not fall through the bottom immediately.
| Date (UTC) | Open | High | Low | Close | Change | Tenkan | Kijun | Cloud top | Cloud bot | Position |
|---|---|---|---|---|---|---|---|---|---|---|
| 10-14 | 83,169.01 | 84,146.72 | 81,444.42 | 81,682.01 | −1.79% | 83,546.27 | 83,760.85 | 78,408.99 | 72,287.50 | Above; Tenkan crosses down |
| 10-21 | 83,028.14 | 84,898.00 | 82,635.32 | 84,093.42 | +1.28% | 82,349.00 | 83,510.00 | 81,439.83 | 74,965.46 | Still above the cloud |
| 10-22 | 84,093.42 | 84,377.21 | 80,939.54 | 81,416.09 | −3.18% | 82,349.00 | 83,510.00 | 81,513.83 | 74,965.46 | Close enters the cloud |
Entering the cloud is not the end of a trend, and it is not a promise that price will fall through the bottom next. It only says that a zone computed 26 sessions earlier has wrapped around the close again. The next question is whether the close climbs back out through the top, or leaves through the bottom.
6. November: the close is already under the cloud, yet the cloud in view is still green
This is the easiest stretch in the sample to misread. If colour is allowed to mean “the current bias,” November will keep you inside a cloud that price has already left.
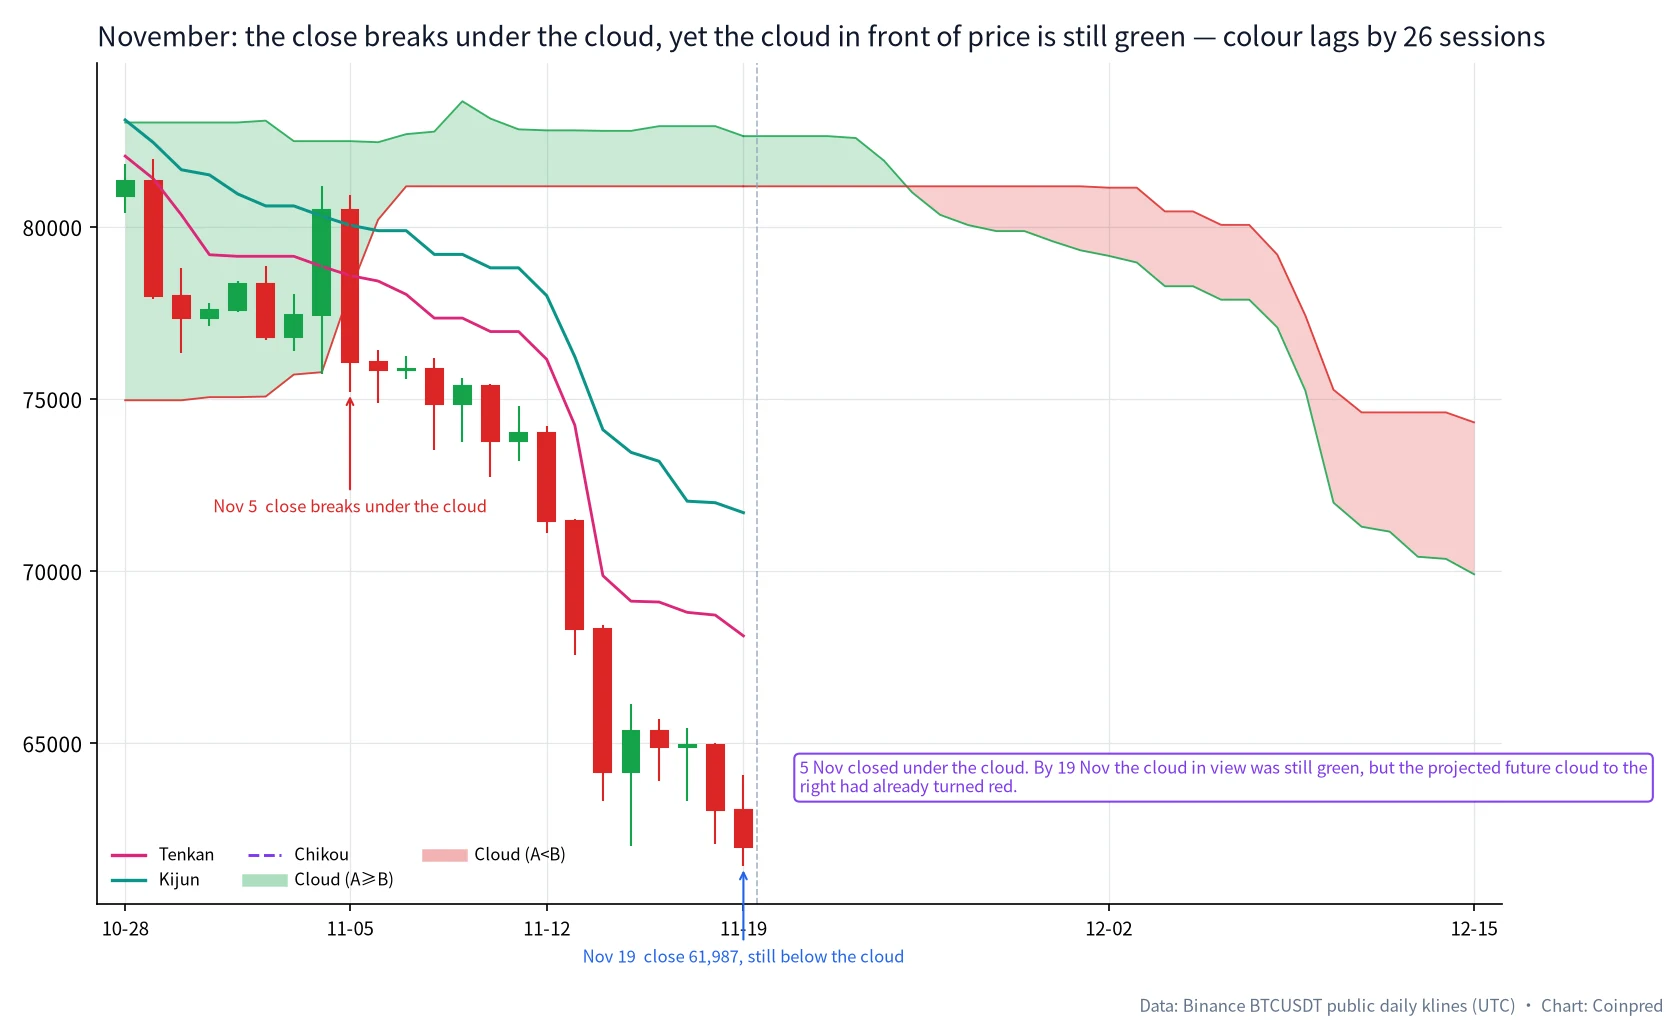
On 4 November the close was still inside the cloud, at 80,504.01, with the then-bottom at 75,780.83. On 5 November the session fell 5.49% and closed at 76,088.01, already under the cloud bottom of 78,148.95 — a gap of about 2,061 dollars. Tenkan at 78,589.71 was still under Kijun at 80,053.21. The more important fact is the colour: the cloud in front of price was still green.
By 19 November the close was 61,986.73, Tenkan 68,119.85, Kijun 71,699.63, the cloud top 82,639.87 and the bottom 81,181.82. The close was about 19,200 dollars under that bottom. The colour? Still green. Span B spent a long time sitting on 81,181.82, because the 52-day window was still using the 21 September high of 87,395.67 and the 15 September low of 74,967.97. Leading Span B goes flat when that pair is not replaced. The colour will not flip just because price has already fallen to 62,000.
Look to the right, and the projected cloud has already turned red and is sloping lower. When did that flip enter the calculation? On 30 October, computed Span A (about 81,007.07) had already slipped under Span B (81,181.82). That pair is what gets drawn on 25 November. The future cloud computed on 19 November itself is lower still: Span A near 69,909.74, Span B near 74,324.13, plotted at 15 December. If, in mid-to-late November, you only watch the still-green patch directly above price, you will miss the red cloud that has already been calculated and has simply not arrived in front of the candles yet.
Chikou makes the same point with a backward glance. The 19 November close of 61,986.73 is plotted back at 24 October, which closed at 80,888.16, with a high of 81,213.64 and a cloud bottom near 74,965.46. The lagging span was simultaneously below the close, the low and the cloud from 26 sessions earlier. On 5 November, when the close first broke under the cloud, Chikou was being compared with 10 October (close 82,988.36, cloud 72,287.50–76,952.20): already below that older price, but still inside that older cloud. Leaving the current cloud, and taking Chikou under the old cloud, did not happen on the same day.
| Date (UTC) | Open | High | Low | Close | Change | Tenkan | Kijun | Cloud top | Cloud bot | Position |
|---|---|---|---|---|---|---|---|---|---|---|
| 11-04 | 77,453.85 | 81,196.01 | 75,736.38 | 80,504.01 | +3.94% | 78,853.69 | 80,317.19 | 82,494.30 | 75,780.83 | Still inside the cloud |
| 11-05 | 80,504.01 | 80,918.01 | 75,208.42 | 76,088.01 | −5.49% | 78,589.71 | 80,053.21 | 82,494.30 | 78,148.95 | Close breaks under the bottom |
| 11-14 | 68,314.01 | 68,446.21 | 63,320.00 | 64,150.00 | −6.10% | 69,868.12 | 74,109.00 | 82,793.00 | 81,181.82 | Far below; cloud in view still green |
| 11-19 | 63,068.21 | 64,080.80 | 61,428.26 | 61,986.73 | −1.71% | 68,119.85 | 71,699.63 | 82,639.87 | 81,181.82 | Still below; cloud in view still green |
If you want a single sentence: read which side of the cloud the close is on, then read the projected cloud to the right, and do not let the colour of the patch in front of price make the decision by itself.
7. A five-step reading habit
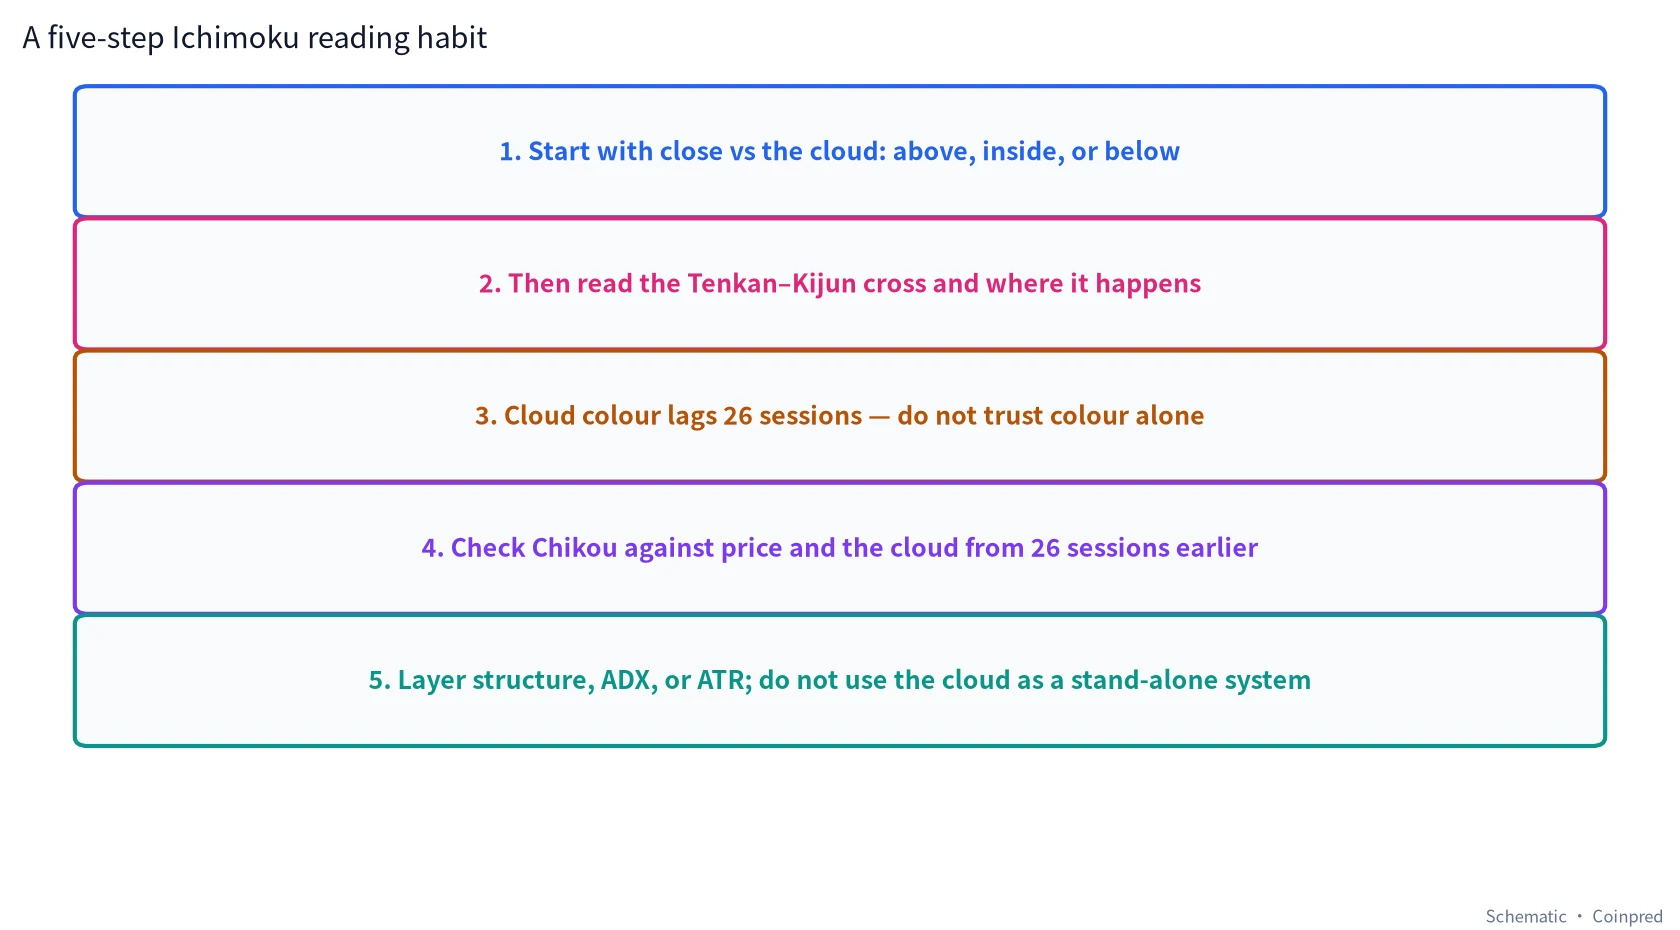
When we sit down with the daily chart, we usually follow this order, rather than hunting for a colour flip or a “golden cross” first:
- Start with the close versus the cloud: above, inside, or below. The cloud is a zone. 18 August leaving along the top, and 22 October returning along the top, both show that the edge can be tight even as the location has already changed.
- Then read the Tenkan–Kijun cross, and where price was when it happened. 11 July also had a Tenkan cross up, but the close was still below the cloud. The 19 August cross happened above it. The 16 September cross down happened above it as well, and price later made a new high. A cross has to be read with its location.
- Cloud colour lags by 26 sessions — do not trust colour alone. In November the close was already a long way under the cloud, and the patch in view was still green. Read it together with the projected cloud to the right, which has already been calculated.
- Check Chikou against the price and the cloud from 26 sessions earlier. It does not forecast. It only asks whether today’s close, placed on the chart from 26 sessions ago, is above that older structure or has fallen through it.
- Layer structure, ADX, or ATR; do not use the cloud as a stand-alone system. ADX tells you how strong the push is. ATR tells you how wide a day is. Support and resistance tell you where you are. The cloud replaces none of those.
If you only keep one sentence: ask which side of the cloud the close is on, then where the two midpoints crossed, and only then explain why the cloud in front of you is the colour it is.
8. What we will not do with Ichimoku
- Go long on a green cloud, or short on a red one, without asking whether the close is above or below that cloud.
- Treat every Tenkan–Kijun cross as an order ticket, especially the ones that fire inside the cloud or disagree with the close’s location.
- Treat the 19 August stack — several conditions landing on one day — as a checklist that must be completed every session thereafter.
- Forget the 26-session displacement, and explain today’s rally or selloff as the reason “the cloud changed colour today.”
- Change (9, 26, 52) to some other set until the picture “agrees” with a trade already wanted.
- Port a 15-minute leave of the cloud onto the daily close.
- Use Ichimoku as a stand-alone system. You can write rules if you want; you then have to define what happens after a break under the cloud, which stretch of cloud you trust when colour lags, and what the trade costs. We are not doing that here.
FAQ
What Ichimoku settings do you use on BTC daily, and should I switch to (7, 22, 44)?
We used (9, 26, 52) with a 26-session displacement throughout. That is the default most charting packages actually open with, and it keeps the numbers in this article checkable. A shorter conversion line will twitch more; the cloud will be thinner and will change colour faster. A longer set will make the August leave of the cloud look even slower. None of those choices is “the correct Ichimoku for Bitcoin.” Pick one, write it down, and do not retune it mid-review so that November’s still-green cloud turns red sooner.
Is a Tenkan cross above Kijun a buy signal on BTC?
No. Not in our work. 19 August was a useful recapture because the close was also leaving the cloud, and leaving the quiet mid-August shelf. 11 July was also an upside cross, with the close still under the cloud. 21 September saw the two lines meet, and price made the window high that day, but that was not a fresh upside cross “giving a signal.” A cross is a change in the relationship between two midpoint lines. It does not know your inventory and it does not owe you a trend.
What do you do after price breaks under the cloud?
We rename the event. It is no longer “the green cloud failed, so short.” It is “the close has left a zone that was computed 26 sessions earlier.” We ask whether it was a wick that came back, or a close that finished clearly under the bottom, as 5 November did, and whether later sessions recaptured the cloud. After 5 November, the close did not return inside. At the same time, we do not let the still-green patch in front of price hold us in place — we read the already-calculated future cloud to the right as well.
Why was the cloud still green in November after such a large decline?
Because the colour you see in front of price comes from a calculation made 26 sessions earlier. Leading Span B also sat on 81,181.82 for a long stretch, and it will not move much while the same 52-day high and low are still in the window. The bearish twist first appeared in the 30 October calculation, and only arrives on the chart on 25 November. That is how the system is built, not a broken indicator.
How should I read Chikou? Is it just the close again?
Chikou is today’s close, only plotted 26 sessions back. Its use is not to give you a second price. It is to drop today’s close onto the candles and the cloud from 26 sessions earlier. On 19 August it had already cleared the 24 July high, but was still inside that older cloud; on 21 August it was clearly above that cloud. November is the other side of the same check: once the close is carried back, it is already under the low and the cloud from 26 sessions earlier. It is a comparison, not a forecast.
How do you read Ichimoku next to ordinary moving averages, or next to ADX?
Tenkan and Kijun are midpoints of highs and lows, not averages of closes, so do not try to reconcile their values with a moving average. ADX answers how strong the push is; the cloud answers how the close sits against a zone that was shifted forward. Late August is a stretch where the two talk at once: ADX is rising, and the close is holding above a green cloud. Mid-to-late October is another: ADX has slipped back under 20, and the close has walked back inside the cloud. They can confirm each other. They should not replace each other.
Can I use this the same way on a 15-minute or 1-hour BTC chart?
You can plot the same (9, 26, 52) on any clock. You cannot import this article’s dates and conclusions onto that clock. A 26-bar displacement on the 15-minute chart is six and a half hours, not roughly a month. Leaves, breaks and colour lag still happen; they just expire faster. Our own order is daily first.
Can Ichimoku alone be a trading system?
You can write one. You will need a rule for closes that only just clear or lose the cloud edge, a rule for whether you trust the cloud in view or the projected cloud when colour is lagging, a position-size rule for when ATR is expanding (see the ATR tutorial), and an honest cost model. Buying every green patch and shorting every TK cross down, on this BTC daily sample, would have faded 21 September and might have kept you with a still-green cloud for too long in November. That is the failure mode. Everything in this article is for education and review.
Does an Ichimoku reading tell me anything about an event contract or a JEV direction?
Only indirectly. An event contract has its own expiry, settlement index and payout rules — start with the BTC event contract guide if that is the product you are studying. JEV is a separate five-direction assessment with a confidence number that is not a win rate. Ichimoku can be part of the market context we feed the model, and part of the context we read by hand. It is not a settlement forecast.
Data and references
- Klines: Binance public API, BTCUSDT daily, UTC, primarily 2026-07-01 to 2026-11-19. The 20 November session was still open at the time of writing and is excluded as an unfinished day. The cloud projected to the right of the last candle uses leading spans computed from completed dates through 19 November, displaced 26 sessions.
- Indicator: Ichimoku (9, 26, 52), leading spans displaced 26 sessions forward, Chikou plotted 26 sessions back. Tenkan, Kijun and Span B are midpoints of the high and low over their windows, not averages of closes.
- Ichimoku Kinko Hyo is associated with Goichi Hosoda (Ichimoku Sanjin) and mid-20th-century work on equilibrium charting. The implementation above is the common charting default, not a claim about any particular broker’s internals.
- Earlier pieces in this Coinpred series, when you want the neighboring tools: candlesticks, support and resistance, moving averages, RSI, MACD, Bollinger Bands, volume, Fibonacci, Stochastic, ATR, and the companion ADX tutorial.
All charts were drawn by Coinpred from the public data above. If you spot a date or a figure that does not recompute, write to us through the authors page or via the contact route listed there (@xbluev). Trading involves risk — decide independently and size carefully. This article is educational only and is not investment advice. Coinpred is not available to users in mainland China.