In our last tutorial we covered how to read crypto candlestick charts. The most common follow-up question was: “OK, I can read a single candle — but where is price actually likely to stall?” That is exactly what support and resistance try to answer.
Support and resistance are the oldest tools in technical analysis, and probably the most misused. Most tutorials tell you to “connect two lows with a line.” In real markets, though, price almost never stops at the exact same number twice. In our own chart reviews, one habit made the biggest difference: treat support and resistance as zones, not lines. Your read gets cleaner and your stops get hunted less often.
There is no made-up example data here. Everything below uses Binance’s public BTCUSDT candles from July 3 to October 30, 2026 (UTC). Every price quoted was computed straight from the raw data, so you can download it and check our work.
1. What support and resistance actually are
In plain terms:
- Support zone: an area where buyers have tended to show up, so declines slow down or stop.
- Resistance zone: an area where sellers have tended to show up, so rallies slow down or reverse.
There is nothing mystical about it. It comes down to memory. Traders who sold near 65,000 last time may want to “get out at breakeven” when price returns. Traders who missed buying at 62,000 may be determined not to miss it again. Stack those orders and emotions together and you get a crowded price area.
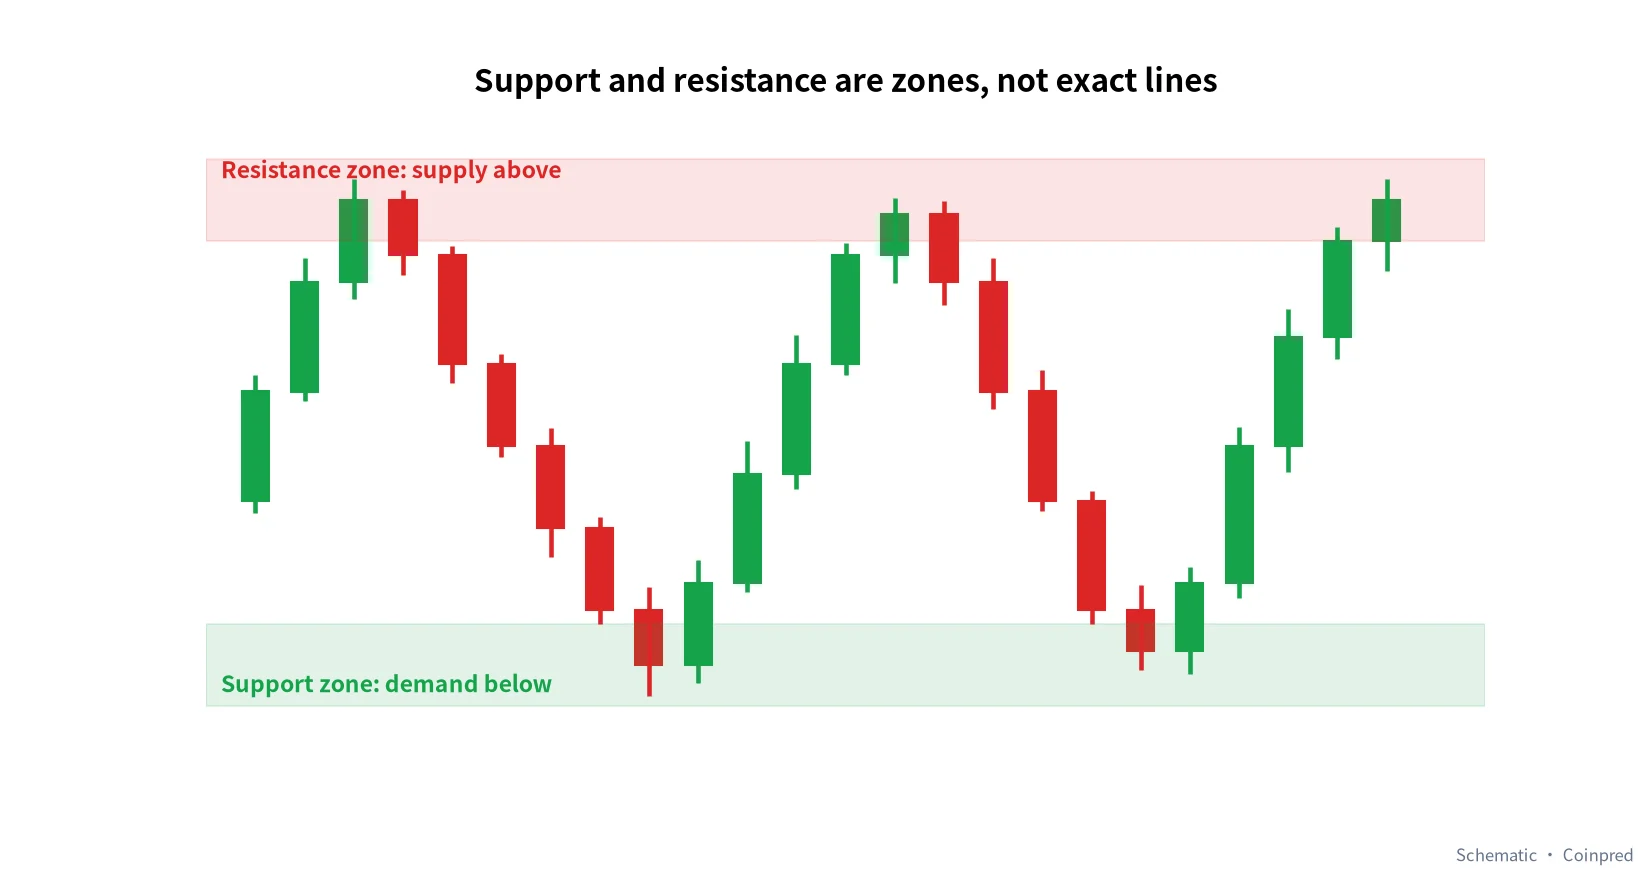
The diagram above is a schematic. Price swings between two shaded bands, and it never touches exactly the same level twice — sometimes it pokes through a little and snaps back. Draw a single thin line and you’ll constantly flip between “it broke” and “no it didn’t.” Draw a zone and that noise gets absorbed.
2. Step one: find swing highs and swing lows
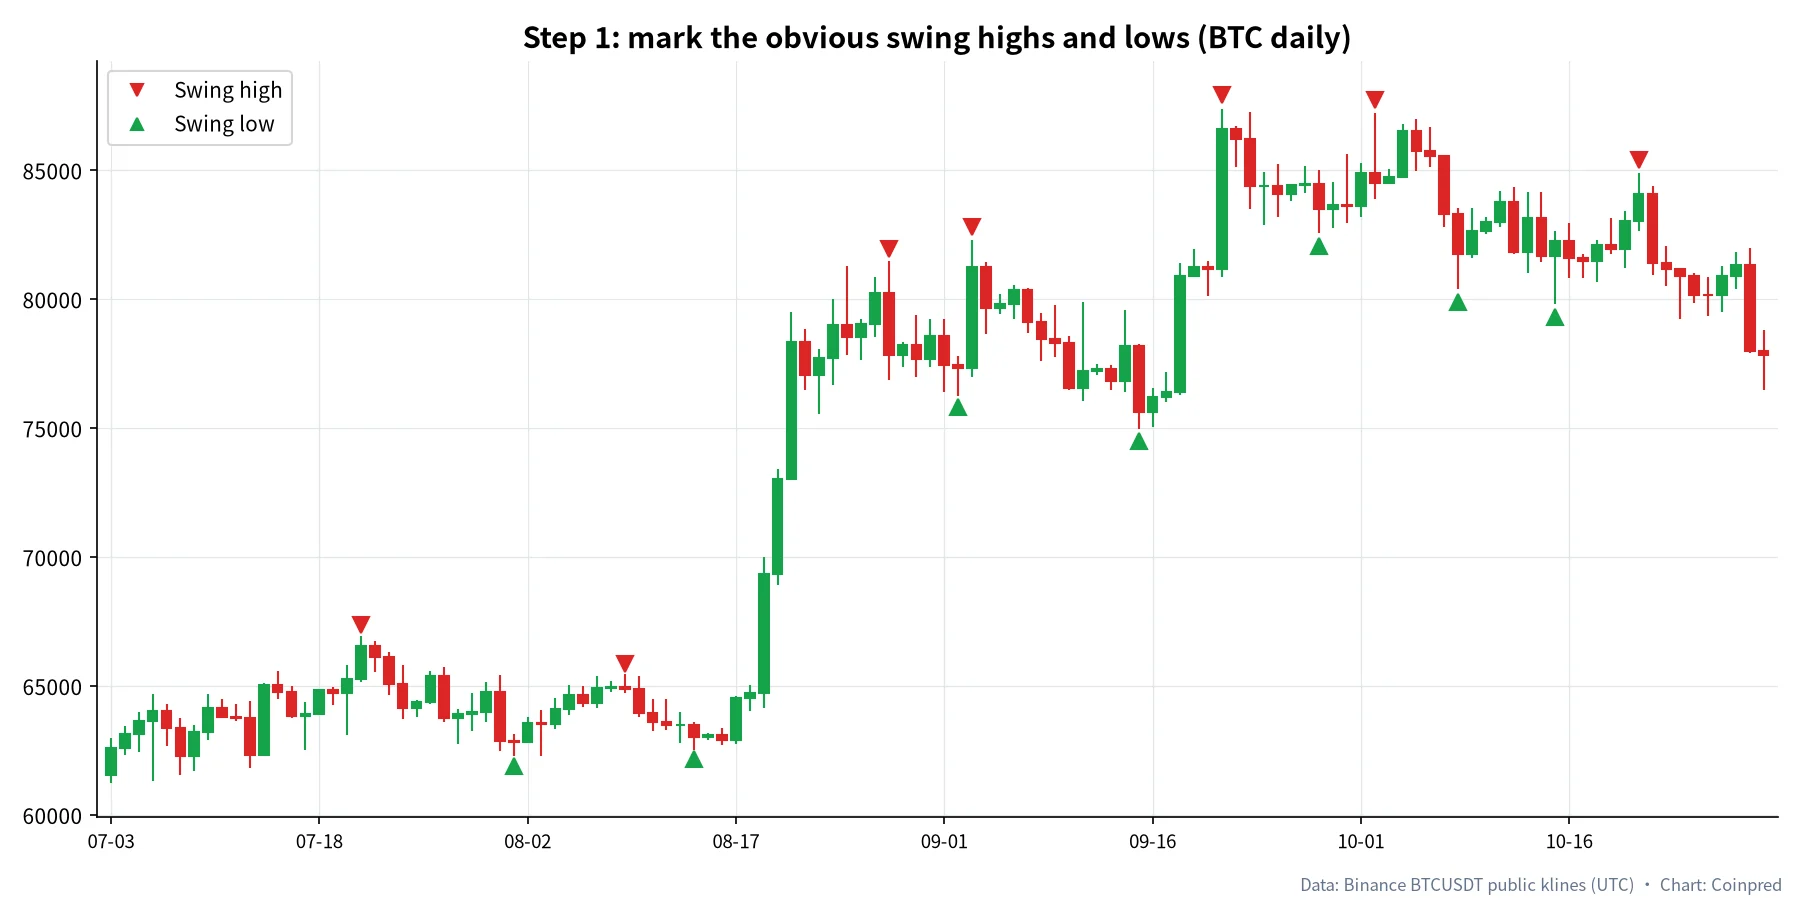
The raw material is swing highs and swing lows. We use a mechanical rule so you can reproduce it:
A daily candle is a swing high if its high is above the highs of the 5 candles on each side. Swing lows work the same way in reverse.
Applied to BTC’s daily chart from July to October, that rule gives us these points:
| Type | Date (UTC) | Price (USDT) |
|---|---|---|
| Swing high | Jul 21 | 66,956.15 |
| Swing high | Aug 9 | 65,474.46 |
| Swing high | Aug 28 | 81,478.87 |
| Swing high | Sep 3 | 82,300.00 |
| Swing high | Sep 21 | 87,395.67 |
| Swing high | Oct 2 | 87,220.00 |
| Swing high | Oct 21 | 84,898.00 |
| Swing low | Aug 1 | 62,275.00 |
| Swing low | Aug 14 | 62,535.24 |
| Swing low | Sep 2 | 76,264.00 |
| Swing low | Sep 15 | 74,967.97 |
| Swing low | Sep 28 | 82,563.00 |
| Swing low | Oct 8 | 80,393.56 |
| Swing low | Oct 15 | 79,800.00 |
Source: Binance BTCUSDT public daily candles; 5 candles on each side.
Why 5? There’s no correct answer. A smaller number gives you lots of noisy points; a bigger one leaves only major turns. Something between 3 and 5 is common on the daily chart, and we picked 5 to keep the chart clean. The parameter matters less than the discipline: use one rule per chart, and don’t cherry-pick points based on mood.
3. Step two: merge nearby points into zones
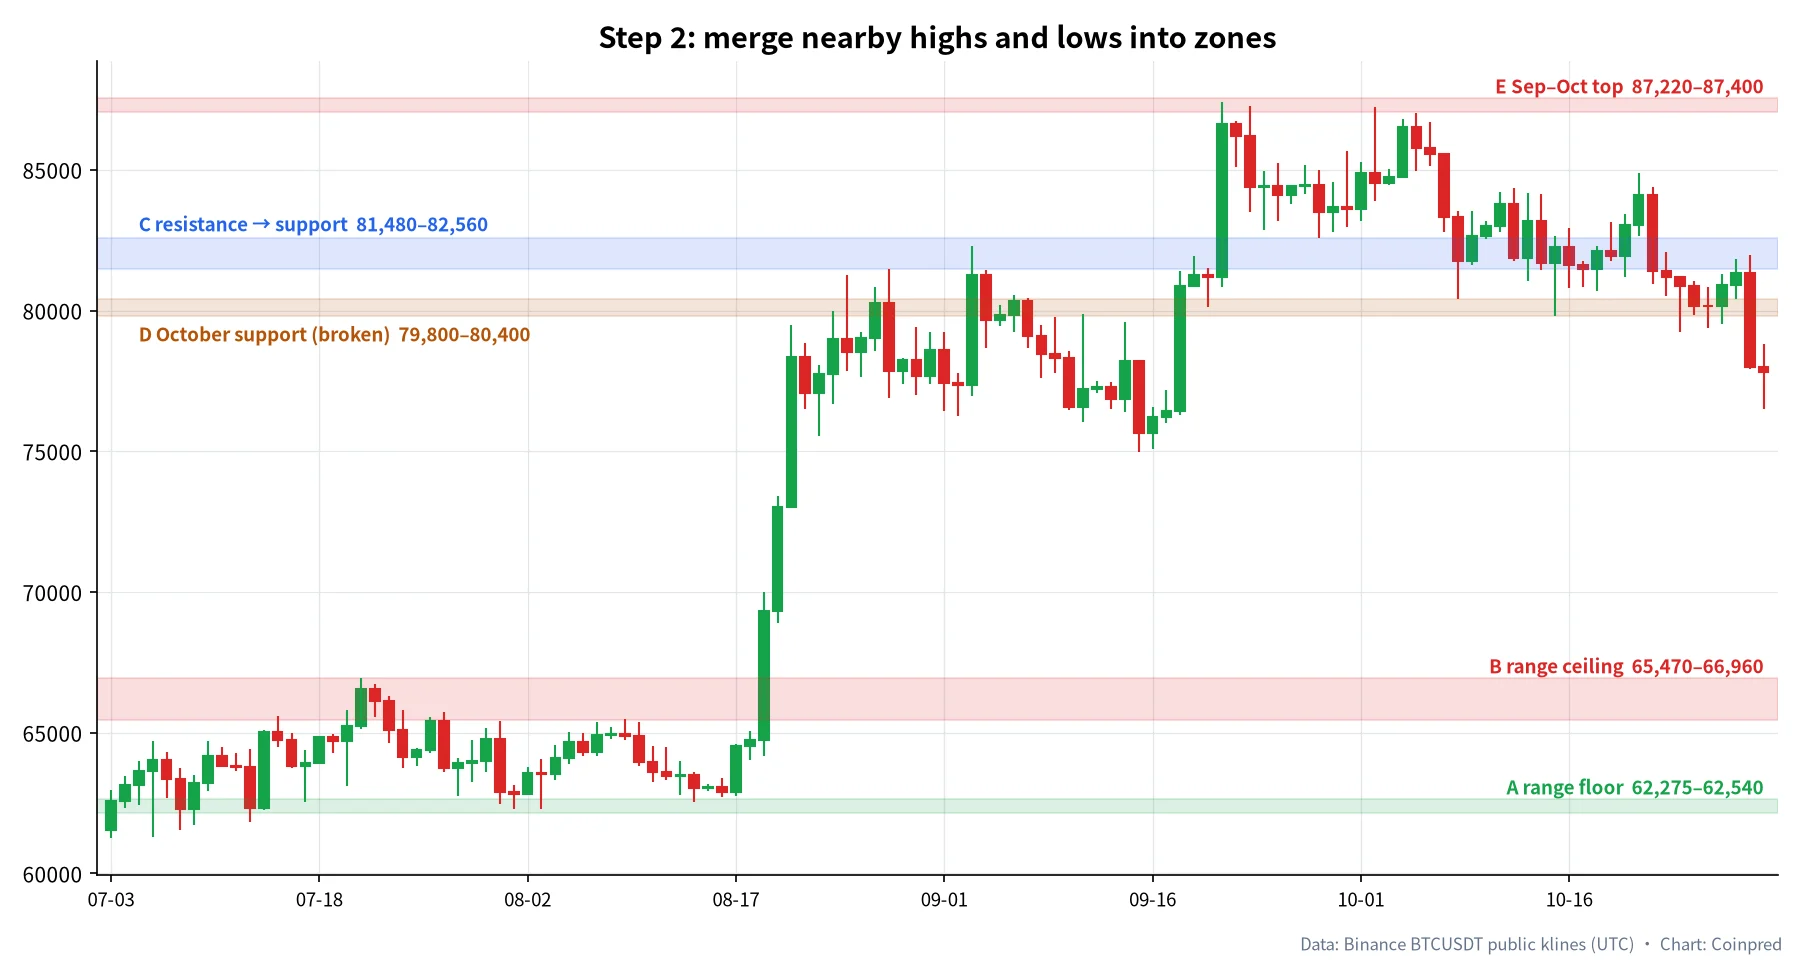
A pile of points isn’t a map yet. Group points that sit at similar prices, and use their highest and lowest values as the zone’s edges. Highs and lows can land in the same zone — and that is exactly where “resistance becomes support” comes from.
| Zone | Range (USDT) | Built from | Role in this period |
|---|---|---|---|
| A — range floor | 62,275 – 62,540 | Aug 1 and Aug 14 lows | Support for the Jul–Aug range |
| B — range ceiling | 65,470 – 66,960 | Jul 21 and Aug 9 highs | Resistance, broken in late August |
| C — resistance → support | 81,480 – 82,560 | Aug 28 and Sep 3 highs + Sep 28 low | Capped price twice, then held on the retest |
| D — October support | 79,800 – 80,400 | Oct 8 and Oct 15 lows | Broken in late October |
| E — Sep–Oct top | 87,220 – 87,400 | Sep 21 and Oct 2 highs | Two failed pushes higher |
A few practical notes:
- Keep zones a sensible width. On the BTC daily chart we usually aim for 0.5%–2% of price. Zone B is about 1,490 dollars wide — roughly 2.3% of price — which is on the wide side and tells you that top was messy.
- More touches means a more important zone — but also one that is more likely to eventually give way. More on that below.
- Zones closer to the current price matter more. A and B are far away now and say little about today’s trading.
4. Step three: understand role reversal
Zone C is the textbook example from these four months.
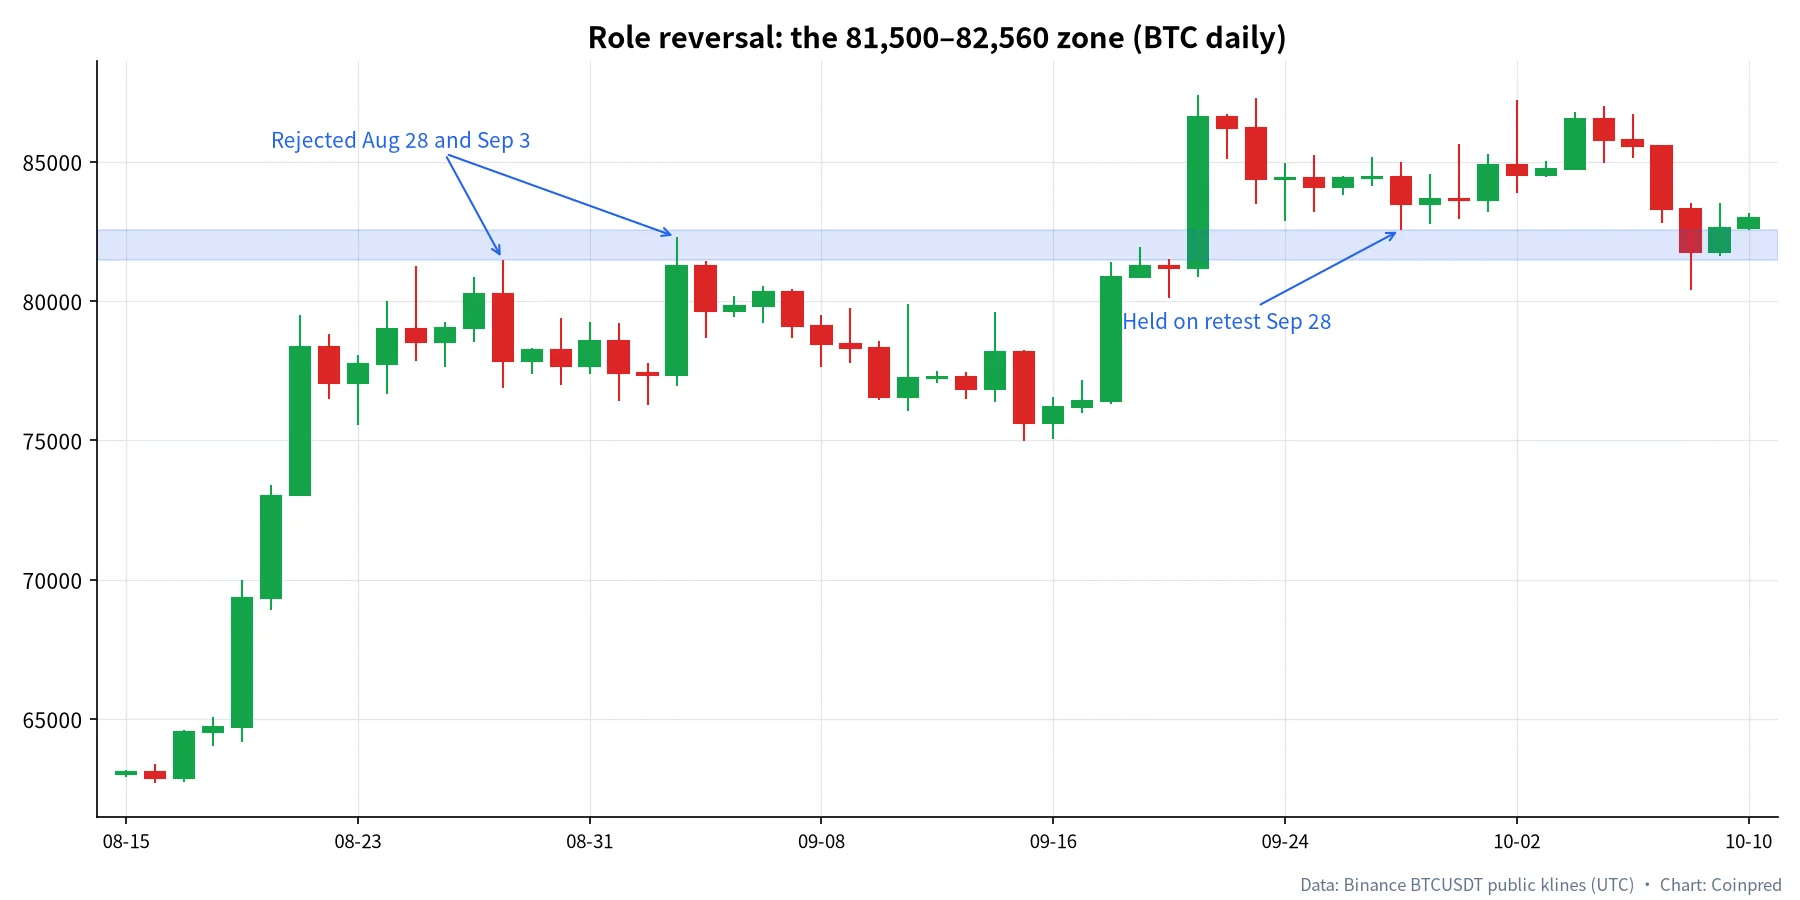
- On August 28, BTC’s daily high hit 81,478.87, then it left a long upper wick and pulled back.
- On September 3, it pushed to 82,300 and got rejected again.
- After price climbed above the zone in mid-September, the September 28 pullback bottomed at 82,563 — right at the top edge of the zone — and price moved higher from there.
This is role reversal. Once the sellers who capped price are absorbed, the same area becomes somewhere buyers are willing to defend. In our experience, the first retest after a breakout is when such a zone is most useful. The second and third retests get progressively less reliable — you can see that in early October, when the Oct 8 low already dipped below the zone.
5. Step four: separate real breakouts from fake ones
The real danger with support and resistance isn’t misreading them — it’s getting sucked in by a false breakout. Here’s one real breakout and one real breakdown.
A real breakout: late August, out of the Jul–Aug range
From July 3 to August 18, BTC chopped between 61,248.86 and 66,956.15 for six weeks. Between August 19 and 21, three daily candles took price from an open of 64,725 to a close of 78,338. Volume on August 21 reached 44,340 BTC — about three times the prior 120-day median of roughly 14,435 BTC.
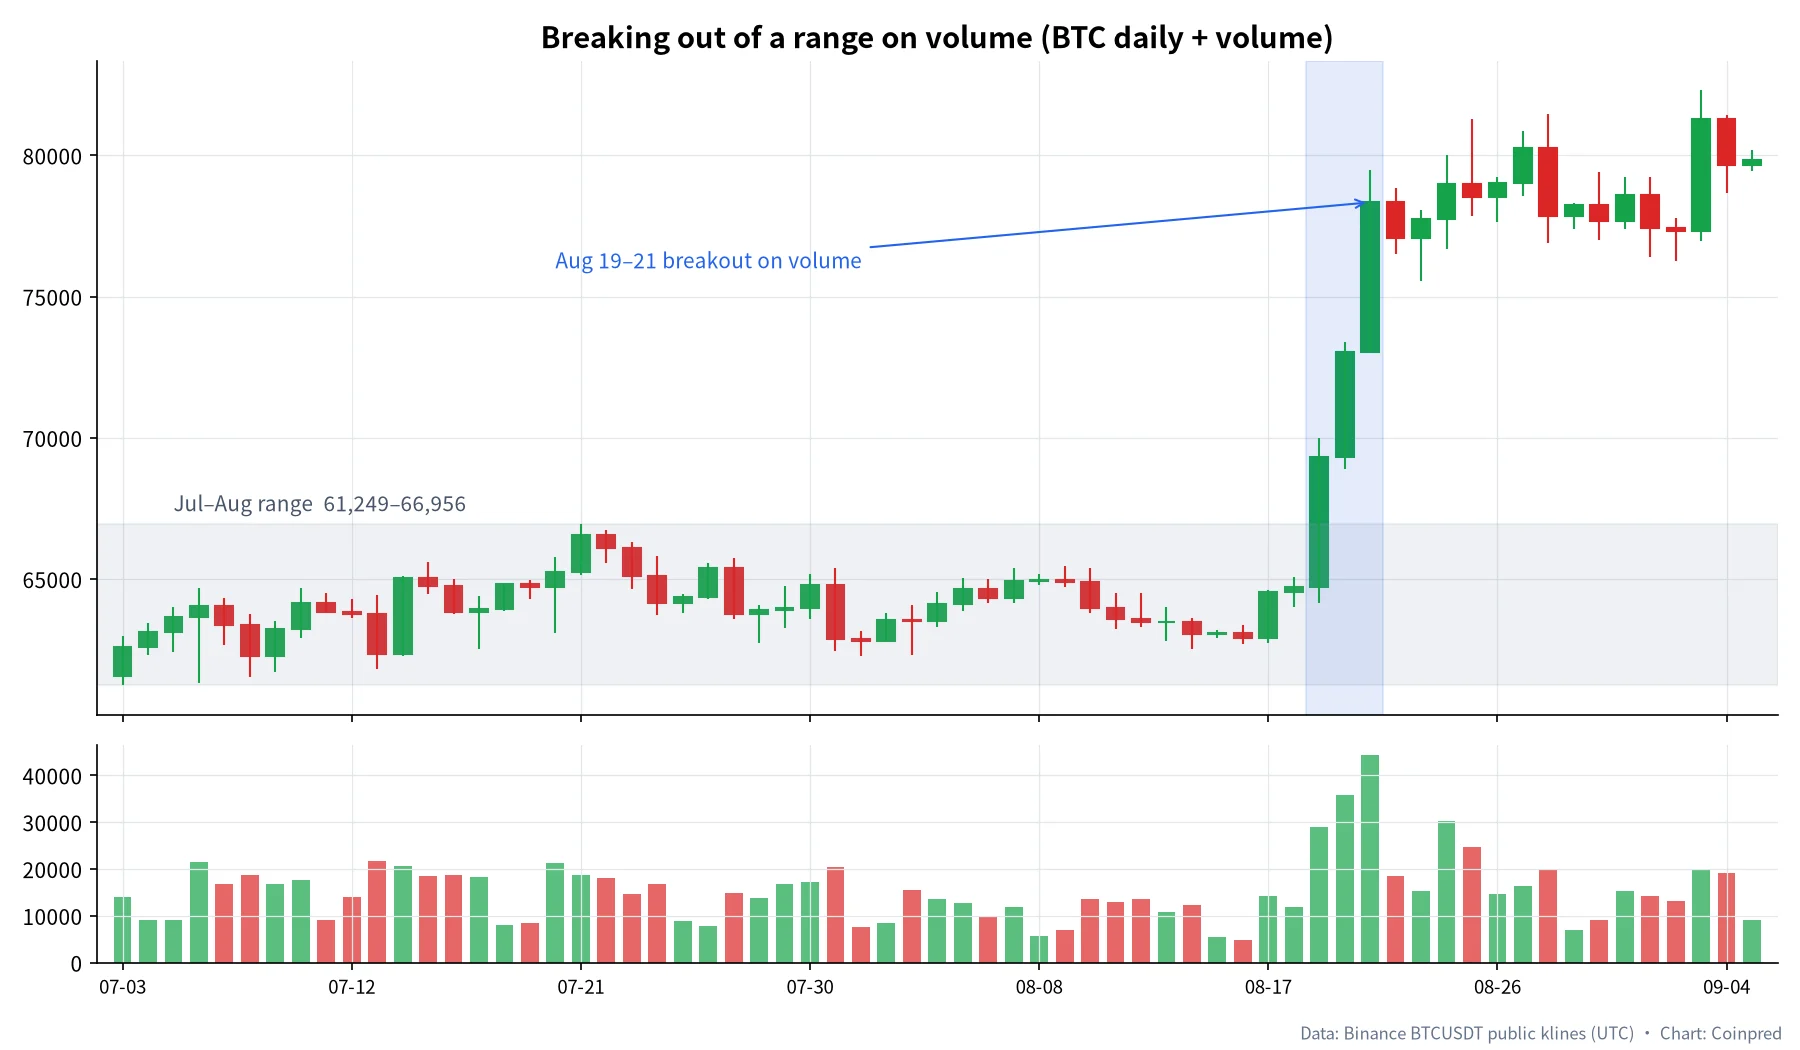
What happened next matters even more. From August 21 to October 30, BTC’s lowest daily low was 74,967.97 — price never went back into the old range. That’s a clean breakout: a close outside the zone, heavy volume, and no return.
A breakdown: the 79,800–80,400 support in late October
Now the recent example. On October 8 and 15, BTC found a floor near 80,000, making zone D October’s support. On October 29, a large red 4-hour candle cut straight through it. That day’s daily candle closed at 77,991.89 with a low of 77,910, and as of October 30 (UTC) the intraday low has reached 76,500.11.
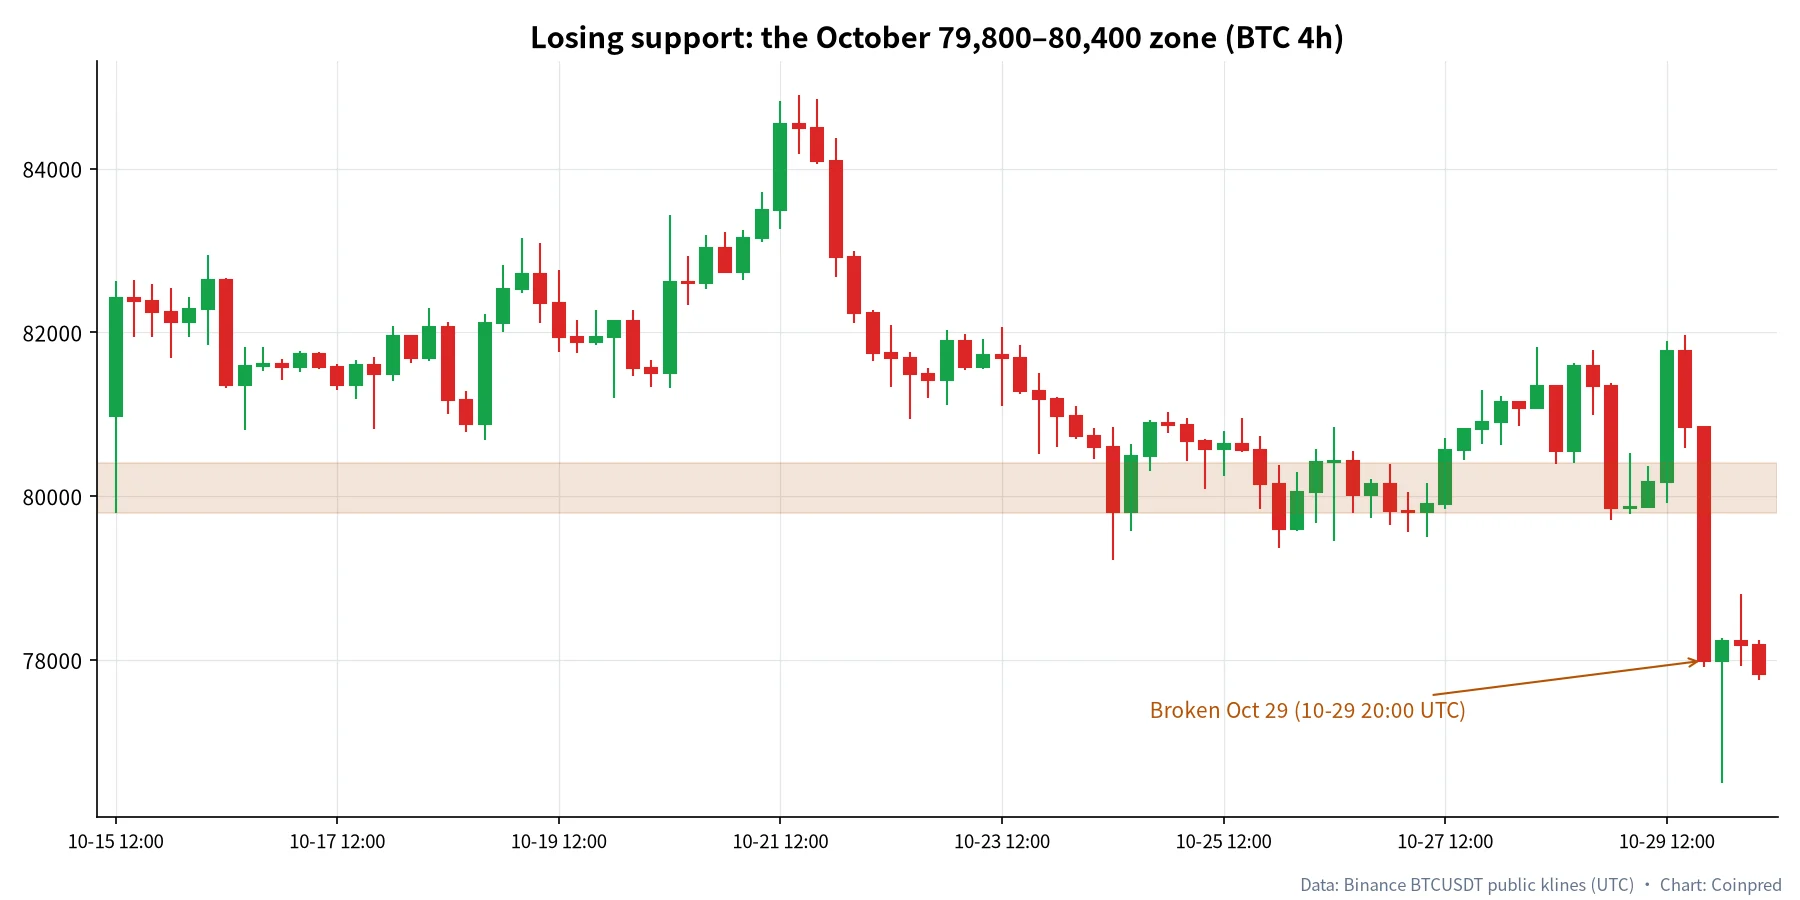
A word of caution: as we write this, the breakdown is barely a day old, and nobody can promise whether price will reclaim the zone. We use it to show how a repeatedly tested support eventually fails — not as a forecast.
What a false breakout looks like
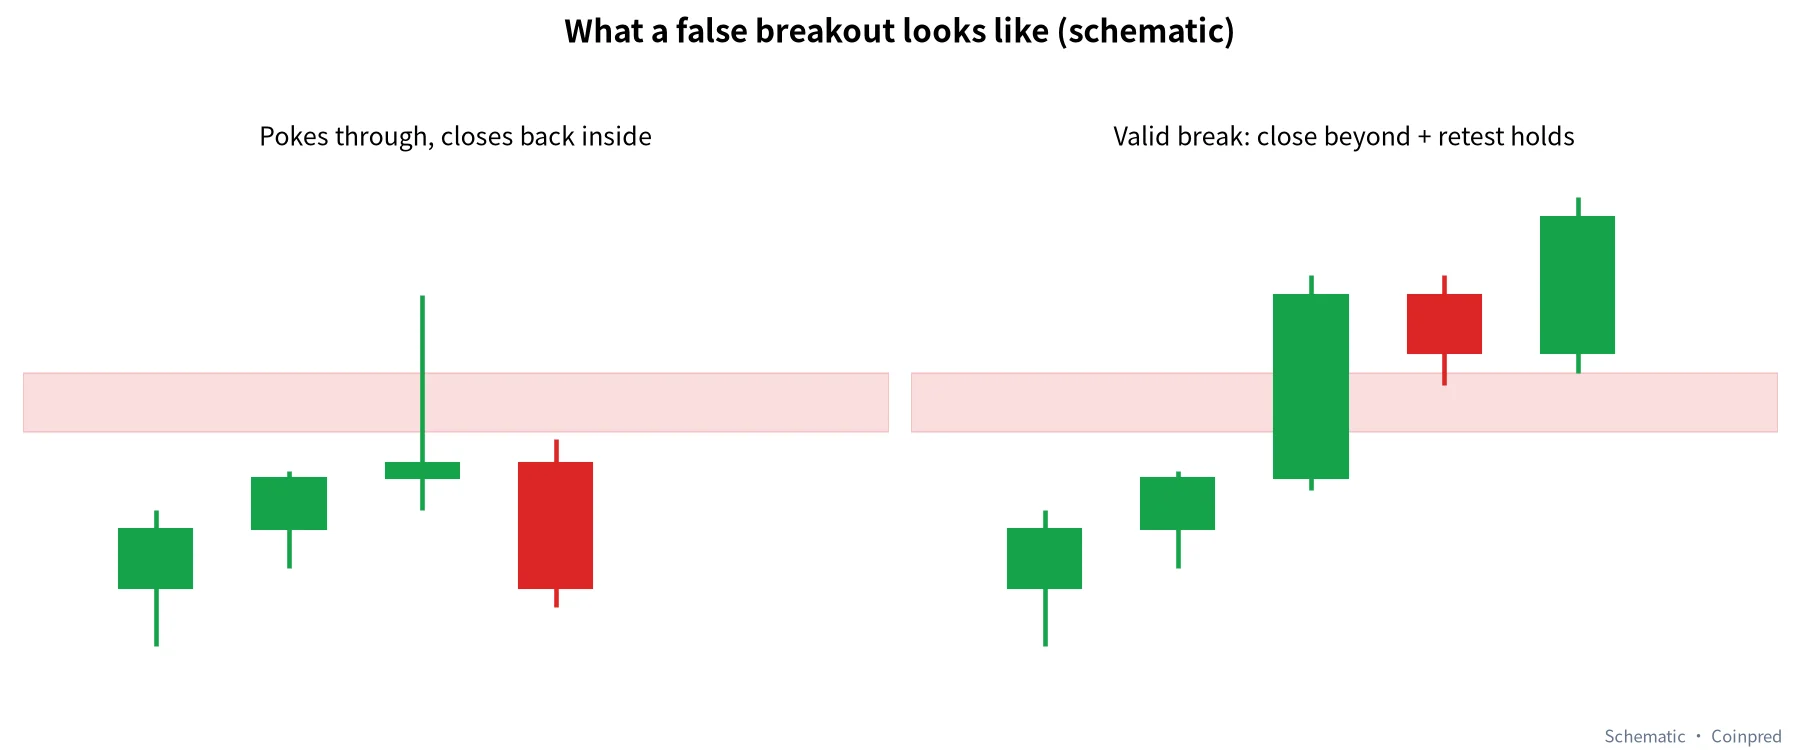
The signature of a false breakout: a wick pokes through the zone, but the candle closes back inside, and the next candle or two reverse quickly. Side by side:
| What to check | Looks like a real breakout | Looks like a false breakout |
|---|---|---|
| Close | Closes outside the zone | Only the wick gets out; close is back inside |
| Volume | Clearly above recent average | Normal or even shrinking |
| Next 1–3 candles | Keep trading outside the zone | Return inside the zone and reverse |
| Retest | Retests the zone and holds | Retest slices straight back through |
| Timeframe | Confirmed on daily / 4-hour | Only visible on 15m or 5m |
Our own habit: don’t chase low-timeframe breakouts. Wait for the close, then watch the first retest. You’ll miss part of some moves, but you’ll dodge a lot of whipsaws.
6. Round numbers: the underrated psychological levels
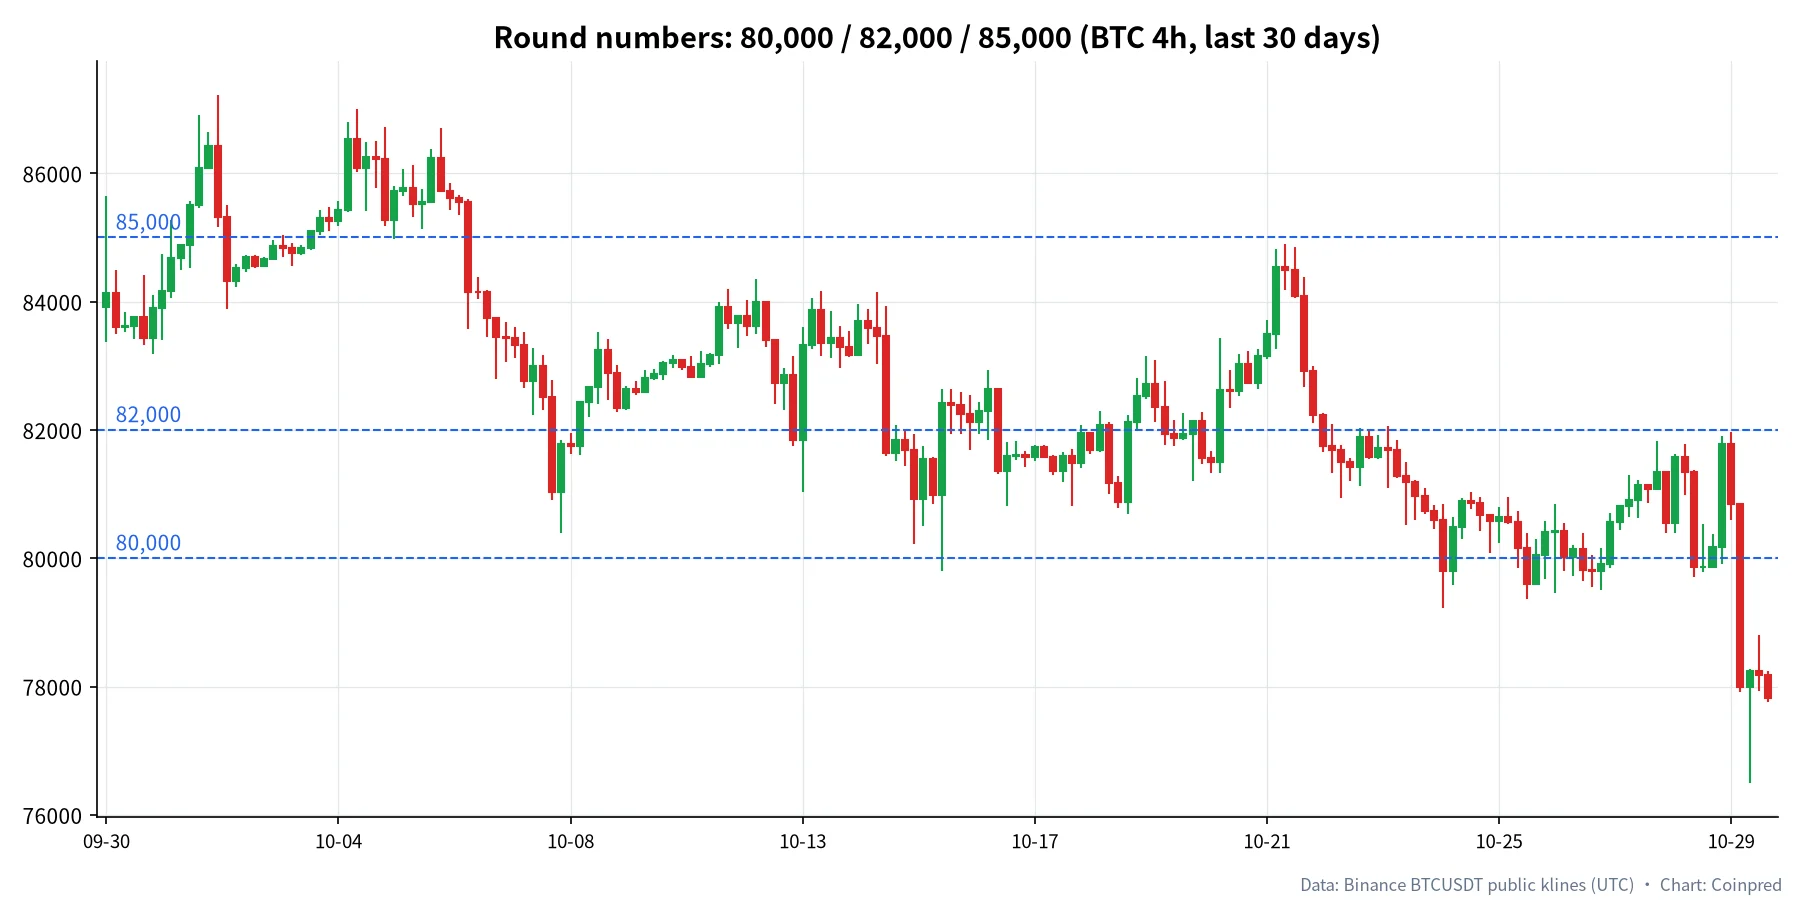
Beyond past highs and lows, round numbers often act as support and resistance on their own, because limit orders, stops and option strikes cluster around them. We counted how many 4-hour candles in the last ~30 days (180 candles, Sep 30 12:00 to Oct 30 08:00 UTC) had a range that came within ±0.3% of each level:
| Round number | 4h candles touching it (of 180) | Notes |
|---|---|---|
| 80,000 | 21 | Overlaps zone D; broken in late October |
| 82,000 | 49 | The “stickiest” price; sits near the top of zone C |
| 85,000 | 21 | Near the mid-to-late October bounce high |
82,000 was touched by 49 candles, which tells you a huge amount of trading changed hands there this month. A round number on its own isn’t much to go on, but when one falls inside a zone you’ve already drawn, give that zone extra weight.
7. Combining timeframes
The same price carries different weight on different timeframes. Here’s how we weigh them:
| Timeframe | Use it for | Weight |
|---|---|---|
| Weekly | Big-picture direction and a handful of key zones | Highest |
| Daily | Drawing the main zones (what this guide uses) | High |
| 4-hour | Refining zone edges; watching breakouts and retests | Medium |
| 1-hour / 15-min | Timing entries | Low — execution only |
One rule covers it: higher timeframes define the zones, lower timeframes time the trade. Never let a minor low on the 15-minute chart overrule a major daily zone.
8. Our four-step routine
Here’s everything above boiled down to something you can run every day:
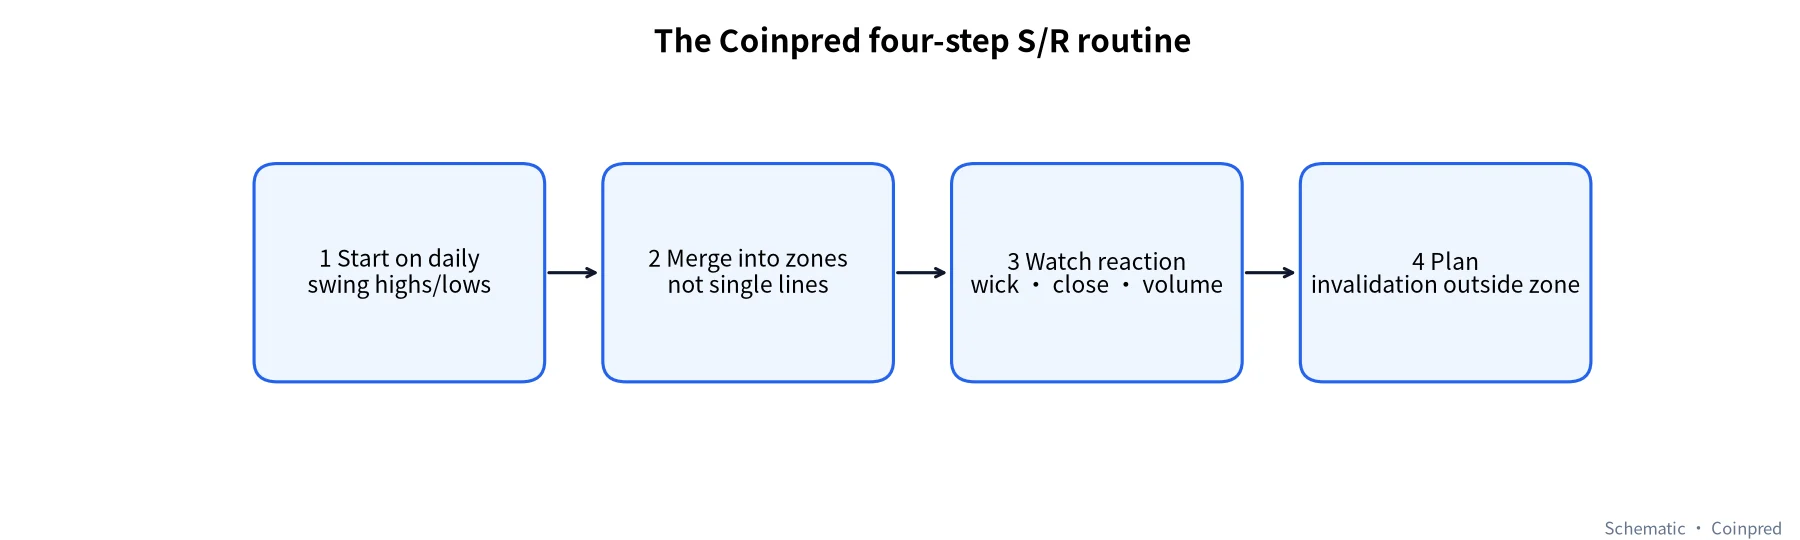
- Find points: mark swing highs and lows on the daily chart with a fixed rule (e.g., 5 candles on each side).
- Merge: group nearby points into zones about 0.5%–2% of price wide.
- Rank: prioritise by touch count, distance from current price and overlap with round numbers. Focus on the nearest two or three.
- Wait for confirmation: when price reaches a zone, check the close, the volume and the first retest instead of reacting on contact.
If you trade BTC event contracts on Coinpred, this routine fits questions like “will price be above or below X at a given time?” really well. Start with our BTC event contracts explainer and the how-to-use guide.
9. Common beginner mistakes
- Drawing too many lines. With a dozen lines on the chart, there’s “support” everywhere — which means there’s none.
- Anchoring on the most extreme wick. One spike can drag your line off. Lean on candle bodies and clusters of touches.
- Watching support but ignoring resistance. Longs stare at the floor and forget the layers of resistance overhead, so their targets end up unrealistic.
- Treating a zone as a certainty. Support and resistance describe where a reaction is possible, not guaranteed. Zone D proves the point.
- Skipping the stop. When a zone clearly breaks, accept that the idea failed instead of hunting for the “next support” all the way down.
FAQ
Should I draw support and resistance as lines or zones?
We recommend zones. Crypto is volatile and full of wicks, so a single line gets pierced almost every time. A zone absorbs that noise and makes stop placement easier.
Does support get stronger the more times it’s tested?
The first two or three tests usually confirm a zone. But many tests also mean buyers there are being used up. The October 79,800–80,400 zone in this guide broke after repeated tests.
How do I tell if a breakout is valid?
Check at least three things: did the candle close outside the zone, was volume clearly higher, and did the first retest hold? A breakout that ticks all three is more reliable — still not guaranteed.
Which timeframe should I use to draw levels?
Draw the main zones on the daily (or weekly) chart, then refine them on the 4-hour and 1-hour. Use lower-timeframe highs and lows for timing only, never to overrule the higher timeframe.
Do round numbers really matter?
Orders tend to cluster around them. In this guide, 82,000 was touched by 49 four-hour candles in 30 days. They work best combined with swing-point zones rather than on their own.
Can support and resistance predict price?
They only show where a reaction might happen, not what will happen. Any zone can fail, so pair them with position sizing and stops. Nothing here is investment advice.
Data and sources
- Candle data: Binance public data endpoint data-api.binance.vision, BTCUSDT daily and 4-hour candles, 2026-07-03 to 2026-10-30 (UTC). All figures computed from the raw data.
- Binance Academy: Support and Resistance Explained
- Investopedia: Support and Resistance Basics
- Binance API docs: kline data
All charts were drawn by Coinpred from the public data above.