Earlier we covered moving averages, RSI and MACD. One more tool shows up on almost every chart — and gets misread as “tag the band, fade it” more than any other: Bollinger Bands.
Cold water first: Bollinger Bands are not an auto-short at the upper rail or auto-long at the lower rail. They measure how wide price has been relative to itself. In our reviews we look at whether bandwidth is contracting or expanding before we decide whether price is riding a rail or bouncing between them — those two readings are opposites.
Every figure below comes from Binance’s public BTCUSDT daily candles (UTC). We use the common settings: middle = SMA20, upper/lower = middle ± 2× standard deviation (20-day window). Bandwidth is (upper − lower) / middle × 100%. You can download the candles and recompute.
1. What the three lines actually are
Three plain sentences:
- Middle band: the 20-period simple average of closes — the same SMA20 from our moving-average tutorial.
- Upper band: middle plus two standard deviations — the wilder recent swings are, the higher it lifts.
- Lower band: middle minus two standard deviations — more volatility pushes it lower.
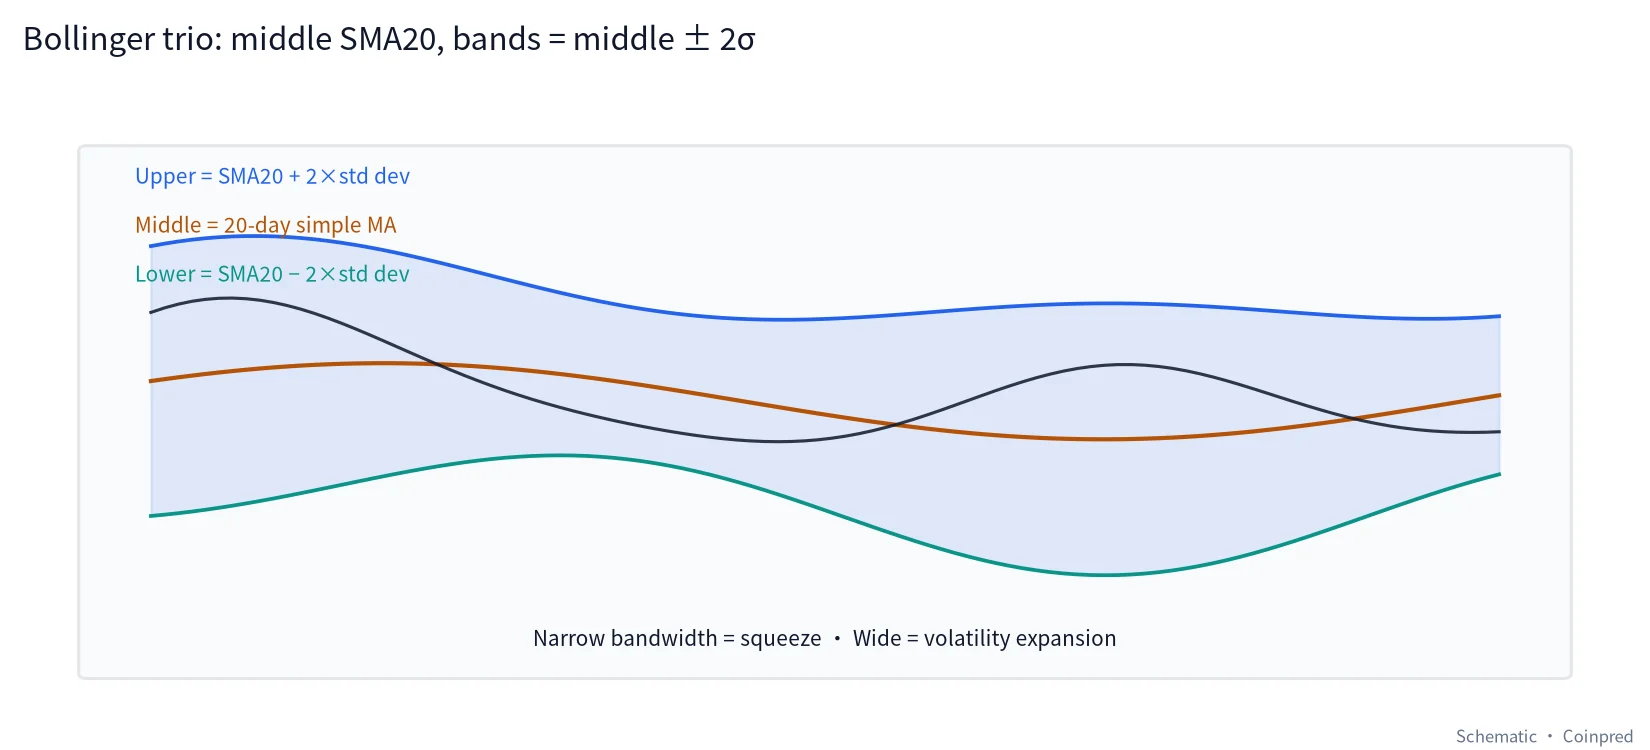
The diagram is a schematic: one average in the middle, two rails that breathe with volatility. Live price pokes outside and snaps back often, so a single “touch of the upper band” is nowhere near enough to act on.
2. The big picture: BTC Bollinger Bands from July to October
Here are daily BTC candles from July 1 to October 31, 2026, with Bollinger Bands overlaid:
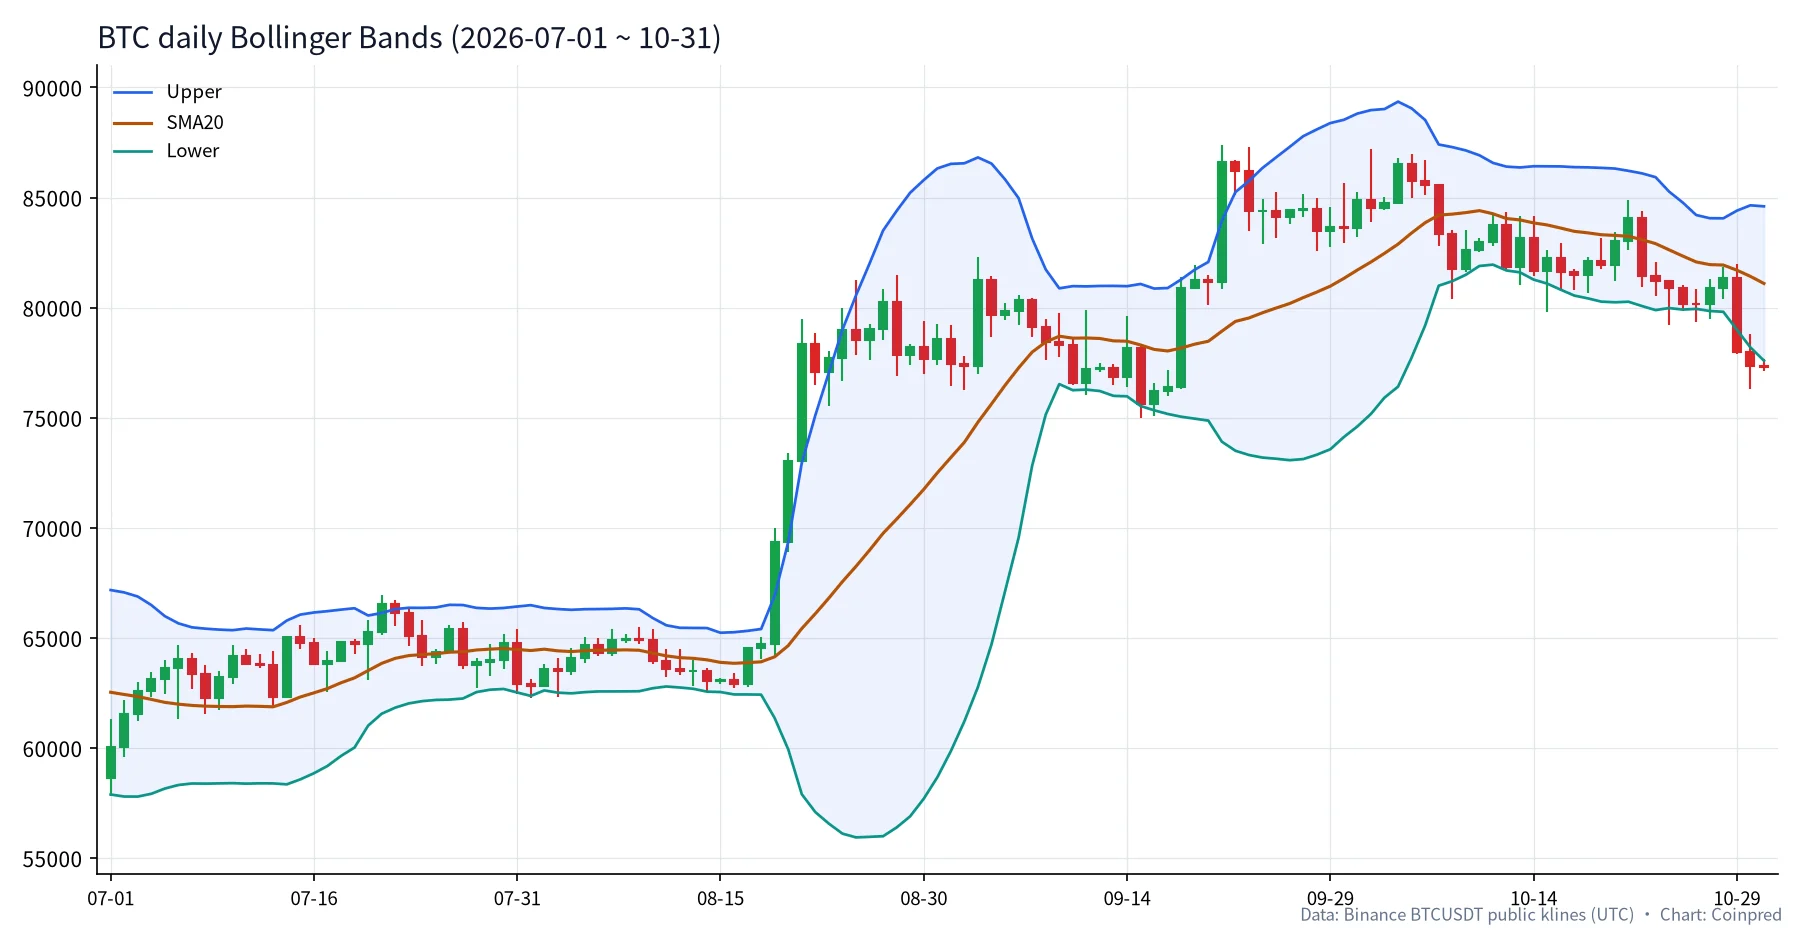
Three moods stand out:
- Early July to mid-August: price ground inside the bands while bandwidth kept narrowing.
- Late August: price walked the upper band; bandwidth jumped from about 4% toward nearly 40%.
- October: repeated lower-band tags, then from October 29 several closes below the lower band.
The next sections unpack each mood.
3. The squeeze: when volatility goes quiet, the next move is often loud
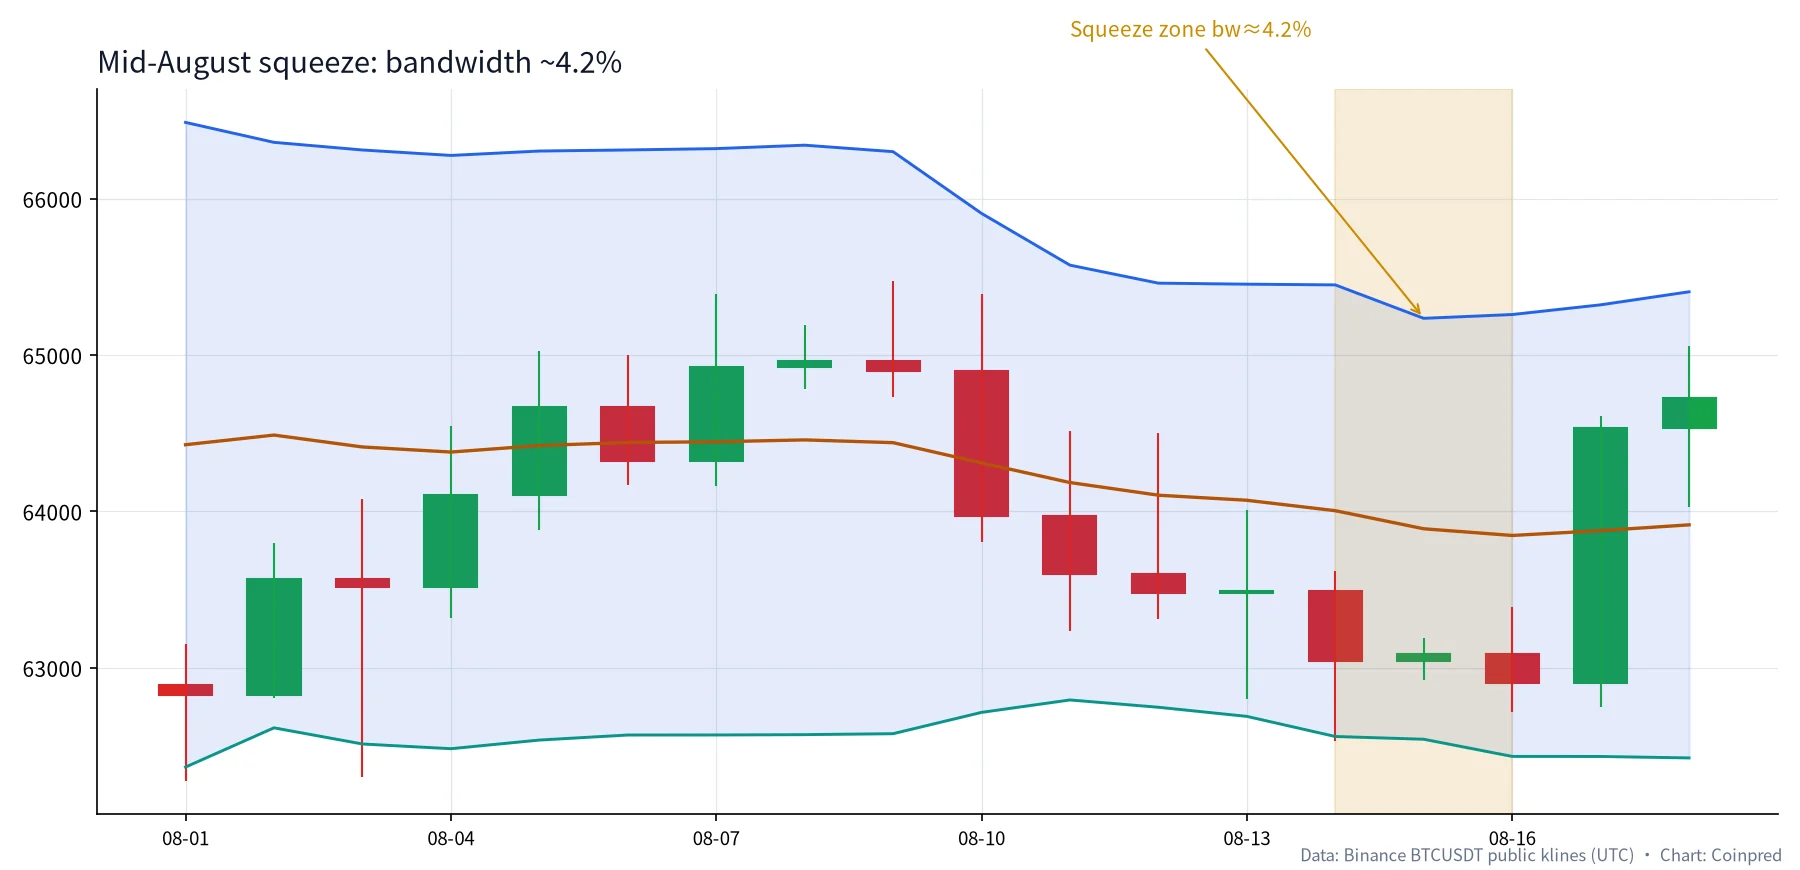
One of Bollinger’s best-known ideas is the squeeze — rails pulled tight, recent volatility abnormally small. Mid-August:
| Date (UTC) | Close (USDT) | Middle SMA20 | Upper | Lower | Bandwidth |
|---|---|---|---|---|---|
| Aug 12 | 63,479.99 | 64,104.22 | 65,460.40 | 62,748.05 | 4.23% |
| Aug 13 | 63,490.86 | 64,071.77 | 65,453.79 | 62,689.74 | 4.31% |
| Aug 15 | 63,086.01 | 63,889.49 | 65,235.47 | 62,543.52 | 4.21% |
| Aug 16 | 62,900.00 | 63,846.70 | 65,259.70 | 62,433.70 | 4.43% |
| Aug 17 | 64,532.10 | 63,877.56 | 65,321.78 | 62,433.33 | 4.52% |
| Aug 18 | 64,725.42 | 63,914.61 | 65,405.18 | 62,424.05 | 4.66% |
August 15 printed the tightest bandwidth in this window at about 4.21%. Price was still stuck in a roughly 62,500–65,200 channel — the volatility portrait of the same July–August range we mapped with swing points.
Practical takeaways:
- A squeeze does not give direction — it only says “it has been too quiet; noise may return.”
- Direction waits for price to choose a side: a close above the upper side or below the lower side, checked against volume and structure.
- We do not guess long/short on the narrowest day; we treat the squeeze as an attention alarm.
4. Walking the band: in a trend, tagging a rail ≠ reversing
What followed the squeeze? From August 19, BTC closed above the upper band for several sessions in a row:
| Date (UTC) | Close (USDT) | Upper | Close vs upper | Bandwidth |
|---|---|---|---|---|
| Aug 19 | 69,334.79 | 66,924.47 | Close above upper | 8.67% |
| Aug 20 | 73,025.15 | 69,358.64 | Close above upper | 14.57% |
| Aug 21 | 78,338.03 | 72,947.03 | Close above upper | 22.99% |
| Aug 22 | 77,074.93 | 75,112.08 | Close above upper | 27.27% |
| Aug 23 | 77,734.00 | 77,054.50 | Close above upper | 30.66% |
That is what John Bollinger calls walking the band: in a strong trend, price can ride the upper (or lower) rail instead of bouncing off it.
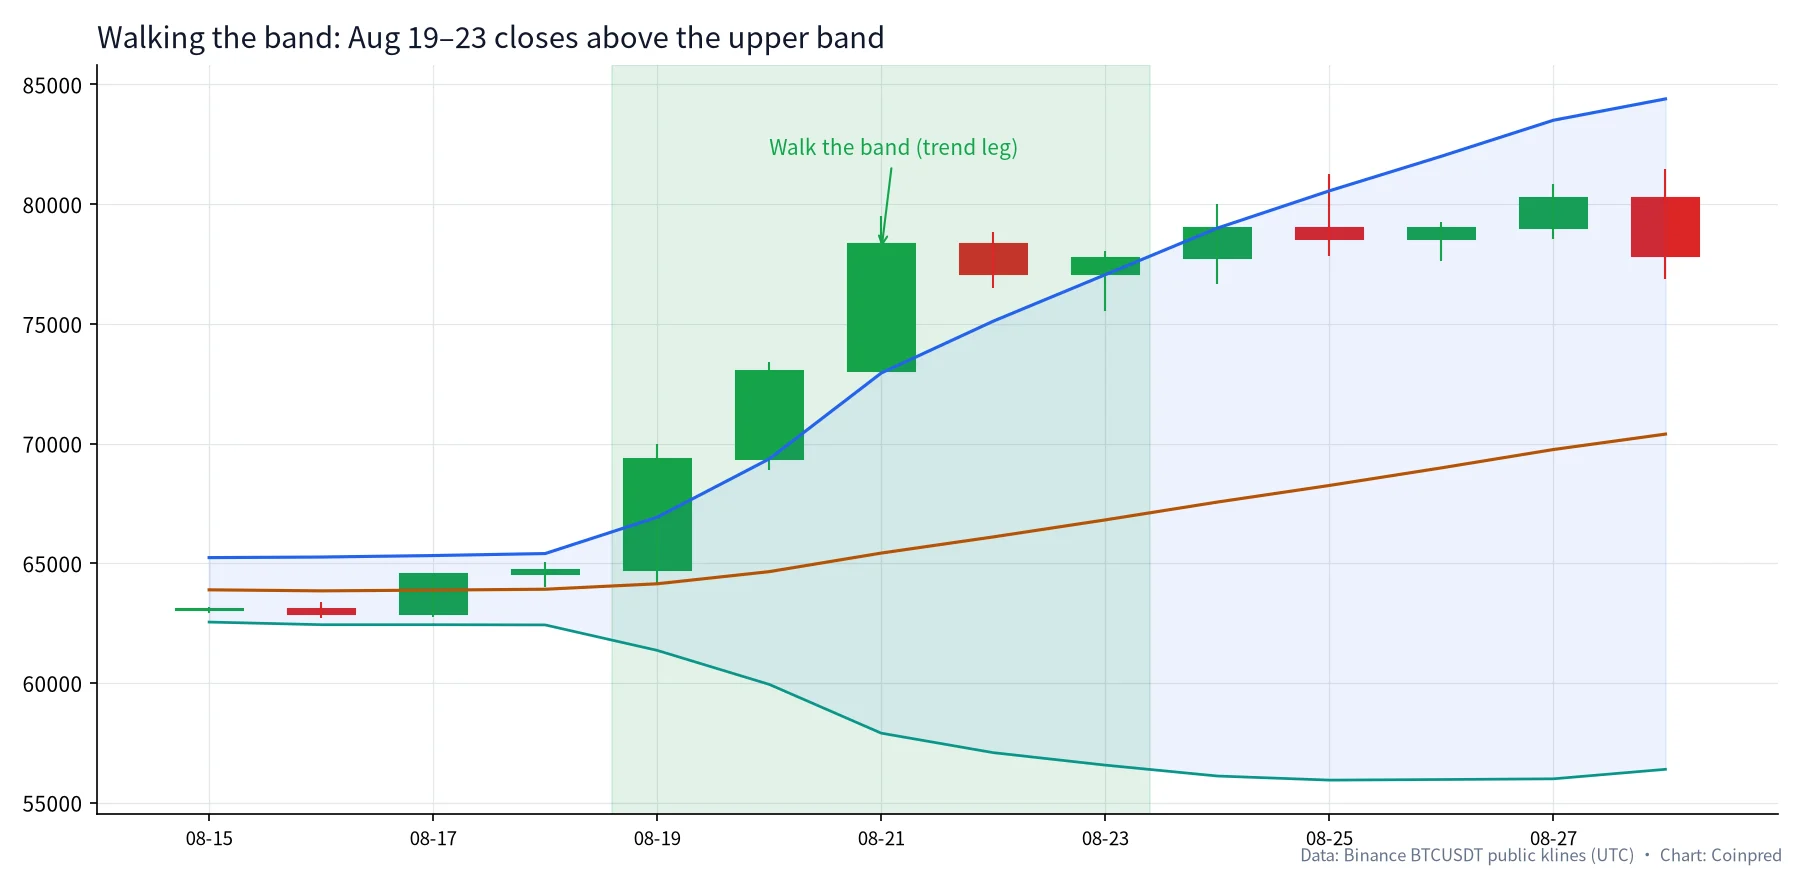
Over the same stretch, RSI stayed overbought for 11 days and the MACD histogram exploded — three tools describing the same fact from different angles: the rally was violent, and the trend was still on. Shorting August 19 solely because “price hit the upper band” would have been painful.
5. Bandwidth from ~4% to nearly 40%: expansion matters as much as squeeze
Rails alone are not enough — watch how wide they open. Bandwidth for July–October:
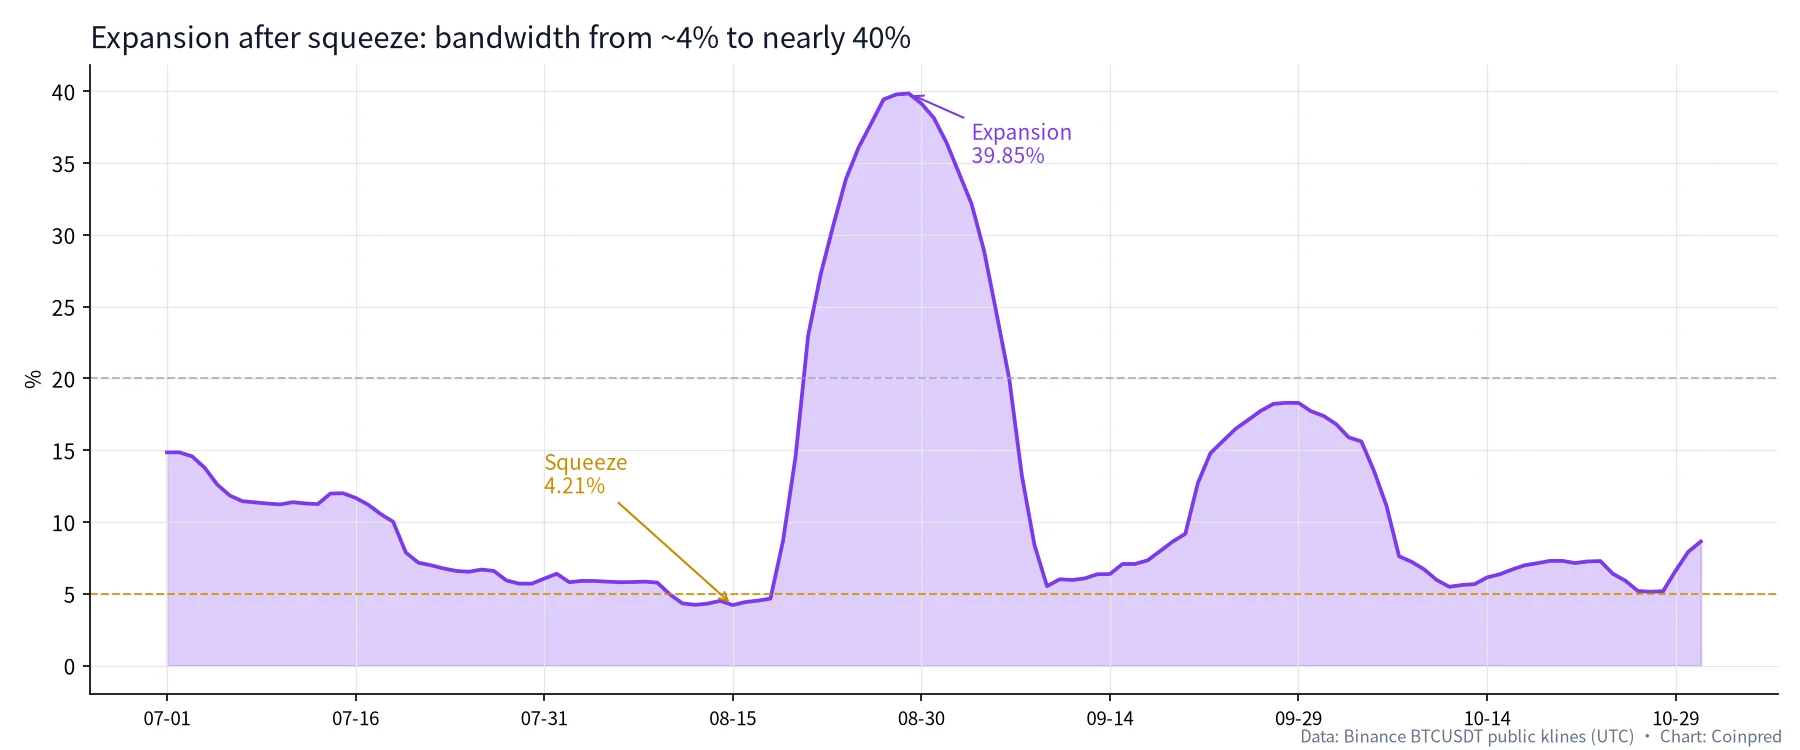
| Checkpoint | Date (UTC) | Bandwidth | Meaning |
|---|---|---|---|
| Tightest | Aug 15 | 4.21% | Peak squeeze |
| Rapid open | Aug 21 | 22.99% | Volatility ignition after breakout |
| Near widest | Aug 29 | 39.85% | Expansion crest |
| Mid-Oct re-narrow | Oct 11 | 5.49% | Volatility cools at altitude |
| Late-Oct re-open | Oct 31 | 8.64% | Volatility lifts again on the drop |
From August 15 to 29, bandwidth ran from about 4.2% to about 39.9%. That is not a broken indicator — it is the market flipping from very quiet to very loud. Expansion favors the trend reading (walk the band), not the mean-reversion reading.
6. Mean reversion vs trend: do not mix the two playbooks
This is the most important — and most reversed — Bollinger idea:
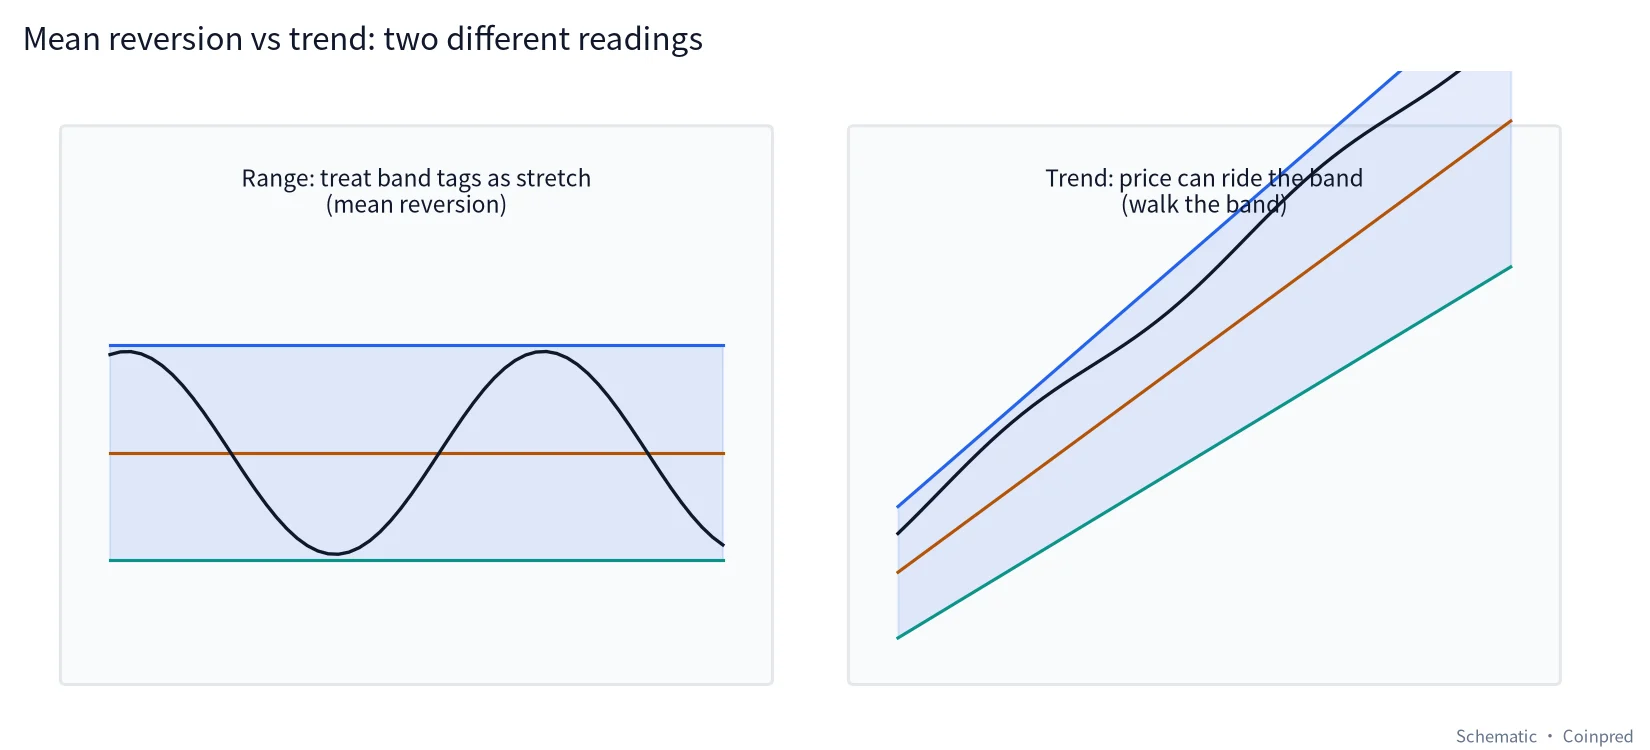
| Market state | Typical bandwidth | How to read a band tag | Pair it with |
|---|---|---|---|
| Range | Medium, breathing in and out | Upper/lower tags as “stretched” references (mean reversion) | Support/resistance, reversal candles |
| Trend | Rapid expansion | Price can ride the rail (walk the band) | MA direction, MACD zero line, volume breakouts |
Early July–mid-August looked more like the left column; late August like the right. Using the wrong playbook is more dangerous than not using the tool — chasing a walk inside a range, or fading a rail inside a trend, are classic loss scripts.
7. October: repeated lower-band tags, then closes below
Zoom to October:
| Date (UTC) | Close | Low | Lower | What happened |
|---|---|---|---|---|
| Oct 8 | 81,754.45 | 80,393.56 | 81,202.16 | Intraday tag, close back inside |
| Oct 15 | 82,245.93 | 79,800.00 | 81,092.56 | Another lower-band poke |
| Oct 24 | 80,888.16 | 79,220.74 | 79,982.08 | Tag again |
| Oct 25 | 80,154.09 | 79,845.86 | 79,911.55 | Hugging the lower rail |
| Oct 26 | 80,150.56 | 79,368.67 | 79,944.54 | Tag again |
| Oct 29 | 77,991.89 | 77,910.00 | 78,999.80 | Close below lower band |
| Oct 30 | 77,368.77 | 76,325.98 | 78,194.53 | Still closing below |
| Oct 31 | 77,299.75 | 77,114.01 | 77,592.91 | Still below |
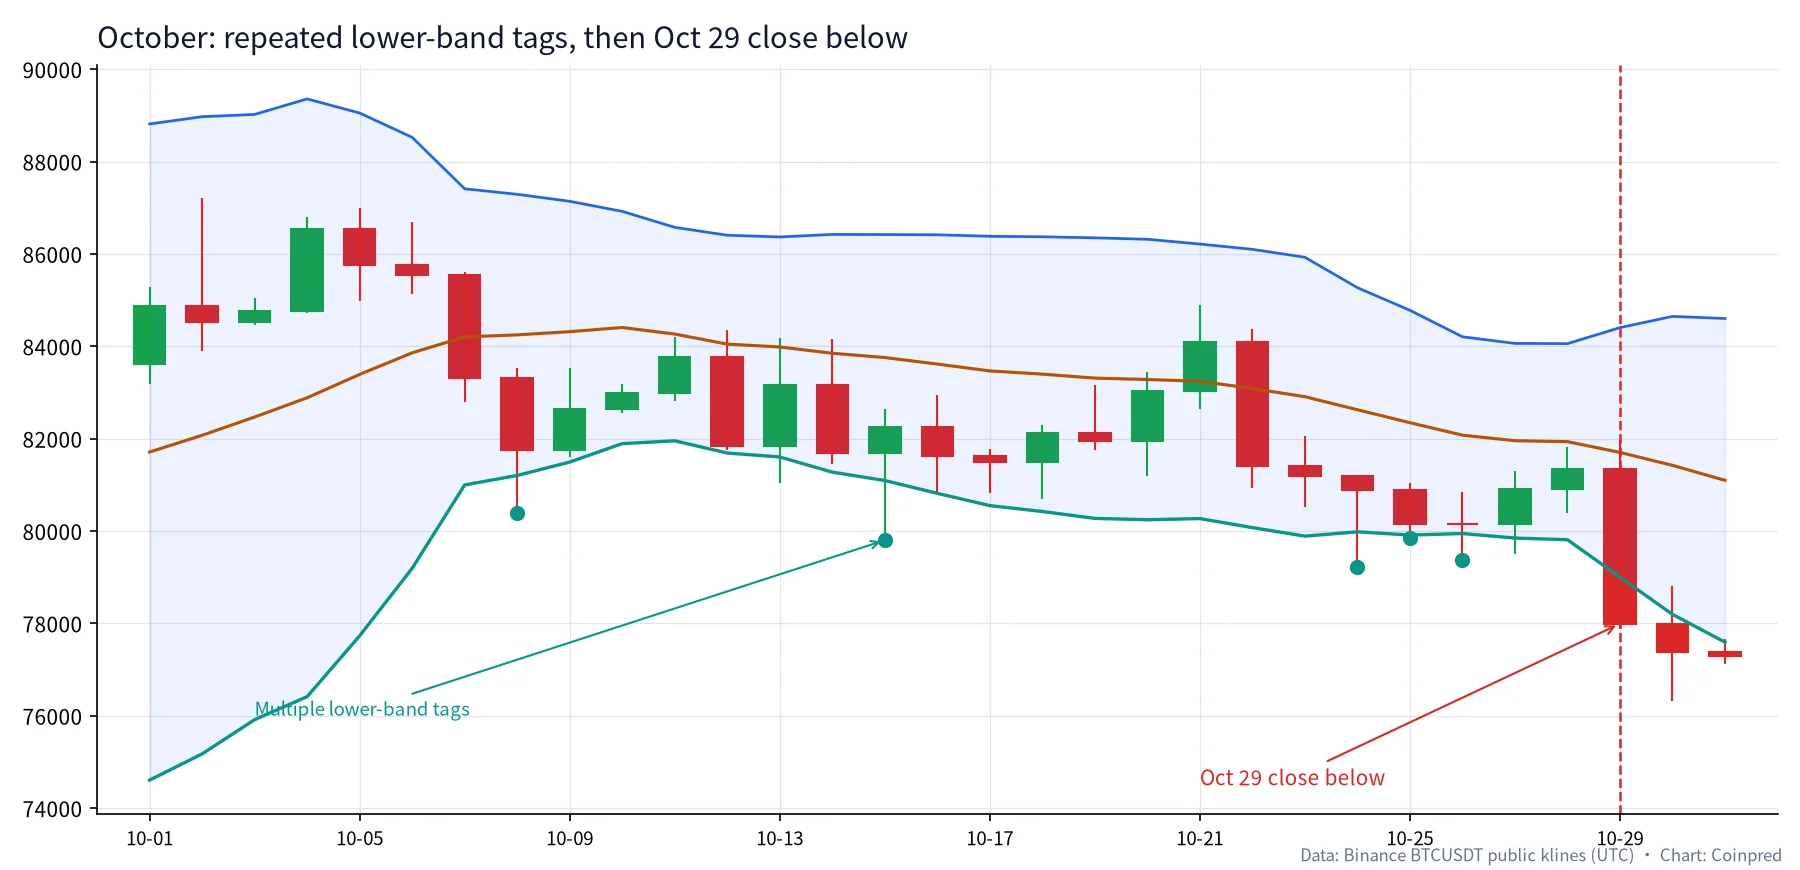
We read it in two layers:
- Early–mid October tags that closed back inside: more like stretch-and-snap attempts inside a high chop — one tag does not prove the floor is sacred. The same weeks were repeatedly testing the 79,800–80,400 support zone.
- October 29’s clear close below the lower band, with the next two days failing to reclaim it: closer to “the volatility channel’s floor gave way,” matching MACD’s late-October break below zero and RSI cooling toward the mid-30s.
Reminder: as of writing, the lower-band break is only a few days old. Whether price reclaims the band is unknowable here. We use it to show what a failed, repeatedly tested rail looks like — not to forecast the next candle.
8. A five-step Bollinger reading habit
Compress it into a daily routine:
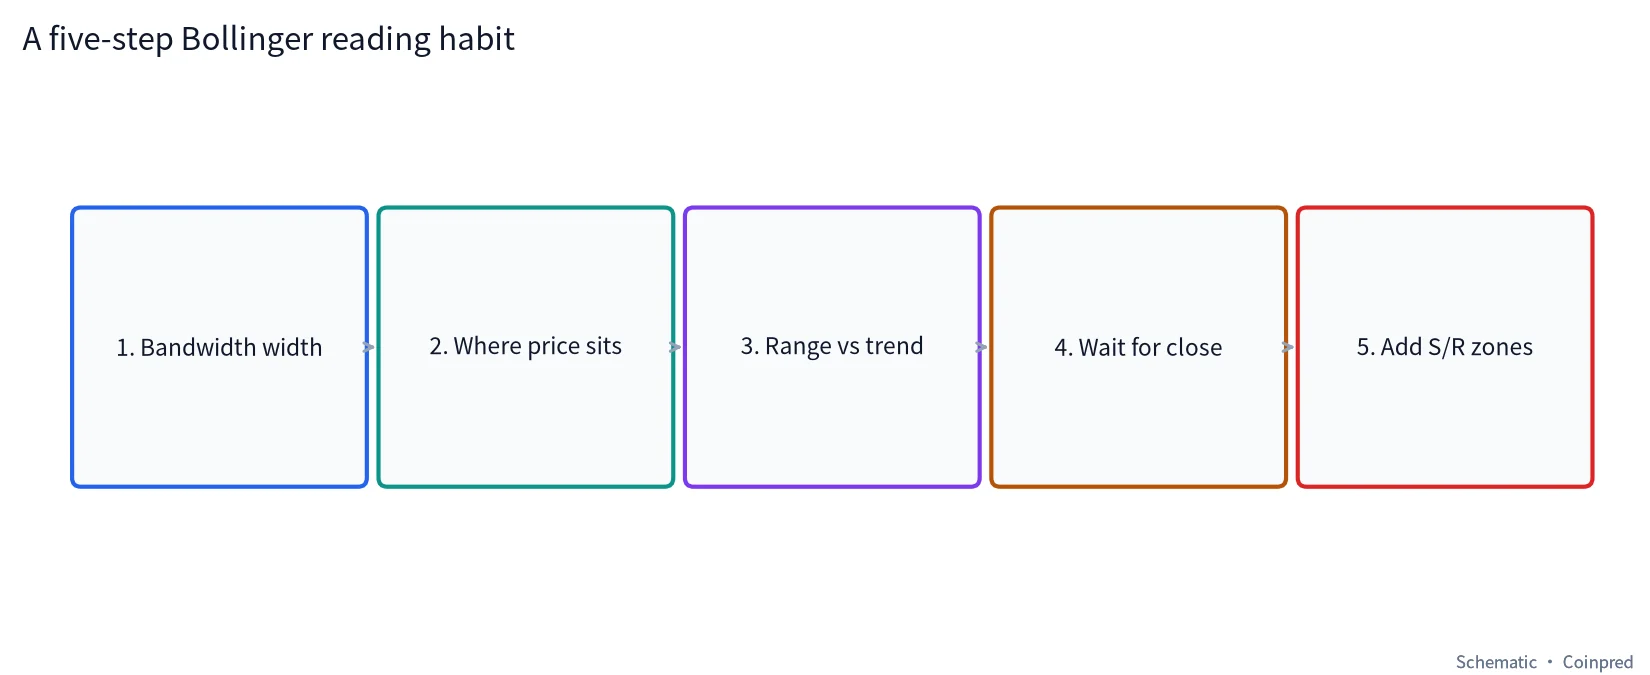
- Bandwidth width: squeezing, expanding, or middling?
- Where price sits: riding upper, riding lower, or coiling around the middle?
- Range or trend: that choice picks mean reversion vs walk-the-band.
- Wait for the close: an intraday spike through a rail is not the same as a closing break.
- Add support/resistance: bands measure volatility; location still needs structure.
9. Beginner traps
- Shorting every upper tag / buying every lower tag — trends will walk the band through you.
- Watching rails but ignoring bandwidth — you miss squeeze alarms and expansion confirmation.
- Treating “2σ” as sacred — some use 1.5 or 2.5; what matters is a fixed rule you can review.
- Forcing a 5-minute squeeze conclusion onto the daily chart — mismatched clocks.
- Ignoring the middle band — it is SMA20; losing/regaining it often matters more than a quick poke of an outer rail.
FAQ
Who invented Bollinger Bands, and why 20 and 2?
John Bollinger introduced them in the 1980s. A 20-day average with two standard deviations is his widely used default — roughly a month of sessions and a conventional coverage band if returns were roughly normal. Convention, not physics.
Does a close above the upper band mean a pullback is due?
Not necessarily. August 19–23 closed above the upper band while the trend kept running. Ask instead: is bandwidth expanding, which way are the averages pointing, and did structure break with volume?
Does a squeeze always lead to a breakout?
Volatility often rises after a squeeze, but direction is open, and false breaks happen. Treat the squeeze as an attention alarm, not an auto-entry.
How do Bollinger Bands differ from Keltner Channels?
Bollinger uses standard deviation; Keltner usually uses ATR. Watching both for a “squeeze” is common, but this article sticks to Bollinger to avoid parameter soup.
After a close below the lower band, is that rail still support?
Once price closes beneath it, the old lower band is usually a zone that must be reclaimed, not automatic support. Whether it is reclaimed depends on later closes — do not assume.
Can I trade a Bollinger-only system?
You can write rules, but separate range vs trend modes and write invalidation clearly. Naked “fade every tag” gets hurt in one-way markets. Every example here is for study and review only — not investment advice.
Should bandwidth be percent or absolute points?
Percent compares better across price levels. A 2,000-point width at 60k is not the same animal at 80k; (upper − lower) / middle stays consistent.
Data and references
- Candle data: Binance public API via data-api.binance.vision, BTCUSDT daily, window 2026-07-01 to 2026-10-31 (UTC); Bollinger(20,2) from closes (population-style 20-day stdev).
- Binance Academy: Bollinger Bands Explained
- Investopedia: Bollinger Band
- Bollinger, John. Bollinger on Bollinger Bands
All charts were drawn by Coinpred from the public data above. Trading involves risk; judge independently and size carefully. This article is educational only and is not investment advice.