Direction gets all the attention. Width usually gets a passing glance, then a stop that was sized in a quiet week gets dropped into a loud one. This sixteenth piece in the Coinpred indicator series is our attempt to put a number on that width. We are the same editorial team behind the rest of the guides on coinpred.com; the authors page carries the same byline.
ATR (Average True Range) does not tell you whether Bitcoin is going up or down. It tells you how much room a recent “normal” day has been taking. That sounds dull until you try to answer a question we get all the time: how do I set an ATR stop on BTC? The honest version of that question is not “which multiple is correct.” It is “how wide is the market right now, and what happens to my dollar risk if that width doubles?”
Every figure below comes from Binance’s public BTCUSDT daily klines, in UTC, with Wilder’s 14-period ATR. The main window is 2026-07-01 through 2026-11-18. 19 November was still trading when we wrote this, so that unfinished session is left out. You can recompute the same series. This is a reading and sizing guide, not a trading system, and it is not investment advice.
1. True Range is the largest of three numbers
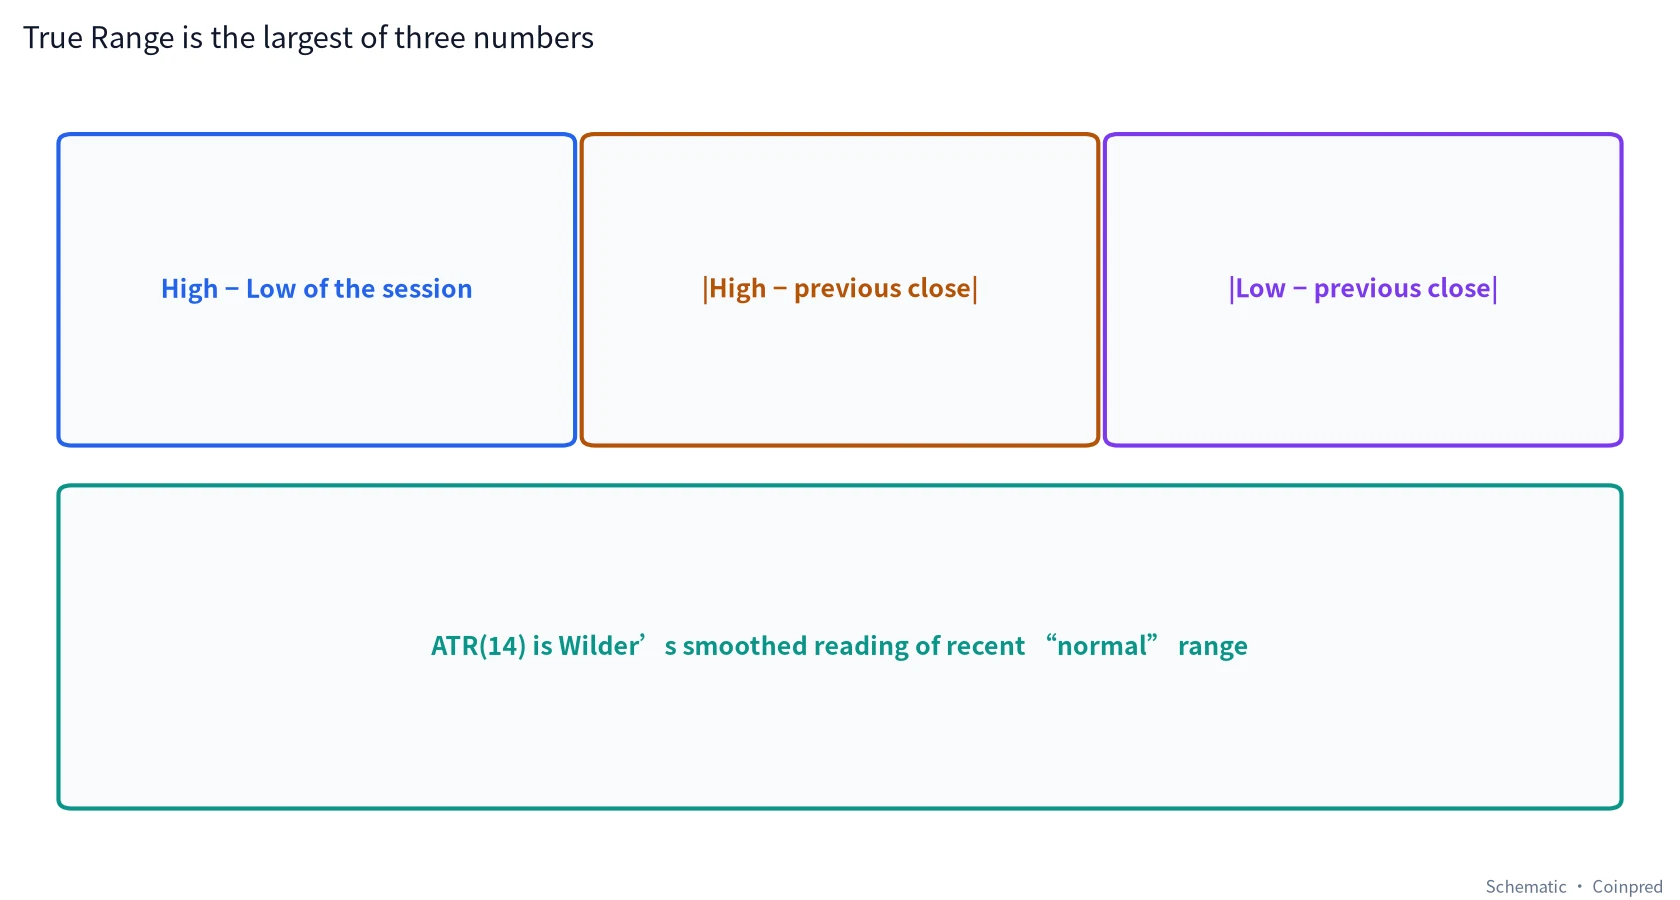
A candle’s high minus its low is the obvious range. It is not always the whole story. If the market gaps, the interesting distance may be from yesterday’s close to today’s extreme. Welles Wilder’s True Range takes the largest of:
- Today’s high − today’s low
- The absolute value of today’s high − yesterday’s close
- The absolute value of today’s low − yesterday’s close
ATR(14) is then a smoothed reading of that True Range. The common convention, and the one we used, is Wilder’s smoothing: the first ATR is a simple average of the first 14 True Ranges, and each day after that is (previous ATR × 13 + today’s TR) / 14. It is slower than a plain 14-day SMA of TR, which is the point. You want a width that does not reinvent itself after a single spike, but does climb when the spikes start to cluster.
Two worked days, because this is easier with real prints than with a formula in the abstract.
On 15 August 2026 BTC opened 63,043.56, high 63,187.98, low 62,920.00, close 63,086.01. The previous close was 63,043.56. The three candidates were about 268, 144, and 124. True Range was therefore only about 268 dollars. That is an unusually tight daily session for this market.
On 19 August, the session that broke the quiet, the numbers were a different species. High 70,000.00, low 64,166.00, previous close 64,725.42. High minus low was 5,834; the gap-style distances were about 5,275 and 559. True Range was 5,834, already several times the ATR then in force (about 1,581 by the close of that day, or roughly 3.69 × ATR).
One more contrast, from the other end of the sample. On 14 November, high 68,446.21, low 63,320.00, previous close 68,314.00. High minus low was about 5,126, and the distance from the previous close down to the low was about 4,994. True Range was 5,126, against an ATR that had already been climbing and closed the day near 2,617 (about 1.96 × ATR), with the close itself down about 6.10%. Same family of “wide day,” completely different neighborhood of the chart.
2. ATR in dollars versus ATR%
An ATR of 2,500 dollars does not mean the same thing at 86,000 that it means at 63,000. That is why we also keep ATR% = ATR / close × 100. In our July–November window the dollar ATR ran from about 1,226 to about 2,724, with a median near 2,177. ATR% ran from about 1.94% to about 4.19%, with a median near 2.76%.
The two series do not always rhyme. In late September, dollar ATR was already elevated — about 2,510 on 21 September, when BTC closed at 86,620 — but ATR% was only about 2.90%, because the price level itself was high. By 18 November, dollar ATR was 2,642, almost the same neighborhood in dollars, yet ATR% had risen to about 4.19%, because the close had fallen to 63,068.22. If you only watch the dollar line, November does not look dramatically “wider” than September. If you watch ATR%, it does.
This is the first practical habit we want: when you compare volatility across weeks that sit at very different price levels, prefer ATR%. When you are measuring a stop in the account’s quote currency, you still need the dollar ATR. Use both. Do not let one pretend to be the other.
3. The July–November picture
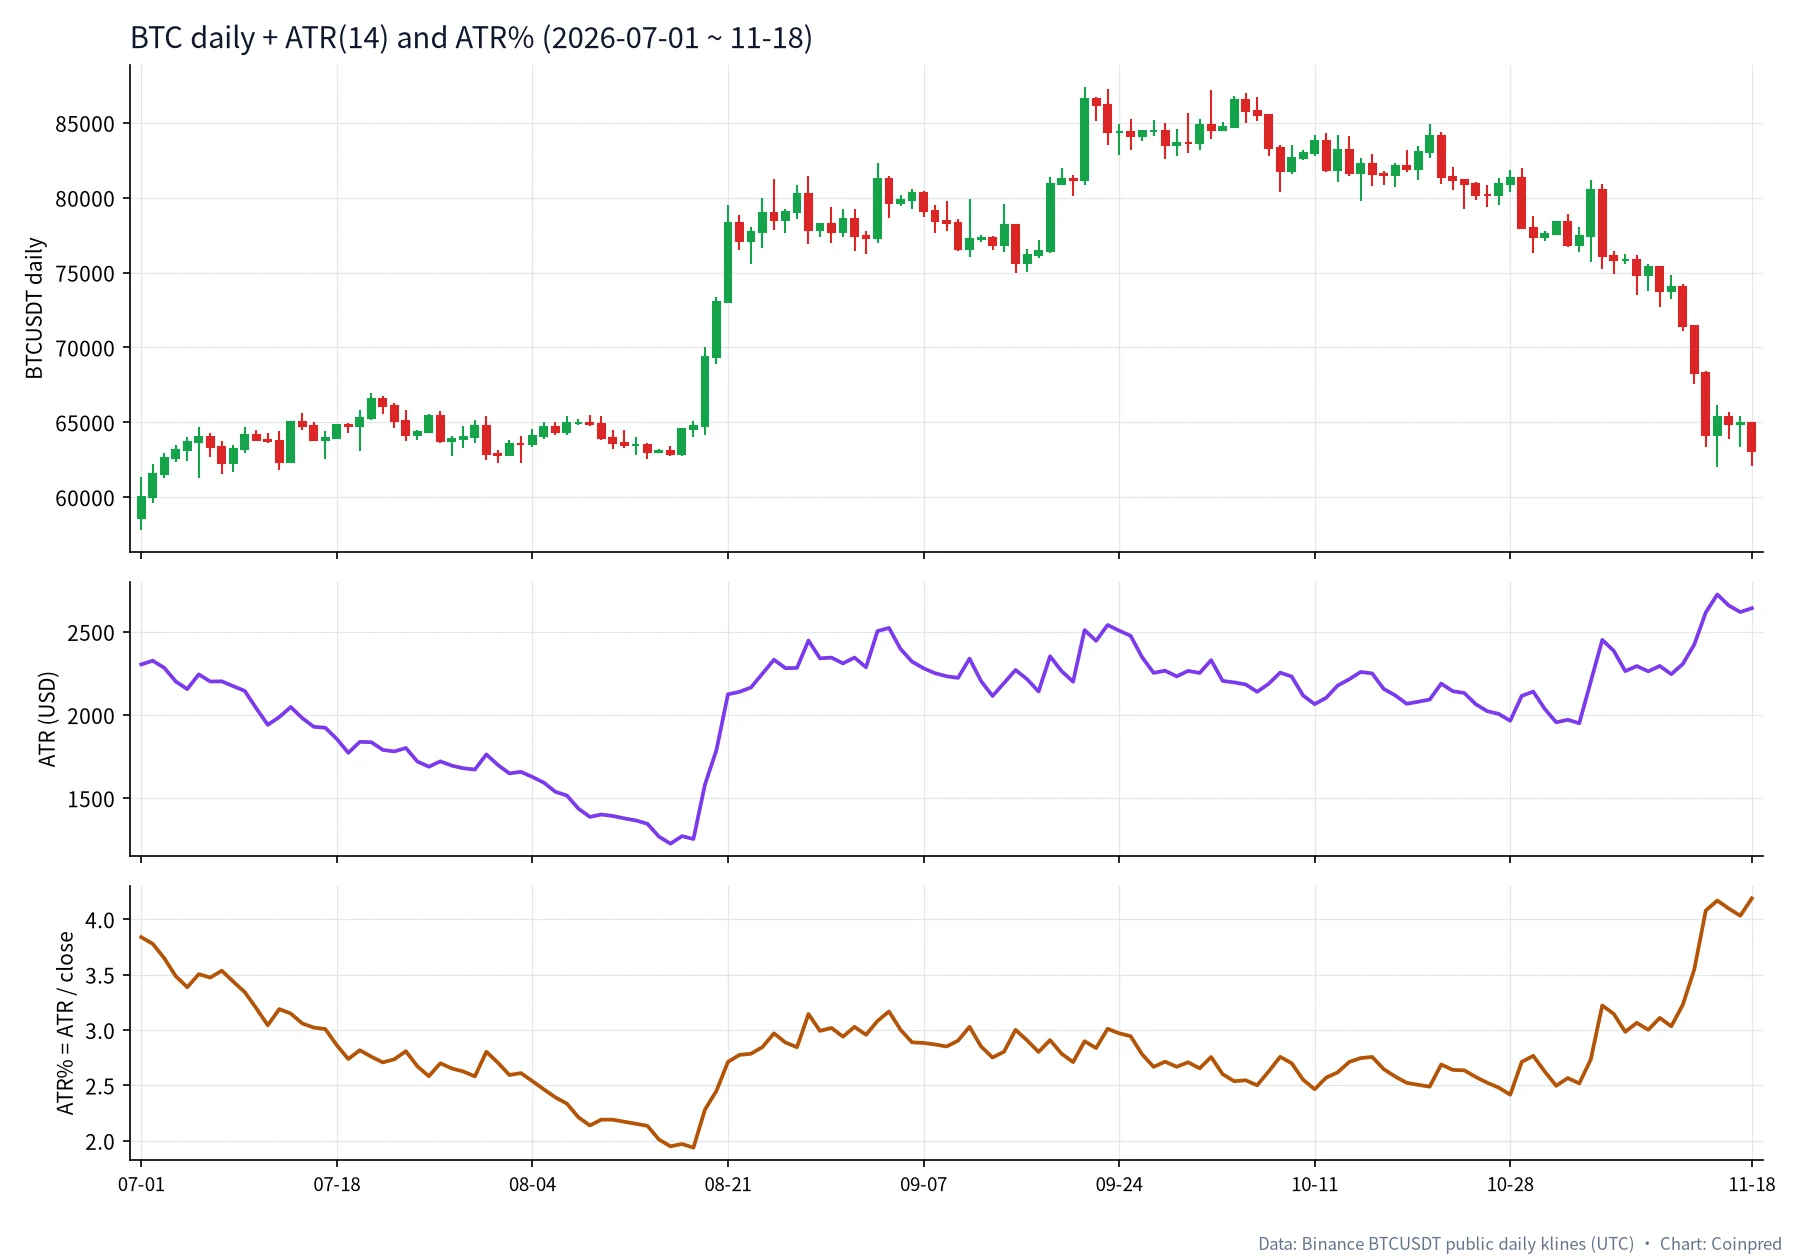
Read the three panes together and the year has a clear breath pattern. July inherited a relatively wide ATR% from June’s decline, still around 3.8% on 1 July when the close was 60,024. Through late July and the first half of August, both dollar ATR and ATR% compressed, bottoming in mid-August. Then 19–21 August forced the dollar ATR off the floor. September and most of October held a mid-range width, even as price made its 21 September high at 87,395.67. Late October and especially November widened again — and this time ATR% widened more than dollar ATR, because price was falling at the same time as the range was opening up.
Bollinger Bands describe a related idea with a different construction: a standard-deviation channel around a moving average. ATR does not care about the average. It cares about how much ground is being covered, including gaps. The mid-August quiet showed up in both tools. That is confirmation of a condition, not a permission slip to buy the first expansion bar.
4. Mid-August: when a day’s True Range shrinks to a few hundred dollars
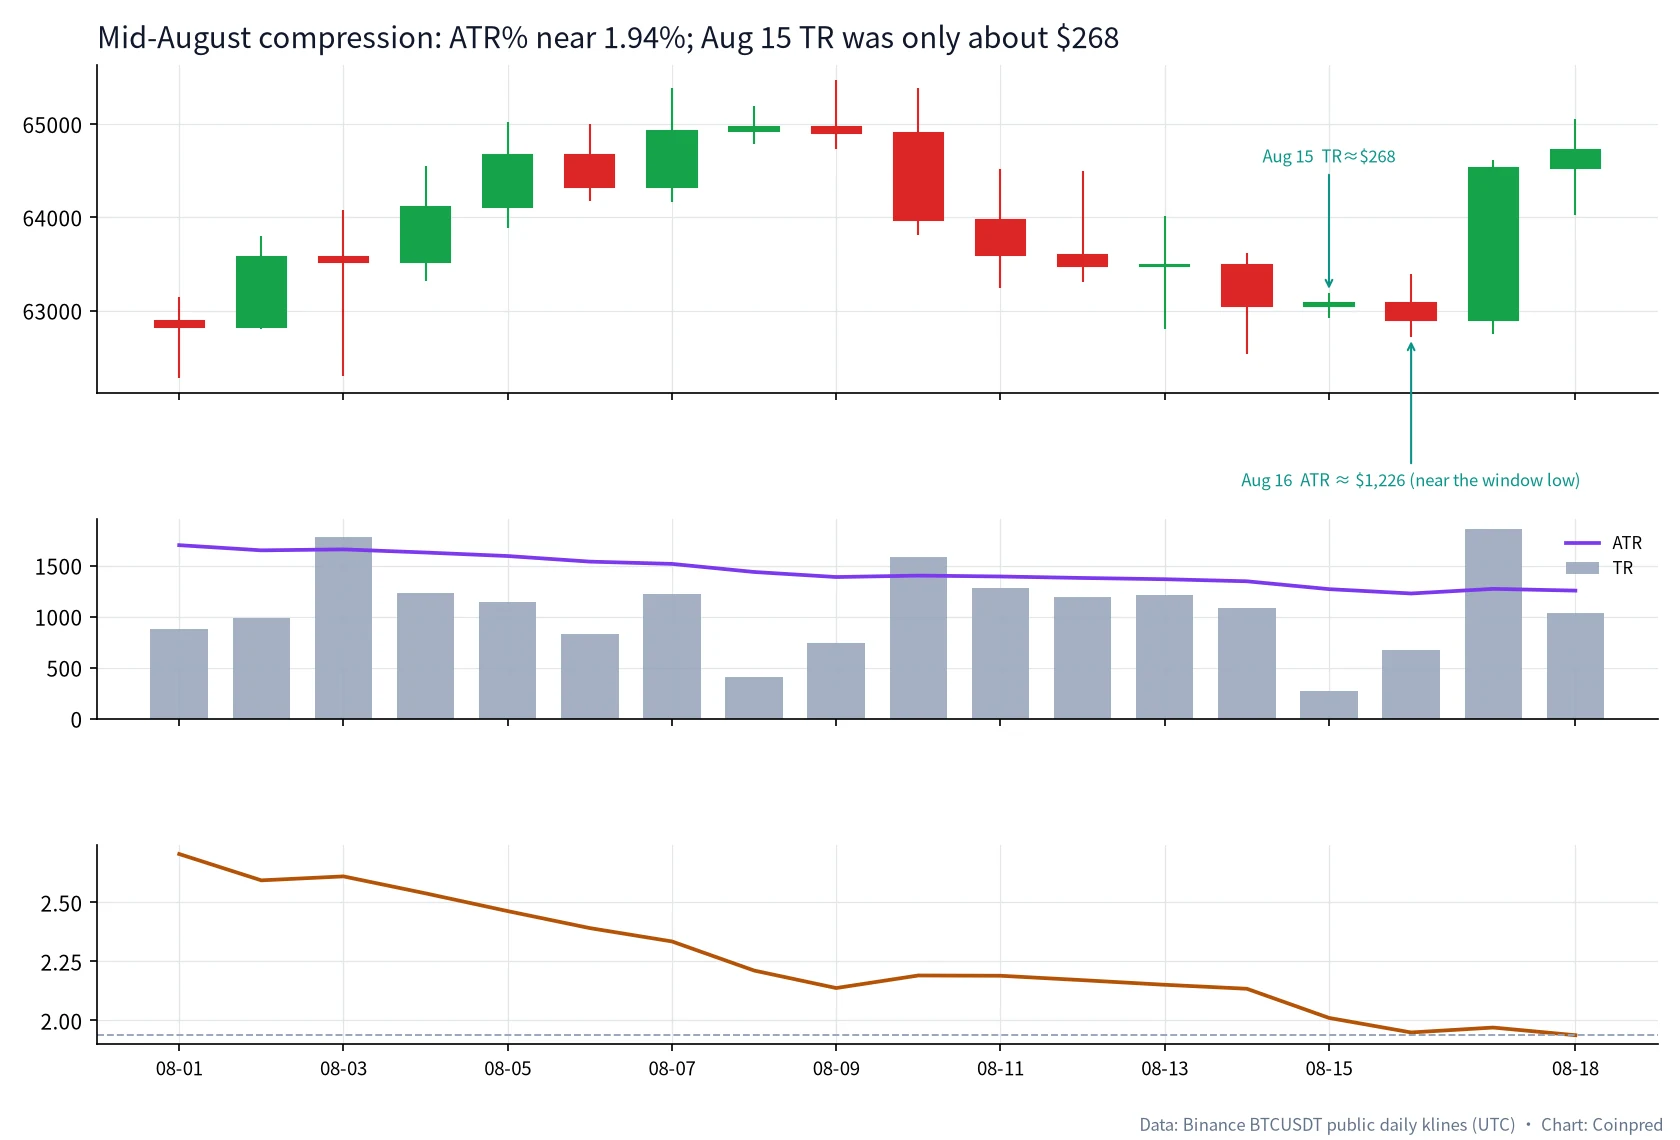
By mid-August the daily tape had gone oddly small. On 16 August, ATR itself printed about 1,226, the lowest dollar ATR in the July–November window. ATR% on 18 August was about 1.94%, the lowest percentage reading in the same window. The 15 August True Range, as we already computed, was only about 268 dollars.
| Date (UTC) | Close | TR | ATR | ATR% | TR / ATR |
|---|---|---|---|---|---|
| 08-14 | 63,043.56 | 1,082 | 1,346 | 2.13% | 0.80× |
| 08-15 | 63,086.01 | 268 | 1,269 | 2.01% | 0.21× |
| 08-16 | 62,900.00 | 674 | 1,226 | 1.95% | 0.55× |
| 08-17 | 64,532.10 | 1,859 | 1,271 | 1.97% | 1.46× |
| 08-18 | 64,725.42 | 1,031 | 1,254 | 1.94% | 0.82× |
We do not treat a compressed ATR as a trade. We treat it as a change in the market’s recent scale. Stops that felt generous in July, when ATR% was still in the mid-3s, would have been oversized relative to mid-August’s actual sessions — and, a few days later, they would have been too tight for the sessions that followed. Compression is a reason to re-measure, not a reason to guess the direction of the next expansion. Our volume notes from the same dates show the other face of that quiet: participation was thin as well as narrow.
5. 19–21 August: three days that were several times “normal”
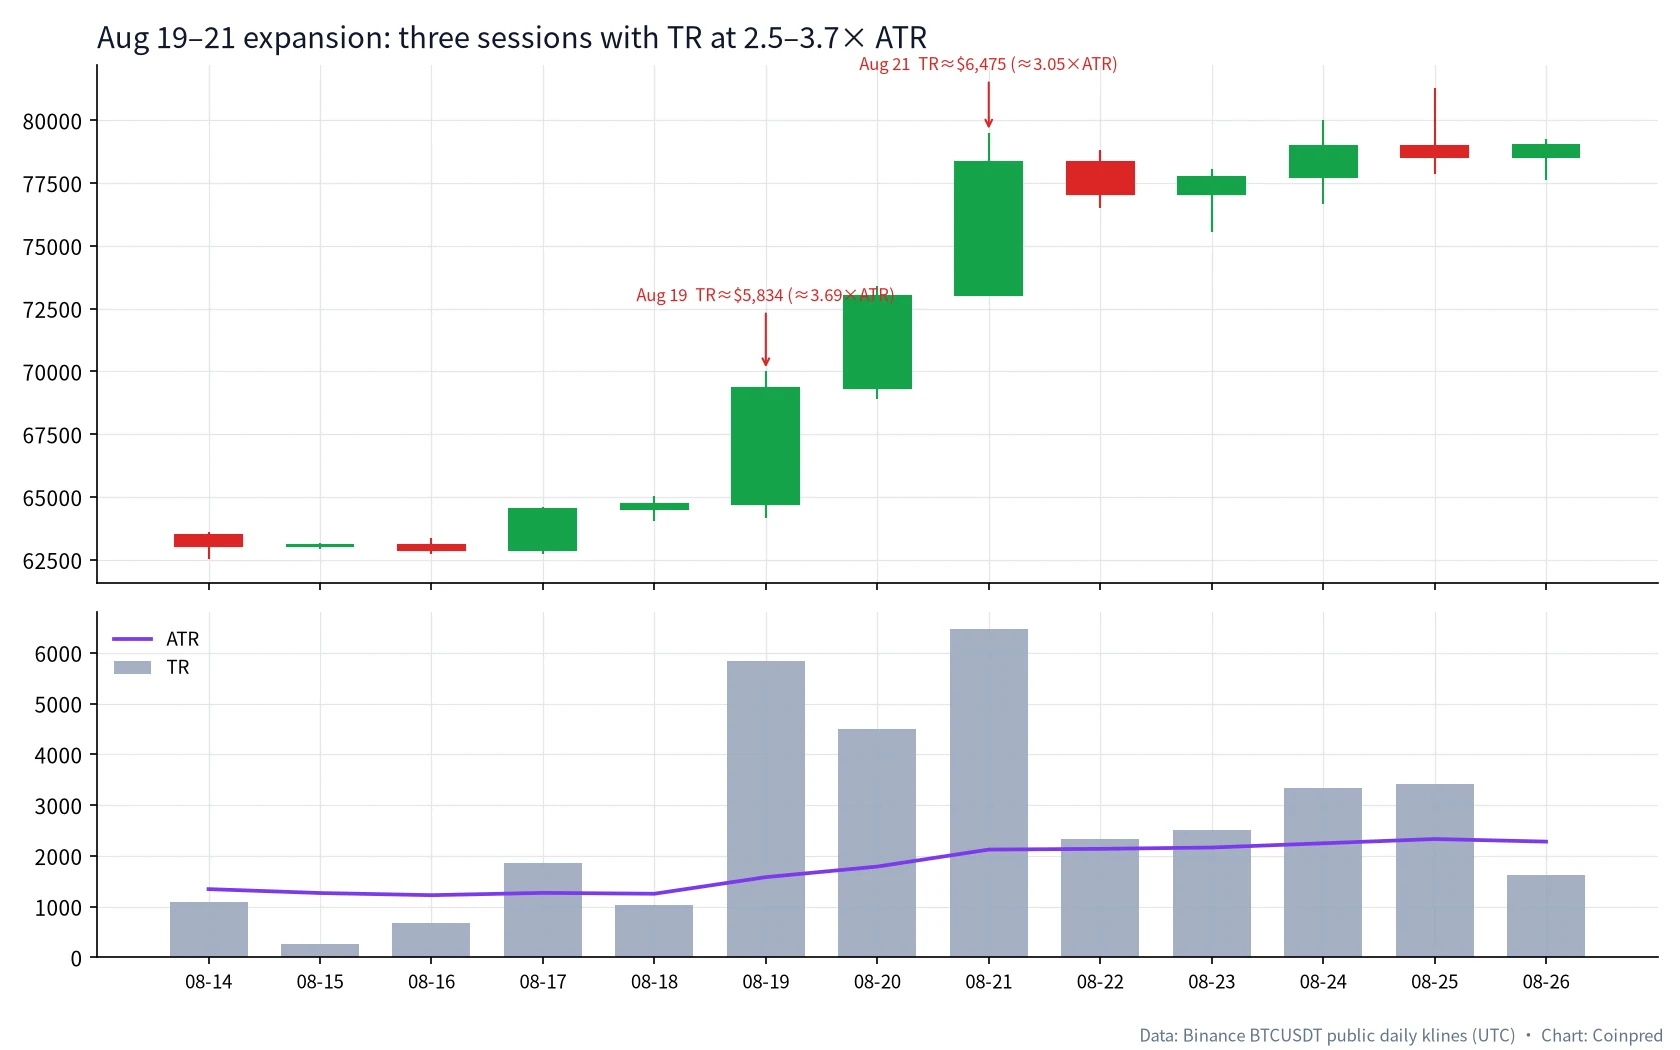
The quiet broke in public. These are the same three sessions our Stochastic companion describes from the oscillator side; here we only care how wide they were.
| Date (UTC) | Open | High | Low | Close | Change | TR | ATR (close) | TR / ATR |
|---|---|---|---|---|---|---|---|---|
| 08-19 | 64,725.42 | 70,000.00 | 64,166.00 | 69,334.79 | +7.12% | 5,834 | 1,581 | 3.69× |
| 08-20 | 69,334.78 | 73,400.00 | 68,902.22 | 73,025.15 | +5.32% | 4,498 | 1,790 | 2.51× |
| 08-21 | 73,027.02 | 79,500.00 | 73,027.02 | 78,338.03 | +7.28% | 6,475 | 2,124 | 3.05× |
Three observations we actually use:
- A single 3×ATR day can be a spike. Three in a row is a regime change. Dollar ATR itself rose from about 1,254 on 18 August to about 2,124 on 21 August. The width of “normal” was rewritten in 72 hours.
- A 1×ATR stop placed from the 18 August close (64,725.42 − 1,254 ≈ 63,471) would have been a very different object from a 1×ATR stop placed from the 21 August close (78,338.03 − 2,124 ≈ 76,214). Same multiple, new market.
- Expansion does not tell you the next day’s direction. 22 August already pulled back, close 77,074.93, with a still-elevated but no longer extreme True Range of about 2,328. The useful carry-forward was the new ATR level, not a slogan about “the trend has started.”
If you also read candlesticks and structure, these three days were a breakout in price terms. ATR’s job was to tell you the cost of being wrong had just gone up.
6. How we think about ATR stops, without turning the multiple into a talisman
“How to set an ATR stop” is the search query. Here is the way we answer it on the Coinpred desk, as a measurement habit, not as an order ticket.
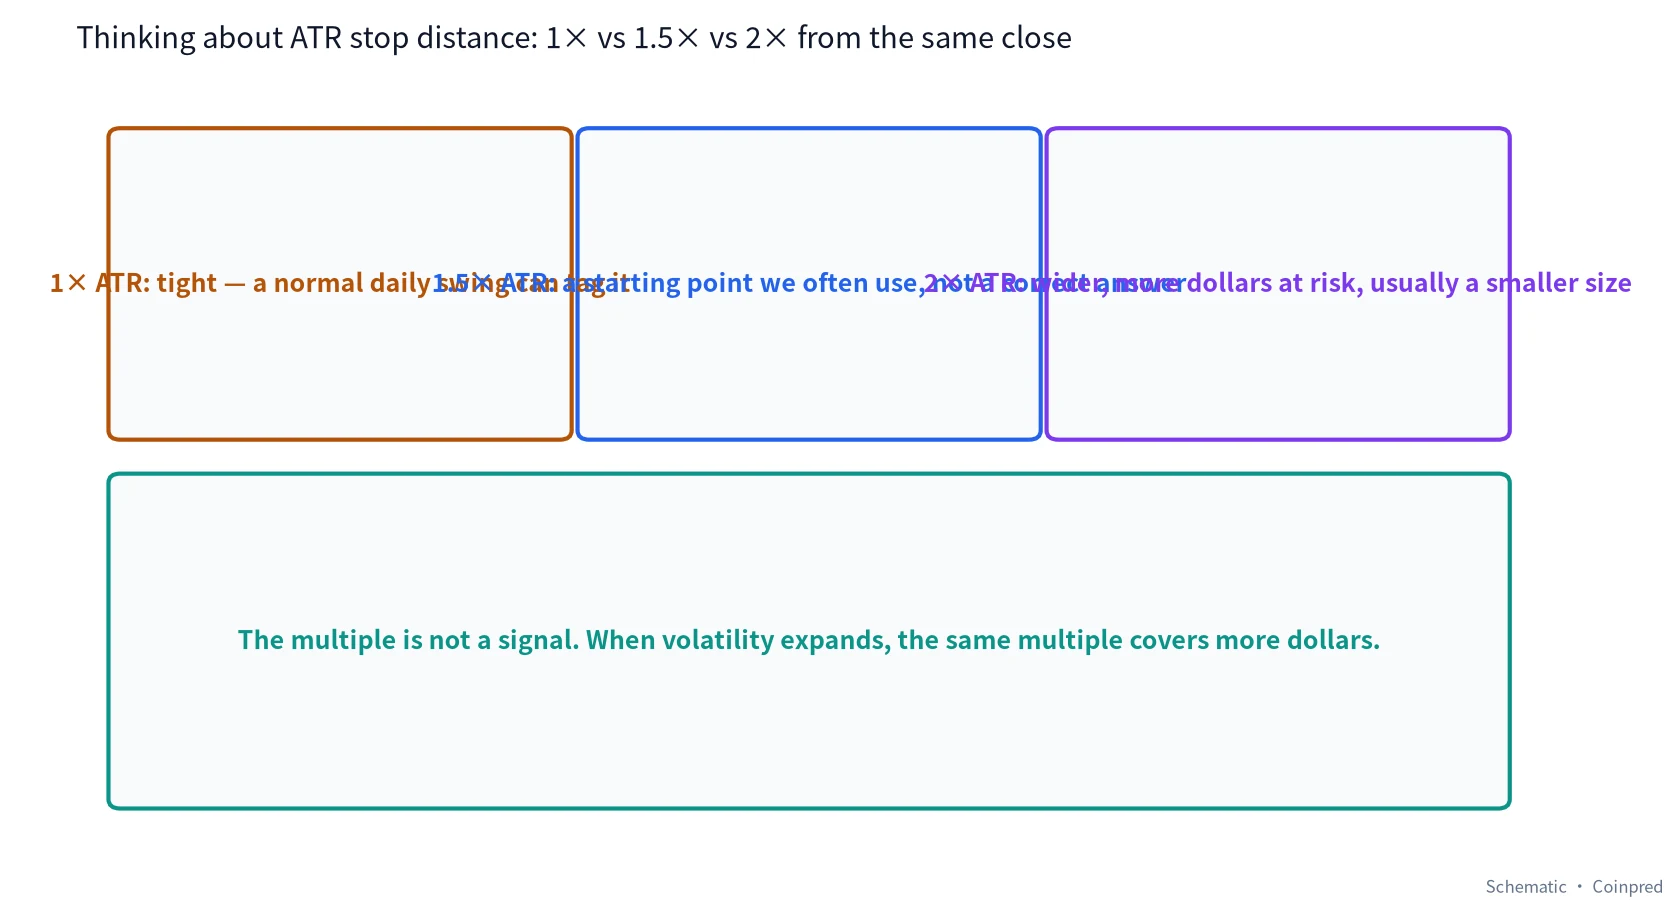
Pick a close, pick a multiple, subtract (for a long) or add (for a short). That is the whole arithmetic. The work is in choosing a multiple that can survive a normal day without being so wide that a single loss dominates the account.
- 1× ATR on BTC daily is tight. Plenty of ordinary sessions have a True Range larger than the current ATR; a stop sitting only one ATR from the close will be tagged by those sessions even when the broader idea is intact.
- 1.5× ATR is the starting point we most often measure from. It is not a correct answer, and it is not a recommendation. It is a distance that, in this sample, usually sits beyond a typical day and still inside a genuinely large one.
- 2× ATR is wider, costs more dollars per unit of size, and therefore usually wants a smaller position if your account risk is supposed to stay constant.
- Some people go to 2.5× or 3×, or trail from a recent swing with an ATR buffer (the family of ideas behind chandelier-style stops and, in a different construction, SuperTrend). Those are still multiples of the same width. They do not become safer just because the number is larger; they become more expensive.
The table below is the part we want you to stare at. Same multiple, different dates, very different dollar and percent distances. The long-stop column is simply close − 1.5 × ATR. It is an illustration of distance, not a historical trade, and not a claim that a stop placed there would or would not have been hit.
| Date (UTC) | Close | ATR | 1× (%, $) | 1.5× (%, $) | 2× (%, $) | Illustrative long stop at 1.5× |
|---|---|---|---|---|---|---|
| 08-16 | 62,900.00 | 1,226 | 1.95% / 1,226 | 2.92% / 1,839 | 3.90% / 2,452 | 61,061 |
| 08-18 | 64,725.42 | 1,254 | 1.94% / 1,254 | 2.91% / 1,881 | 3.88% / 2,508 | 62,844 |
| 08-21 | 78,338.03 | 2,124 | 2.71% / 2,124 | 4.07% / 3,186 | 5.42% / 4,249 | 75,152 |
| 09-15 | 75,644.48 | 2,270 | 3.00% / 2,270 | 4.50% / 3,405 | 6.00% / 4,540 | 72,239 |
| 09-21 | 86,620.00 | 2,510 | 2.90% / 2,510 | 4.35% / 3,765 | 5.80% / 5,021 | 82,855 |
| 10-04 | 86,530.00 | 2,196 | 2.54% / 2,196 | 3.81% / 3,293 | 5.07% / 4,391 | 83,237 |
| 10-29 | 77,991.89 | 2,115 | 2.71% / 2,115 | 4.07% / 3,172 | 5.42% / 4,229 | 74,820 |
| 11-01 | 78,354.00 | 1,956 | 2.50% / 1,956 | 3.74% / 2,933 | 4.99% / 3,911 | 75,421 |
| 11-14 | 64,150.00 | 2,617 | 4.08% / 2,617 | 6.12% / 3,925 | 8.16% / 5,233 | 60,225 |
| 11-18 | 63,068.22 | 2,642 | 4.19% / 2,642 | 6.28% / 3,962 | 8.38% / 5,283 | 59,106 |
Read it once for the dollars, and a second time for the percents. A 1.5× stop on 18 August was about 2.91% of the close, or about 1,881 dollars. The same multiple on 18 November was about 6.28%, or about 3,962 dollars. If you kept the same position size, November would have put more than twice the percent risk — and about twice the dollars — behind the same “1.5× ATR” label. That is the entire lesson, and it is why the search query “how to set an ATR stop” cannot be answered with a single multiple.
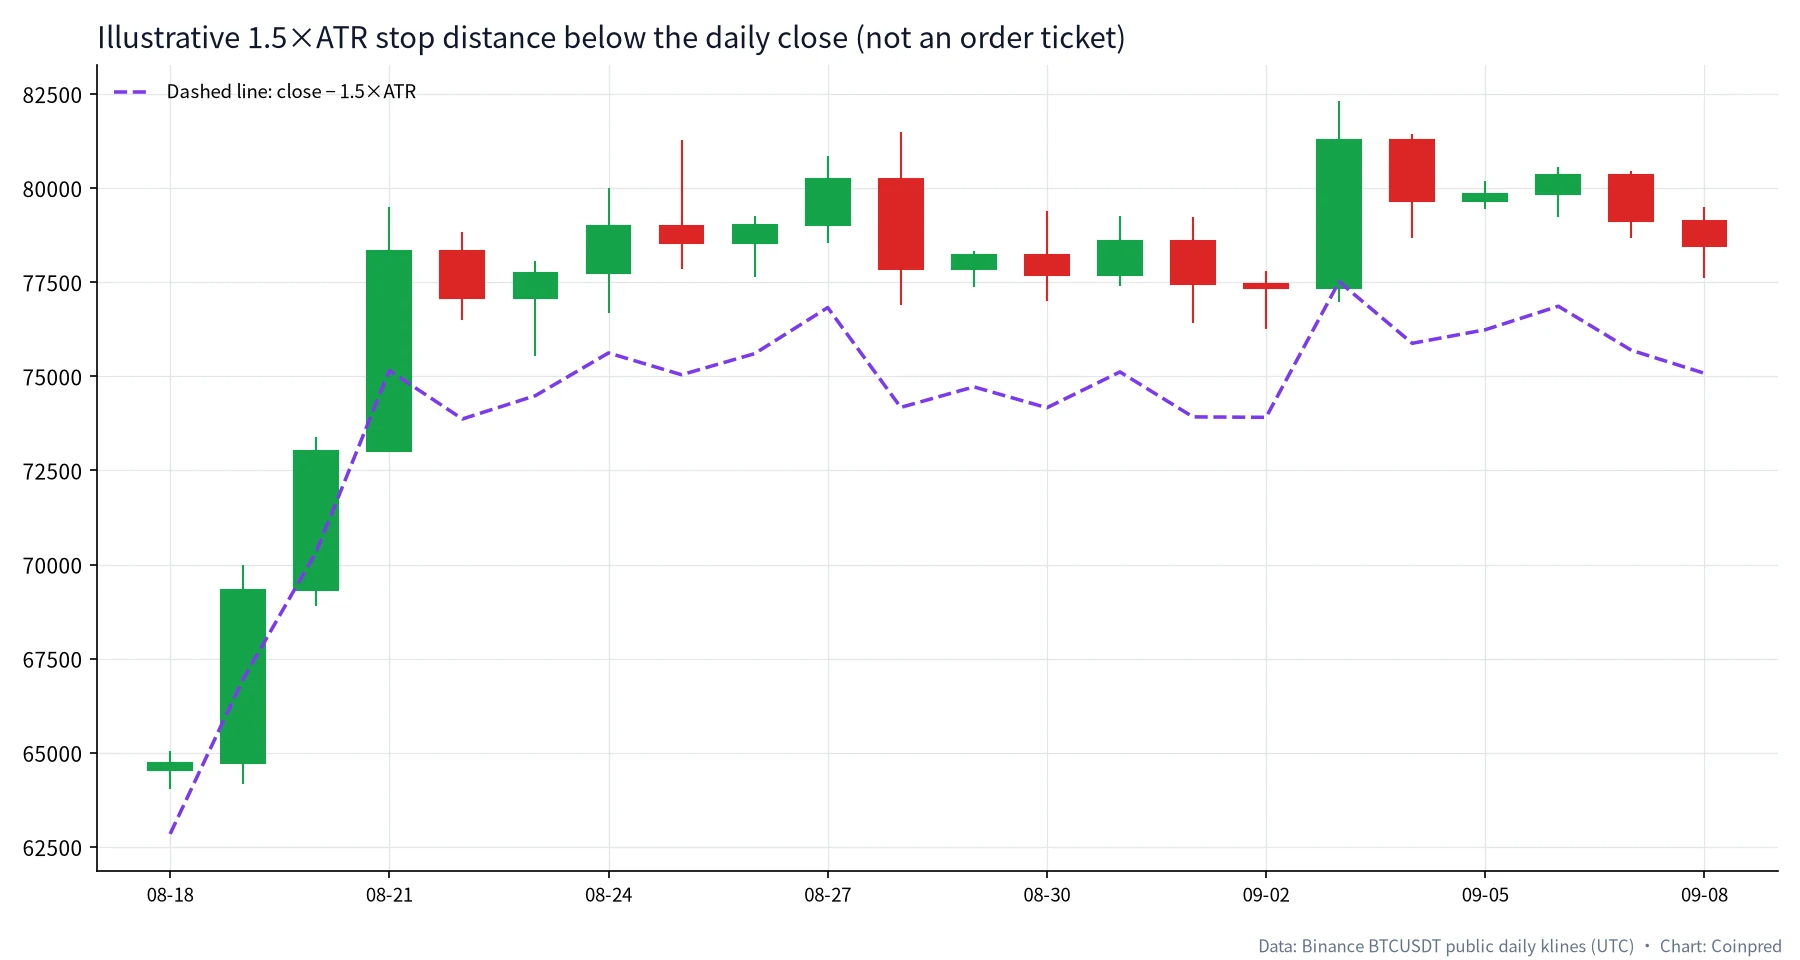
The dashed line on that chart is recomputed each day from that day’s close and that day’s ATR. It is not a trailing stop you would have left in the market from 18 August. We drew it this way on purpose, so nobody walks away thinking we back-tested a system. What it does show is the distance standing under each close during a period when ATR itself was still adjusting after the mid-August expansion. Some sessions’ lows came closer to that line than others. Closeness is a description, not a score.
7. When volatility jumps, cut size — November’s version of the same multiple
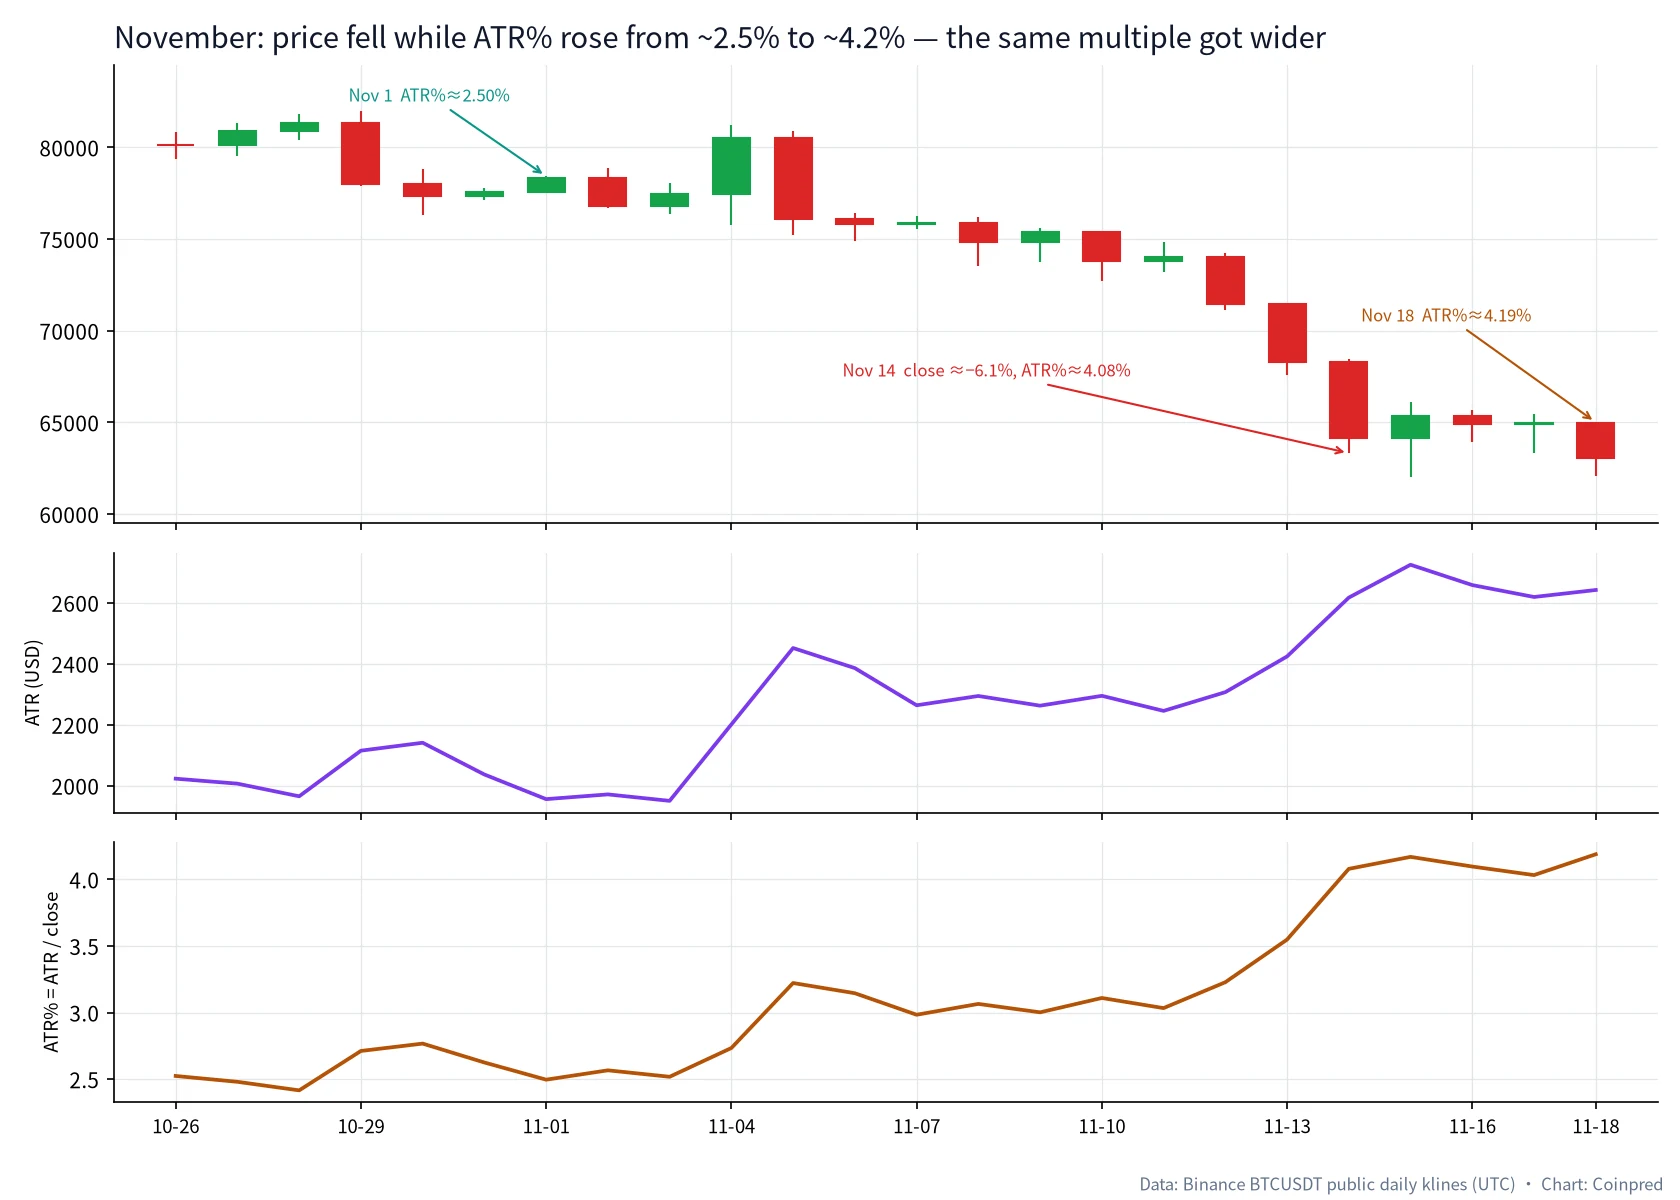
November is the chapter that makes the table above less abstract. On 1 November the close was 78,354.00, ATR about 1,956, ATR% about 2.50%. A 1.5× distance was about 2,933 dollars, or 3.74%. By 14 November the close was 64,150.00, down about 6.10% on the day, ATR about 2,617, ATR% about 4.08%. By 18 November ATR% was about 4.19%, the highest in the July–November sample, with a close of 63,068.22.
A few sessions in between deserve to be named, because they are what “the range opened up” looks like in the raw tape:
- 4 November: +3.94% to 80,504.01, True Range about 5,460 (about 2.48× the then ATR).
- 5 November: −5.49% to 76,088.01, True Range about 5,710 (about 2.33×).
- 13 November: −4.40% to 68,314.00, True Range about 3,946.
- 14 November: −6.10% to 64,150.00, True Range about 5,126.
Our working rule, again a habit rather than a law: when ATR% has clearly stepped into a higher band, we shrink the position so that the dollar risk of the same multiple stays in line with the risk we accepted in the quieter band. We do not “hold the old dollar stop” and hope the market has the courtesy to stay as tight as it was on 1 November. We also do not treat the higher ATR as a reason to chase. Width is not direction. The Stochastic tutorial that sits next to this one shows the same November from the oscillator side: %K spent twelve sessions pinned under 20. The two readings rhyme as a description of a determined, widening decline. Neither one is a buy ticket.
If you already use ATR inside a strategy — several of the open-source scripts we document in the strategy library do, as a stop or a risk unit — read the script’s multiple and its timeframe first. A 1.5× ATR stop on a 4-hour chart is not the same object as a 1.5× ATR stop on the daily. This article is daily only.
8. ATR next to Bollinger, and next to the rest of the Coinpred toolkit
We already mentioned bands. A mid-August Bollinger squeeze and a mid-August ATR compression were the same market spoken in two dialects. Expansion days will often walk a band and print a large TR/ATR multiple at the same time. When they disagree — price pressing a band on a small True Range, or a large True Range that never leaves the middle of the bands — we slow down and look at the close and at volume.
On the Coinpred terminal, ATR is one of the twelve indicators we assemble as context for a JEV analysis. That does not turn ATR into a direction call, and the model’s confidence number is still not a win rate. It means that when we sit down to read the daily, we measure width the same way we measure moving averages or oscillators: as a piece of context, by hand, before we ask a model to restate the same public tape. The how-to-use guide is the workflow; this article is the width chapter.
9. A five-step ATR habit
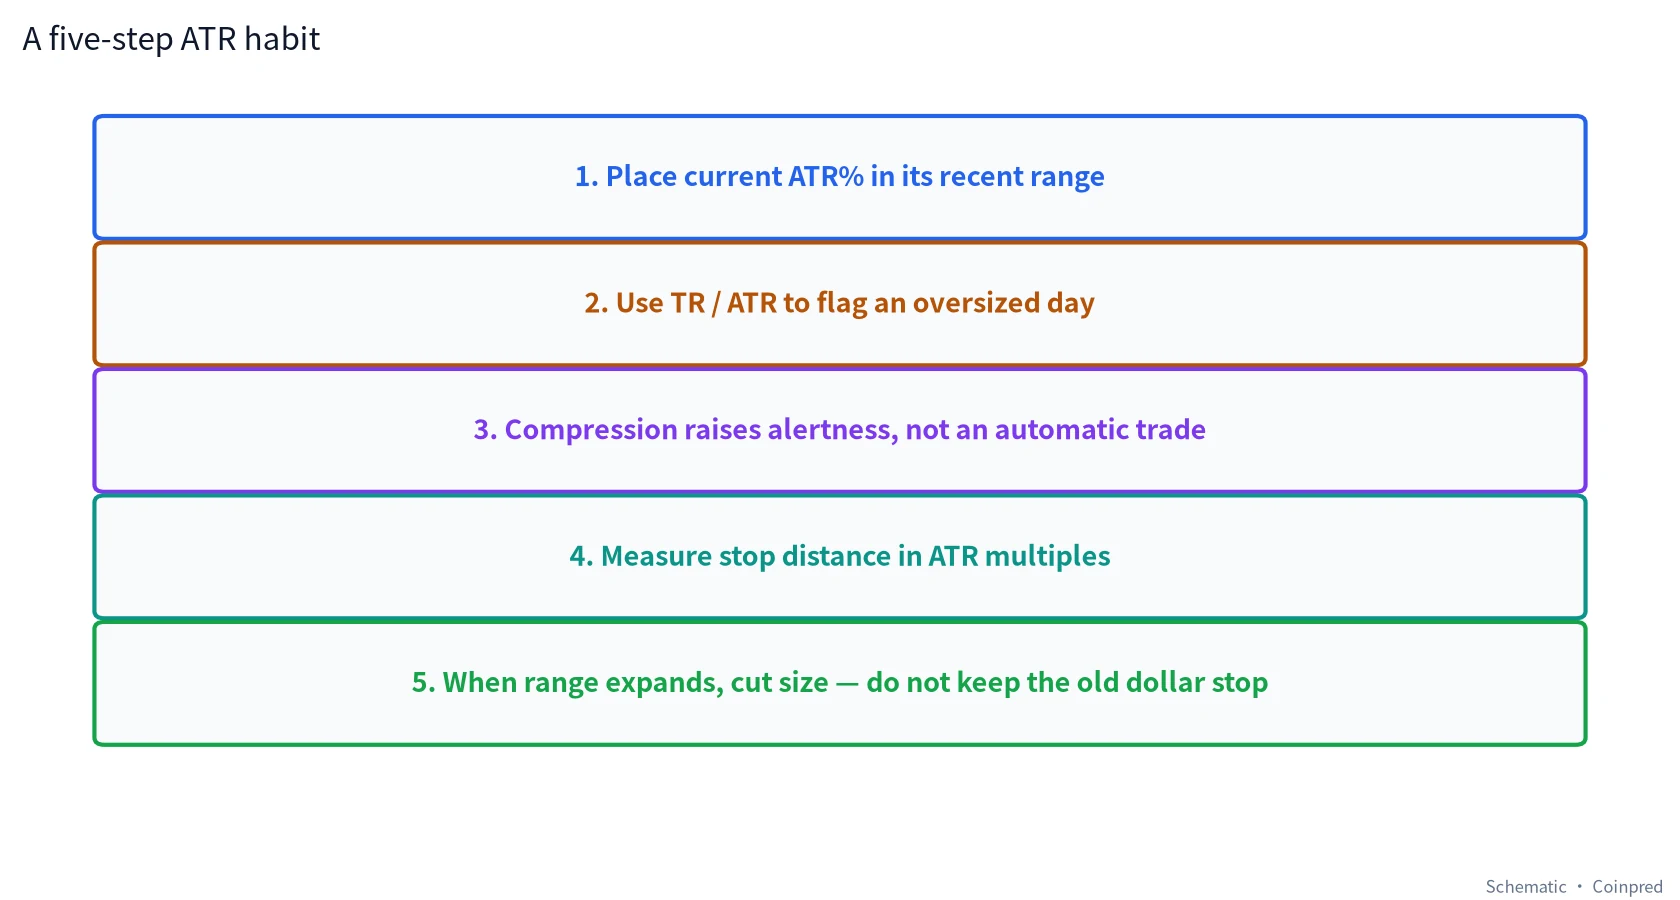
- Place today’s ATR% in its recent range. Is it near a multi-week low, as in mid-August at about 1.94%, or near a local high, as on 18 November at about 4.19%?
- Use TR / ATR to flag an oversized day. We pay attention once a session’s True Range starts clearing about 2× the current ATR, and we treat a cluster of those days as a possible regime change, not as one noisy bar.
- Treat compression as a reason to re-measure, not as a trade. A 268-dollar True Range is information about scale. It is not a forecast of the next 7% day.
- Measure stop distance in ATR multiples, and write the multiple down. 1.5× is where we often start the measurement. It is not a certified answer.
- When the range expands, cut size so that dollar risk stays honest. Do not keep the old dollar stop just because you liked the number last month.
10. Traps that show up as soon as the width changes
- Using ATR as if it had a direction. It does not.
- Setting a 1× daily stop on BTC and being surprised when an ordinary session tags it.
- Copying a 1.5× multiple from a 15-minute chart onto the daily, or the other way around.
- Watching only dollar ATR while the price level has moved a long way, as in September versus November.
- Leaving a stop unchanged in dollars after ATR has clearly stepped higher.
- Treating a single 3×ATR spike as a new regime, or ignoring three of them in a row.
- Shopping lookbacks (7, 14, 21) until the stop “would have lived.” We used 14 throughout and we are sticking to it for this review.
- Confusing this measurement with a back-tested edge. The dashed line in section 6 is not a track record.
FAQ
How is crypto ATR calculated, and why 14?
We used Wilder’s 14-period ATR: True Range as the max of the three distances above, first value equal to the average of the first 14 TRs, then the running (prev × 13 + TR) / 14. Fourteen is Wilder’s original default and the number most BTC daily charts still open with. A 7-period ATR will turn faster; a 21-period ATR will turn slower. There is no official “Bitcoin 14.” There is a decision to stay with one number long enough that mid-August and mid-November remain comparable.
How do I set an ATR stop on BTC? Is 1.5× the right multiple?
There is no right multiple. On this daily sample, 1× is tight, 1.5× is the distance we most often measure, and 2× is a wider, more expensive choice that usually wants a smaller size. The November row in the table is the warning: the same 1.5× that was about 3.7% of the close on 1 November was about 6.3% on 18 November. Write the multiple down, recompute the dollar distance when ATR% changes bands, and do not treat the label “1.5× ATR” as a talisman.
Should I use ATR or ATR% when the price of Bitcoin has moved a lot?
Both. ATR% is the fairer comparison across weeks that sit at very different price levels. Dollar ATR is what actually hits the account if you measure a stop in USDT. September’s dollar ATR was already high; November’s ATR% was the one that really stepped out of band.
What counts as a “large” day versus the current ATR?
We have no statute. In our own notes we raise attention around 2× and treat a cluster of 2.5×–3.5× days — 19–21 August, or the early- and mid-November down sessions — as a possible change in width, not as a one-off. A single spike can fade. Three wide sessions in a row usually rewrite the ATR itself.
Does a compressed ATR, like mid-August at about 1.94%, predict a breakout?
No. It predicts that the recent scale has been small. The next expansion can go either way, or it can fail to arrive for longer than you would like. Mid-August did expand, spectacularly, but that is a historical sequence, not a law. Pair the compression with structure and volume; do not let ATR% alone launch the trade.
How is ATR different from Bollinger bandwidth?
Bollinger width is the distance between bands built from a moving average and a standard deviation of closes. ATR is a smoothed True Range, and True Range includes gap-style distances from the prior close. They often go quiet together and wake up together. When they do not, we look at the close and at volume rather than picking a winner.
Can I trail a stop by ATR, the way chandelier or SuperTrend ideas do?
You can, and many published scripts do, including some we have documented as open-source walkthroughs. A trailing construction still inherits the width of the ATR you feed it, and it still needs a timeframe and a multiple. We are not back-testing one here. If you trail, recompute when the regime changes, and remember that a trail can also take you out of a move that is merely noisy, not finished.
Does ATR tell me anything about position size?
It should. If you risk a fixed fraction of the account per idea, the position size is roughly account risk / (multiple × ATR) in units of the asset. When ATR doubles, size halves, if the risk fraction is supposed to stay put. That arithmetic is the reason we keep repeating “cut size when the range expands.” It is not a slogan about bravery.
Is the ATR on a 4-hour BTC chart comparable to this daily ATR?
Only after you admit they are different clocks. The 14-bar ATR on a 4-hour chart is a two-and-a-third-day window of 4-hour ranges, not a 14-day Wilder average of daily True Ranges. A 1.5× stop on that clock will sit closer to the market. This article’s dates and percentages are daily only.
Does a widening ATR change a JEV reading or an event-contract view?
Only as context. ATR does not vote on direction, and an event contract still has its own expiry and settlement rules — see the BTC event contract guide if that is the product you are studying. JEV’s confidence is not a win rate. A wider ATR can, at most, remind you that the same directional opinion now travels with a larger typical range. That is a sizing problem, not a settlement forecast.
Data and references
- Klines: Binance public API, BTCUSDT daily, UTC, primarily 2026-07-01 to 2026-11-18. The 19 November session was still open at the time of writing and is excluded as an unfinished day.
- Indicator: Wilder ATR(14); True Range as the maximum of high−low, |high−prior close|, and |low−prior close|; ATR% = ATR / close × 100.
- Average True Range was introduced by J. Welles Wilder Jr. in New Concepts in Technical Trading Systems (1978). The implementation above follows the common Wilder smoothing used on most crypto daily charts.
- Neighboring pieces in this Coinpred series: candlesticks, support and resistance, moving averages, RSI, MACD, Bollinger Bands, volume, Fibonacci, and the companion Stochastic tutorial.
All charts were drawn by Coinpred from the public data above. If a date or a figure does not recompute, write to us through the authors page or the contact route listed there (@xbluev). Trading involves risk — decide independently and size carefully. This article is educational only and is not investment advice. Coinpred is not available to users in mainland China.