On coinpred.com this is the twenty-second piece in our indicator tutorial series. We are the Coinpred editorial team — the same group that maintains the guides and the author page. We have already written about Bollinger Bands, whose width comes from the standard deviation of closes, and about ATR, which asks how wide a typical day is. One more tool still gets drawn on top of Bollinger Bands and read as if it were the same envelope: a moving-average midline whose width is true range, not standard deviation.
That is Keltner Channels. In many charting packages the defaults are a 20-day EMA midline, a 10-day ATR, and a multiplier of 2, and those are the settings used throughout this article so the figures are checkable. The picture looks like a ribbon around the average: the midline follows the close, and the bands widen or contract with volatility. The usual mistake is not the formula. It is writing a narrow channel as if a breakout were due, or treating one close above the upper band as a reason to chase.
Every figure below is computed from Binance’s public BTCUSDT daily klines, in UTC. The EMA is seeded with a 20-day simple average, then updated with the usual 2÷21 smoothing factor; ATR is Wilder-smoothed, the same method we used in the ATR note, only the period is 10. For comparison, Bollinger Bands here use a 20-day simple average plus or minus two sample standard deviations. The main window is 2026-07-01 through 2026-11-21. 22 November was still trading when we drafted this, so that unfinished session is not treated as a complete day. You can download the same series and recompute. This is a reading guide, not a trading system, and it is not investment advice.
1. Write down the midline and the width, then decide what to read
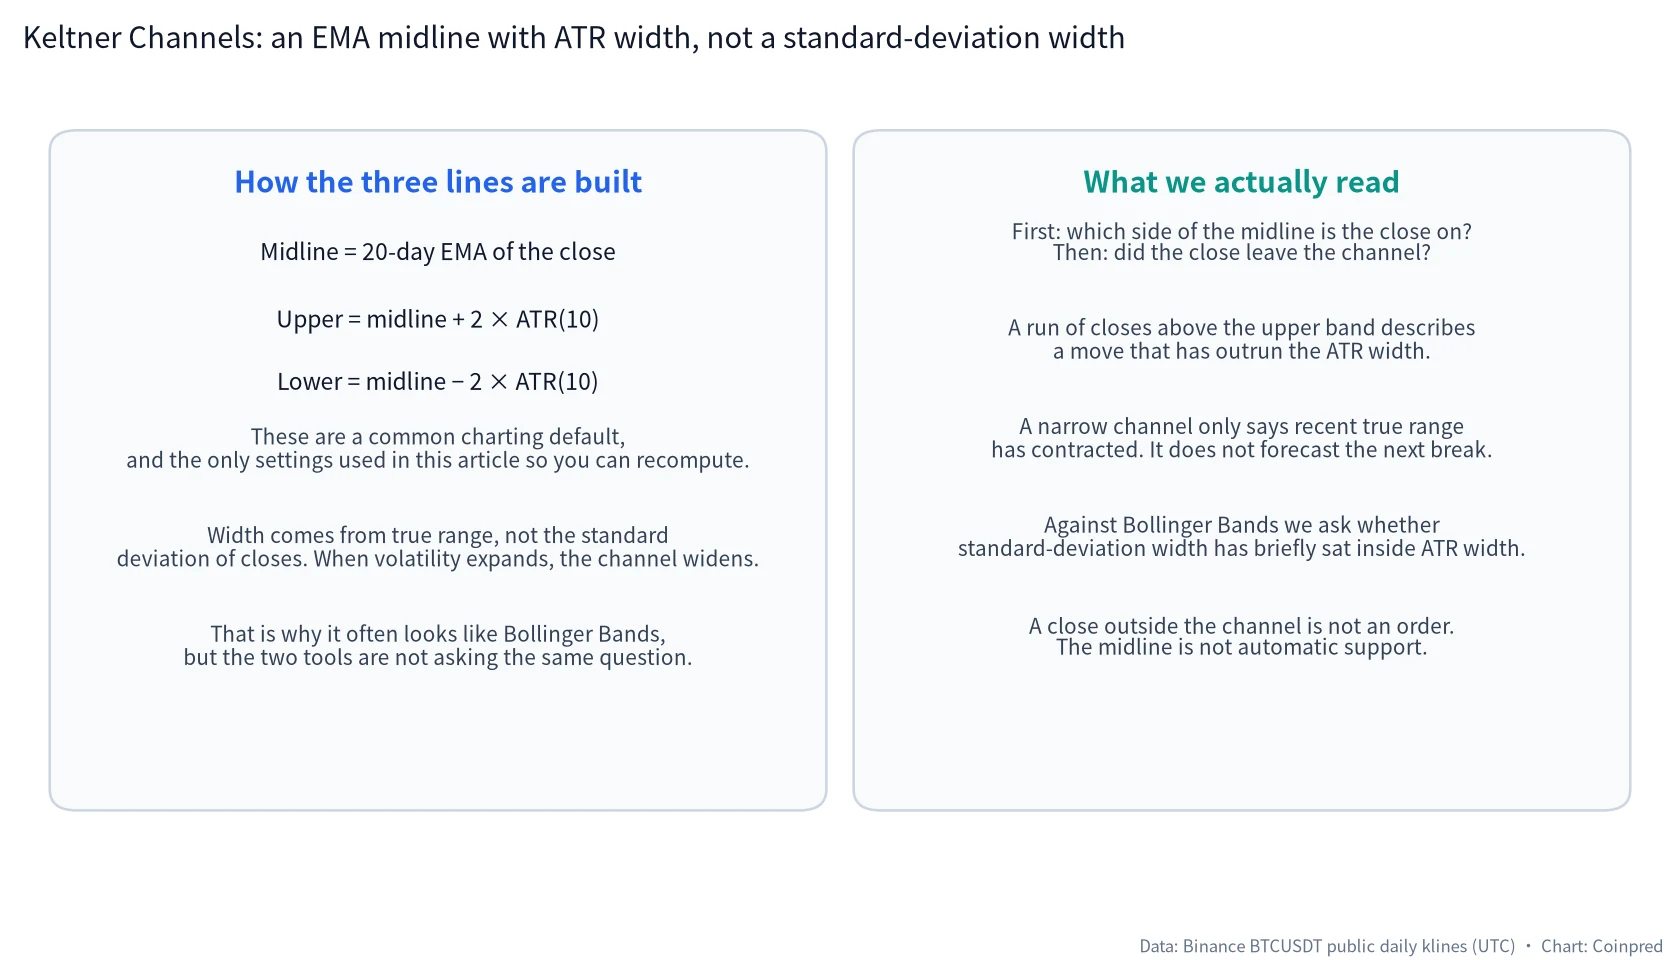
The three lines are short enough to write out, so every later figure can be recomputed:
Midline = 20-day exponential moving average of the close
Upper band = midline + 2 × ATR(10)
Lower band = midline − 2 × ATR(10)
The midline is a moving average, not automatic support. A close above or below it is a location first. The width comes from true range, so a day with a wide high-low range pulls the channel open, and a quieter stretch lets it tighten.
The difference from Bollinger Bands is not “whether it looks like a channel.” It is the question the width is asking. Bollinger Bands ask how far closes have moved from a 20-day average, using standard deviation. Keltner Channels ask how much room two times the 10-day true range leaves around a 20-day exponential average. You can draw both on the same chart. You should not treat a break of one as proof of the other.
We mainly read three things: which side of the midline the close is on; whether a run of closes has left the channel; and whether the width itself has clearly contracted or expanded. A wick through a band, and a close beyond that band, do not carry the same weight.
2. Start with the whole window from July to November
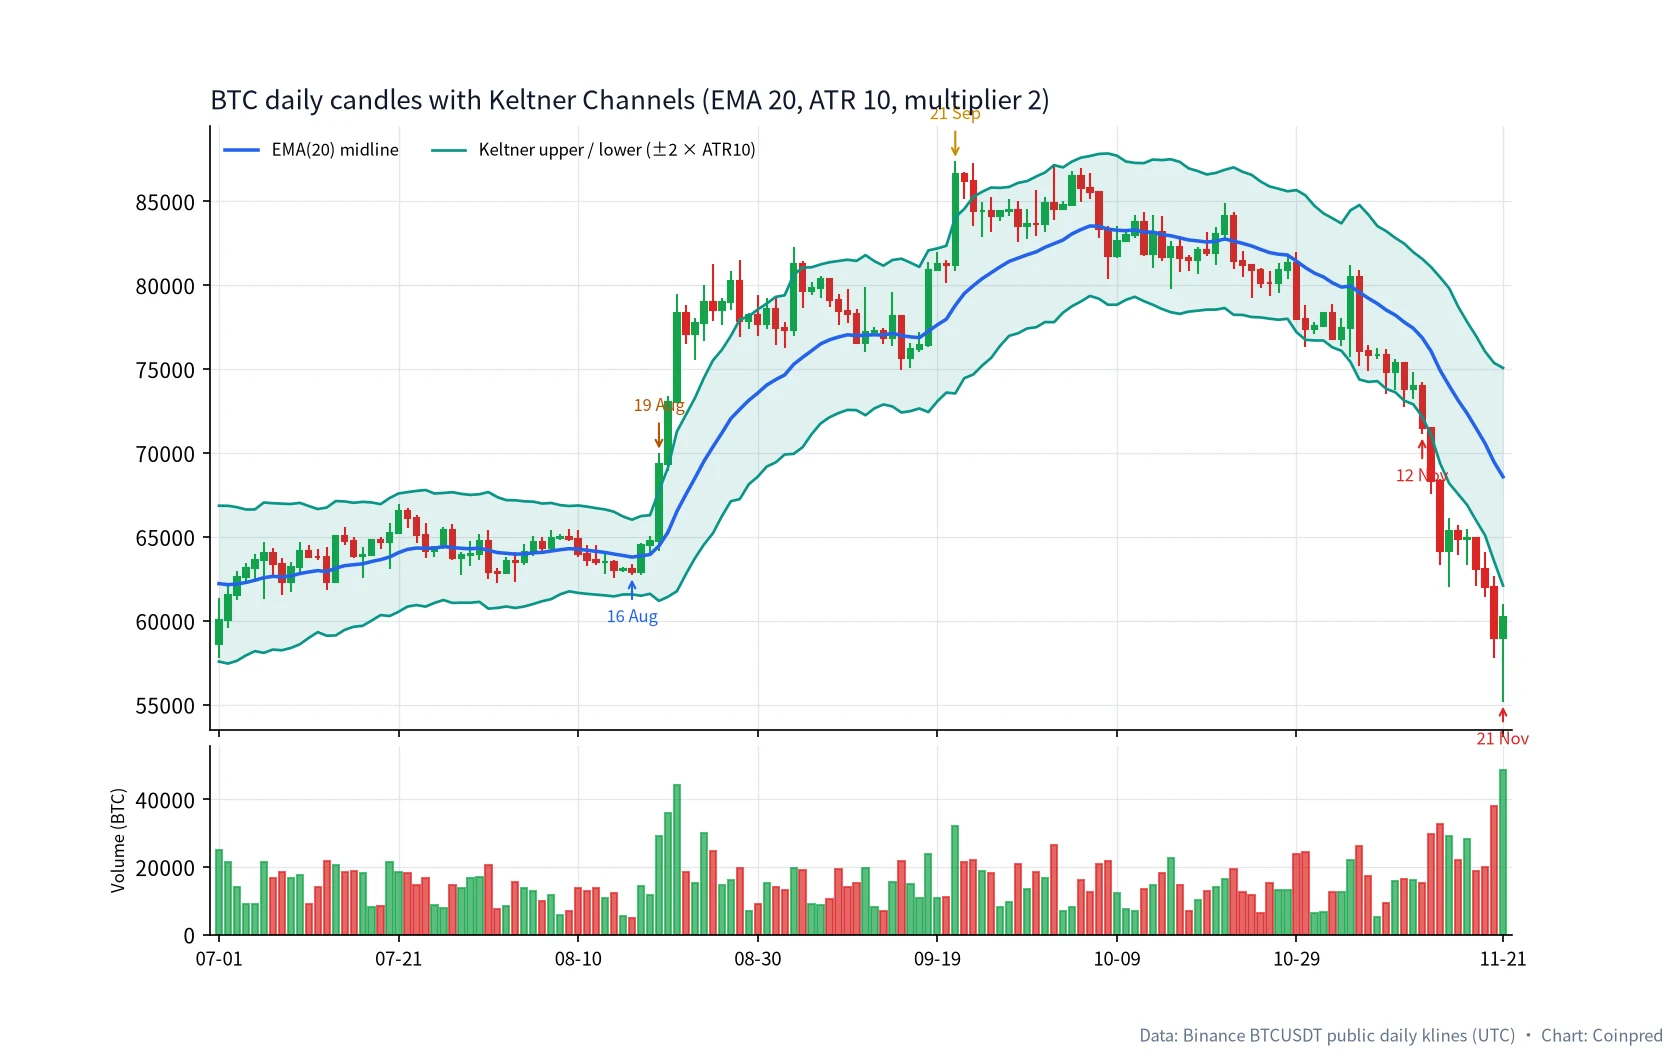
A few places are worth pinning down before the close-ups.
From July into early August, almost every close stayed inside the channel, with the midline drifting between about 62,000 and 64,000. Around 16 August the width reached its tightest point in the window, about 4,451, when ATR(10) was only about 1,113. Then 19 August closed above the upper band, and the close stayed outside it for nine sessions from 19 through 27 August, before returning inside on 28 August. On 3 September and again on 21 September the close printed above the upper band, the latter on the window high of 87,395.67. Through October, most closes remained inside the channel; 7 October and 29 October came close to the midline or the lower band, but neither closed below it. The lower band is only told clearly on 12 November: the close of 71,460.00 fell under the lower band at 72,165.20, and from there through 21 November the close stayed outside for ten sessions, while the width was pulled out to about 12,970.
In the same stretch, Parabolic SAR had already changed sides several times on wicks, and SuperTrend did not flip down until 29 October. Keltner Channels in October never said “the close has left through the lower band.” They only let the midline and the width drift lower. The three tools should not be collapsed into one sentence.
3. Mid-August: when the channel is narrowest, read the width first
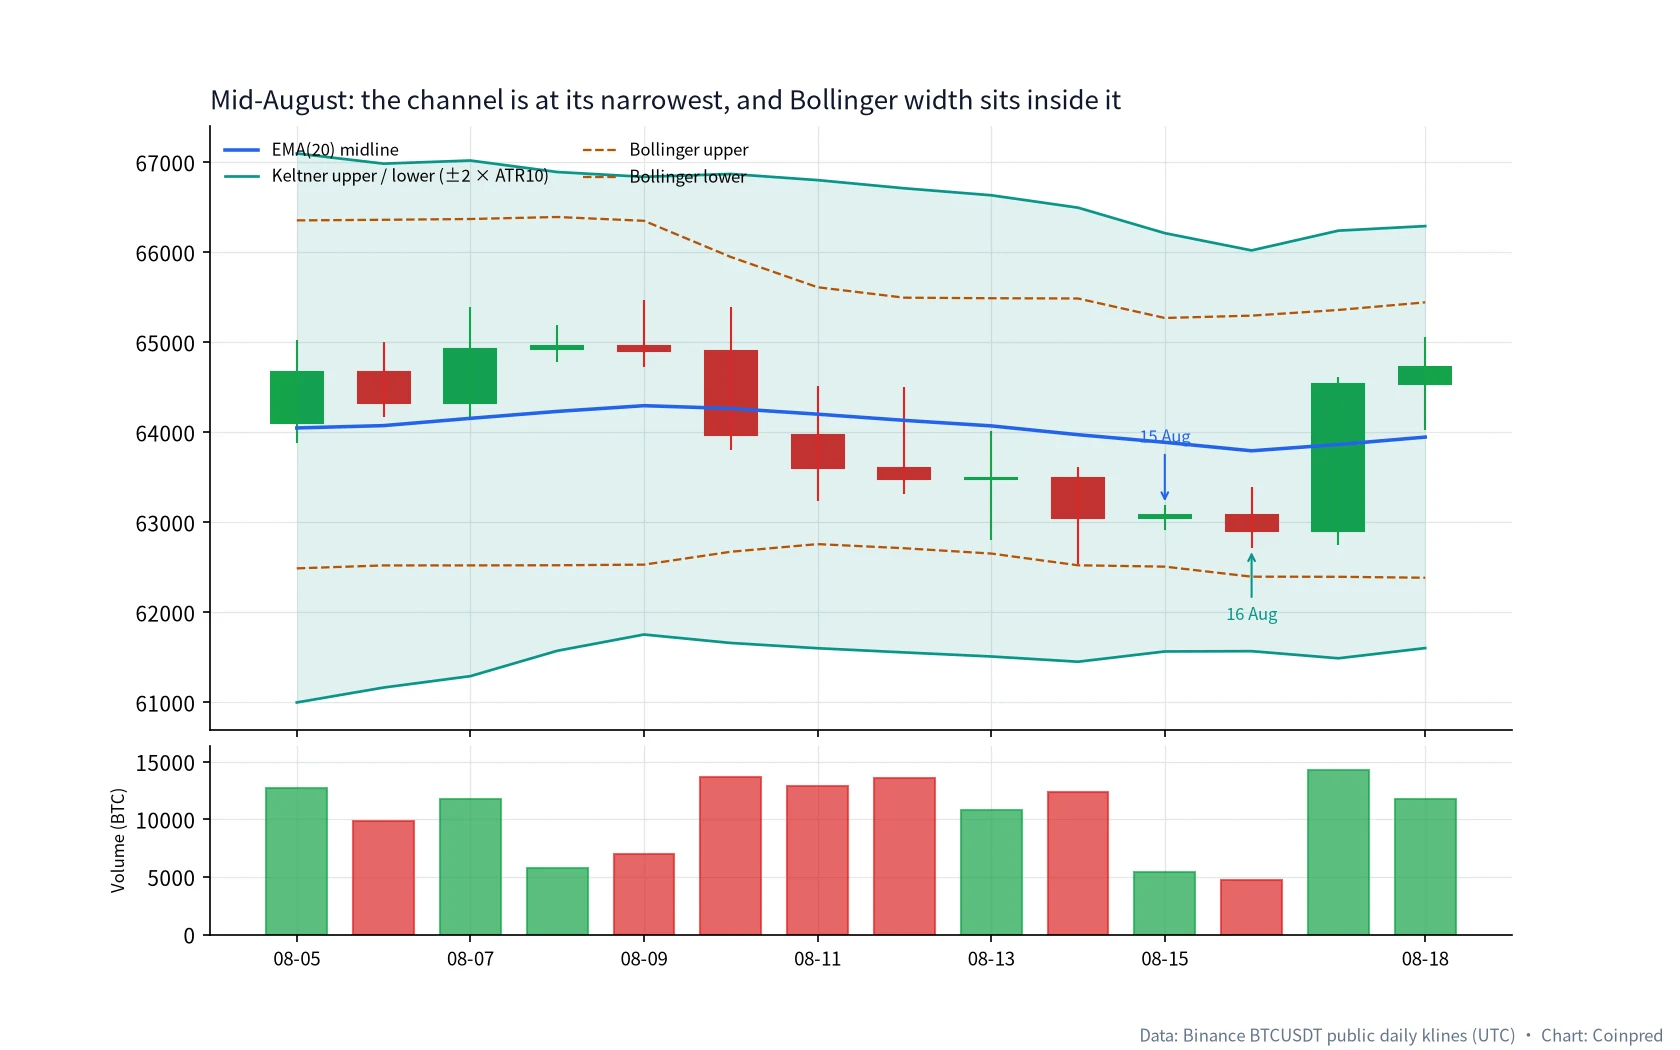
15–18 August are the cleanest days in this window for watching a contraction.
| Date (UTC) | Close | EMA20 | ATR(10) | Upper | Lower | KC width | BB width | Volume |
|---|---|---|---|---|---|---|---|---|
| 08-15 | 63,086.01 | 63,889.44 | 1,161.55 | 66,212.54 | 61,566.34 | 4,646.20 | 2,761.88 | 5,405 |
| 08-16 | 62,900.00 | 63,795.21 | 1,112.79 | 66,020.79 | 61,569.62 | 4,451.18 | 2,899.42 | 4,737 |
| 08-17 | 64,532.10 | 63,865.39 | 1,187.41 | 66,240.20 | 61,490.57 | 4,749.62 | 2,963.49 | 14,256 |
| 08-18 | 64,725.42 | 63,947.29 | 1,171.76 | 66,290.82 | 61,603.77 | 4,687.05 | 3,058.58 | 11,790 |
16 August is the narrowest channel day, and volume of 4,737 is also the quietest of these sessions. Bollinger width is about 2,899, still tighter than the Keltner Channel, which means the standard-deviation width was sitting inside the ATR width. That comparison is often called a squeeze. We will only write it as: recent volatility has contracted. It is not obliged to forecast that 19 August must leave to the upside.
On 17 August the close was up 2.59% at 64,532.10, back near the midline, and still inside the channel. On 18 August the close was 64,725.42, still below the upper band at 66,290.82. If “a narrow channel” were already a breakout trade, nothing had happened yet on those two days. Compression is background, not an order.
4. From 19 August: a run of closes above the upper band is not a promise to stay outside
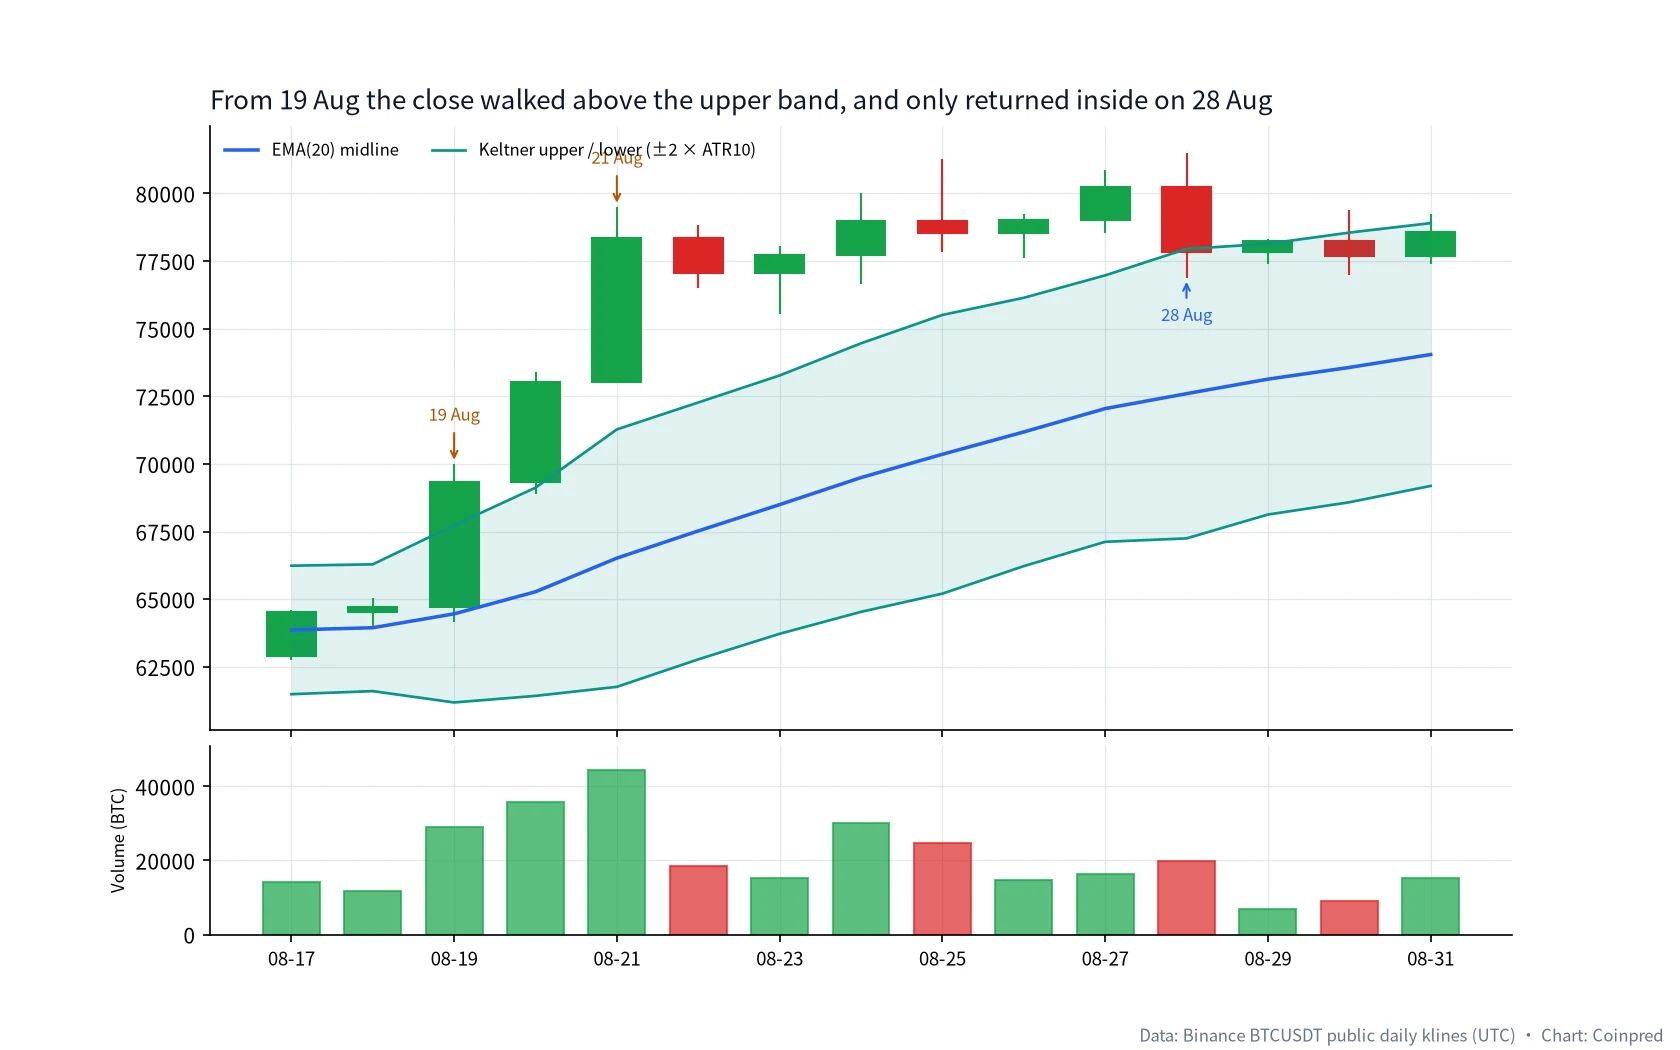
The upper band is only told clearly by the expansion days that follow the squeeze.
| Date (UTC) | Open | High | Low | Close | Change | Upper | Mid | vs upper | Volume |
|---|---|---|---|---|---|---|---|---|---|
| 08-19 | 64,725.42 | 70,000.00 | 64,166.00 | 69,334.79 | +7.12% | 67,736.36 | 64,460.39 | Above | 29,054 |
| 08-20 | 69,334.78 | 73,400.00 | 68,902.22 | 73,025.15 | +5.32% | 69,124.01 | 65,276.08 | Above | 35,905 |
| 08-21 | 73,027.02 | 79,500.00 | 73,027.02 | 78,338.03 | +7.28% | 71,278.18 | 66,520.08 | Above | 44,340 |
| 08-24 | 77,734.00 | 80,000.00 | 76,670.01 | 78,992.75 | +1.62% | 74,460.21 | 69,497.10 | Above | 30,179 |
| 08-27 | 79,023.75 | 80,848.74 | 78,546.13 | 80,249.58 | +1.55% | 76,971.32 | 72,046.97 | Above | 16,266 |
| 08-28 | 80,249.59 | 81,478.87 | 76,888.00 | 77,845.87 | −3.00% | 77,949.34 | 72,599.24 | Back inside | 19,756 |
| 08-29 | 77,845.88 | 78,330.00 | 77,382.37 | 78,230.00 | +0.49% | 78,140.11 | 73,135.50 | Just above | 7,016 |
| 08-31 | 77,682.00 | 79,250.00 | 77,392.00 | 78,581.29 | +1.16% | 78,903.25 | 74,045.91 | Inside | 15,304 |
On 19 August the close sat about 1,598 above the upper band, and volume jumped from 4,737 on 16 August to 29,054. On 21 August it rose another 7.28% on volume of 44,340, the heaviest day in this departure. From 19 through 27 August the close stayed above the upper band for nine sessions. That describes a move that has outrun two times ATR. It is not nine tickets to buy.
28 August finishes the sentence. The high of 81,478.87 is still the August peak, but the close of 77,845.87 had already come back under the upper band at 77,949.34, by only about 103. One day later, 29 August closed at 78,230.00, just above the upper band at 78,140.11, on volume of only 7,016. Then 30 and 31 August closed back inside. A walk outside the upper band can end very close to the band, and it can include one light-volume poke back above. Do not write 28 August as “the trend is over,” and do not write 29 August as “a second runaway leg has started.”
One comparison is worth a separate line. On 19 August itself, Bollinger width was about 5,709, still a little tighter than the Keltner width of 6,552; from 20 August the Bollinger width overtook it, and by 21 August it was about 15,435, well above the Keltner width of about 9,516. Once a run of large bullish days stretches standard deviation, that width can expand faster than an ATR channel. That only shows the two formulas differ. It does not “validate” the break.
5. September: two closes above the upper band, with the midline still rising
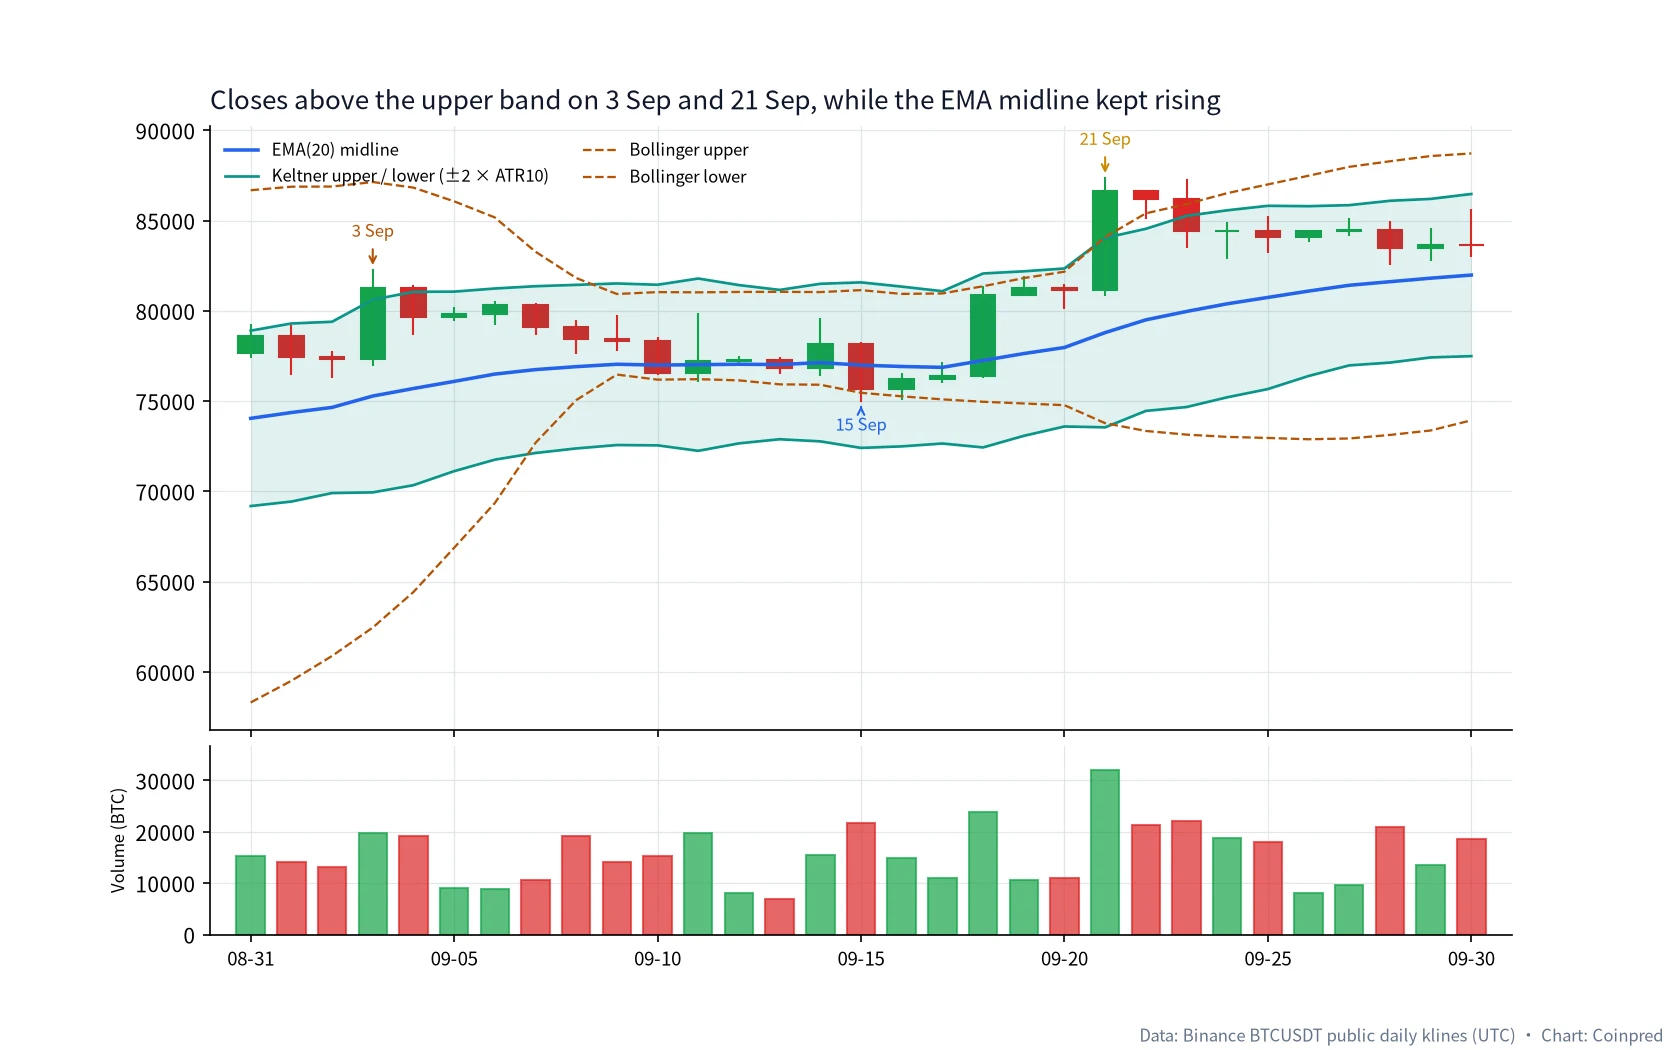
September is no longer the nine-day walk of late August. It is two shorter departures with a pullback in between.
| Date (UTC) | Close | Change | Mid | Upper | Lower | vs channel | Volume |
|---|---|---|---|---|---|---|---|
| 09-01 | 77,439.00 | −1.45% | 74,369.06 | 79,300.79 | 69,437.34 | Inside, above mid | 14,131 |
| 09-03 | 81,270.37 | +5.08% | 75,282.33 | 80,618.47 | 69,946.19 | Above upper | 19,806 |
| 09-04 | 79,660.77 | −1.98% | 75,699.32 | 81,055.40 | 70,343.25 | Back inside | 19,199 |
| 09-15 | 75,644.48 | −3.25% | 76,993.47 | 81,577.56 | 72,409.38 | Inside, below mid | 21,683 |
| 09-18 | 80,883.87 | +5.85% | 77,252.92 | 82,070.17 | 72,435.68 | Inside, near upper | 23,908 |
| 09-21 | 86,620.00 | +6.70% | 78,794.86 | 84,041.79 | 73,547.92 | Above upper | 31,963 |
| 09-22 | 86,208.56 | −0.47% | 79,500.92 | 84,543.88 | 74,457.96 | Above upper | 21,329 |
On 3 September the close of 81,270.37 sat only about 652 above the upper band at 80,618.47, and the next day was back inside. On 15 September the close of 75,644.48 fell under the midline at 76,993.47, but it was still about 3,765 above the lower band at 72,409.38 — not a break of the channel. On 18 September a heavier session closed at 80,883.87, still under the upper band; the close that left the band again was 21 September: 86,620.00, with a high of 87,395.67 and volume of 31,963. 22 September also closed above the upper band, after which price came back inside while the midline kept rising, reaching 81,982.91 by 30 September.
The two closes above the upper band are not the same event. 3 September was a one-day departure; 21 September arrived with the window high and a clear pickup in volume. Even so, we would not write 21 September as “the channel issued a buy.” It only says that, after the mid-August departure, the midline had already been lifted toward 79,000, and price once again outran two times ATR.
6. October: most closes are still inside, and a test of the midline is not a break of the lower band
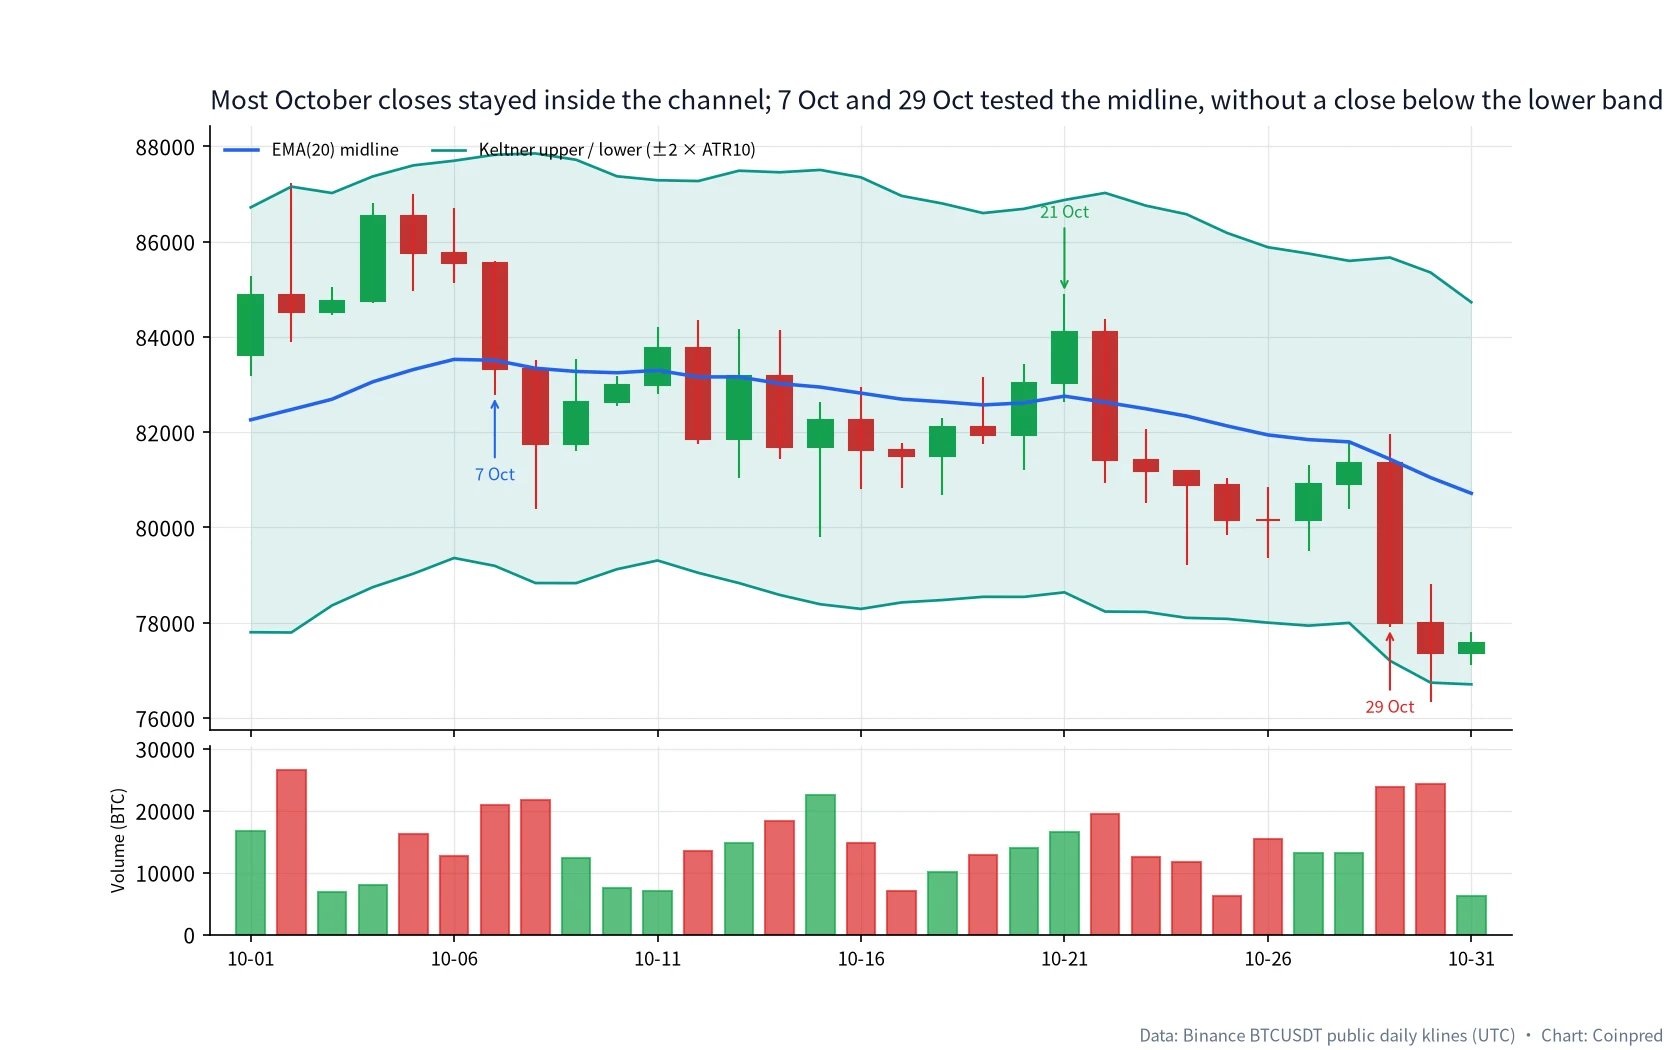
October is easy to misread if you let other tools talk first. Parabolic SAR flipped down on 7 October, briefly up on 21 October, and down again on 24 October; SuperTrend only changed side on 29 October. Keltner Channels, through those same dates, said something more restrained: the close was still inside the channel.
| Date (UTC) | Close | Mid | Upper | Lower | vs mid | vs channel | Volume |
|---|---|---|---|---|---|---|---|
| 10-06 | 85,549.93 | 83,527.68 | 87,697.03 | 79,358.32 | Above +2.42% | Inside | 12,615 |
| 10-07 | 83,321.81 | 83,508.07 | 87,822.69 | 79,193.46 | Just under mid | Inside | 20,838 |
| 10-21 | 84,093.42 | 82,755.35 | 86,873.16 | 78,637.55 | Above +1.62% | Inside | 16,545 |
| 10-22 | 81,416.09 | 82,627.80 | 87,021.36 | 78,234.25 | Below −1.47% | Inside | 19,476 |
| 10-29 | 77,991.89 | 81,433.49 | 85,665.34 | 77,201.63 | Below −4.23% | Inside, near lower | 23,832 |
| 10-31 | 77,582.02 | 80,716.43 | 84,726.68 | 76,706.18 | Below −3.88% | Inside | 6,288 |
On 7 October the close of 83,321.81 sat almost on the midline at 83,508.07. That is a moving average being tagged, not a lower band being broken. On 21 October the close climbed back above the midline, and on 22 October it fell back under it, all of it still inside the channel. On 29 October the close fell 4.12% to 77,991.89, still about 790 above the lower band at 77,201.63. SuperTrend flipped down that same day, and volume returned to 23,832, which is worth noting, but the channel’s own sentence was still: the close is near the lower band, and it has not left.
October is also a stretch in which Bollinger width again sat inside the Keltner Channel. That comparison can say “standard-deviation volatility is temporarily smaller than ATR volatility.” It does not rewrite 29 October as a close already below the Keltner lower band.
7. November: from the 12th, the close stays below the lower band, and the width is pulled open
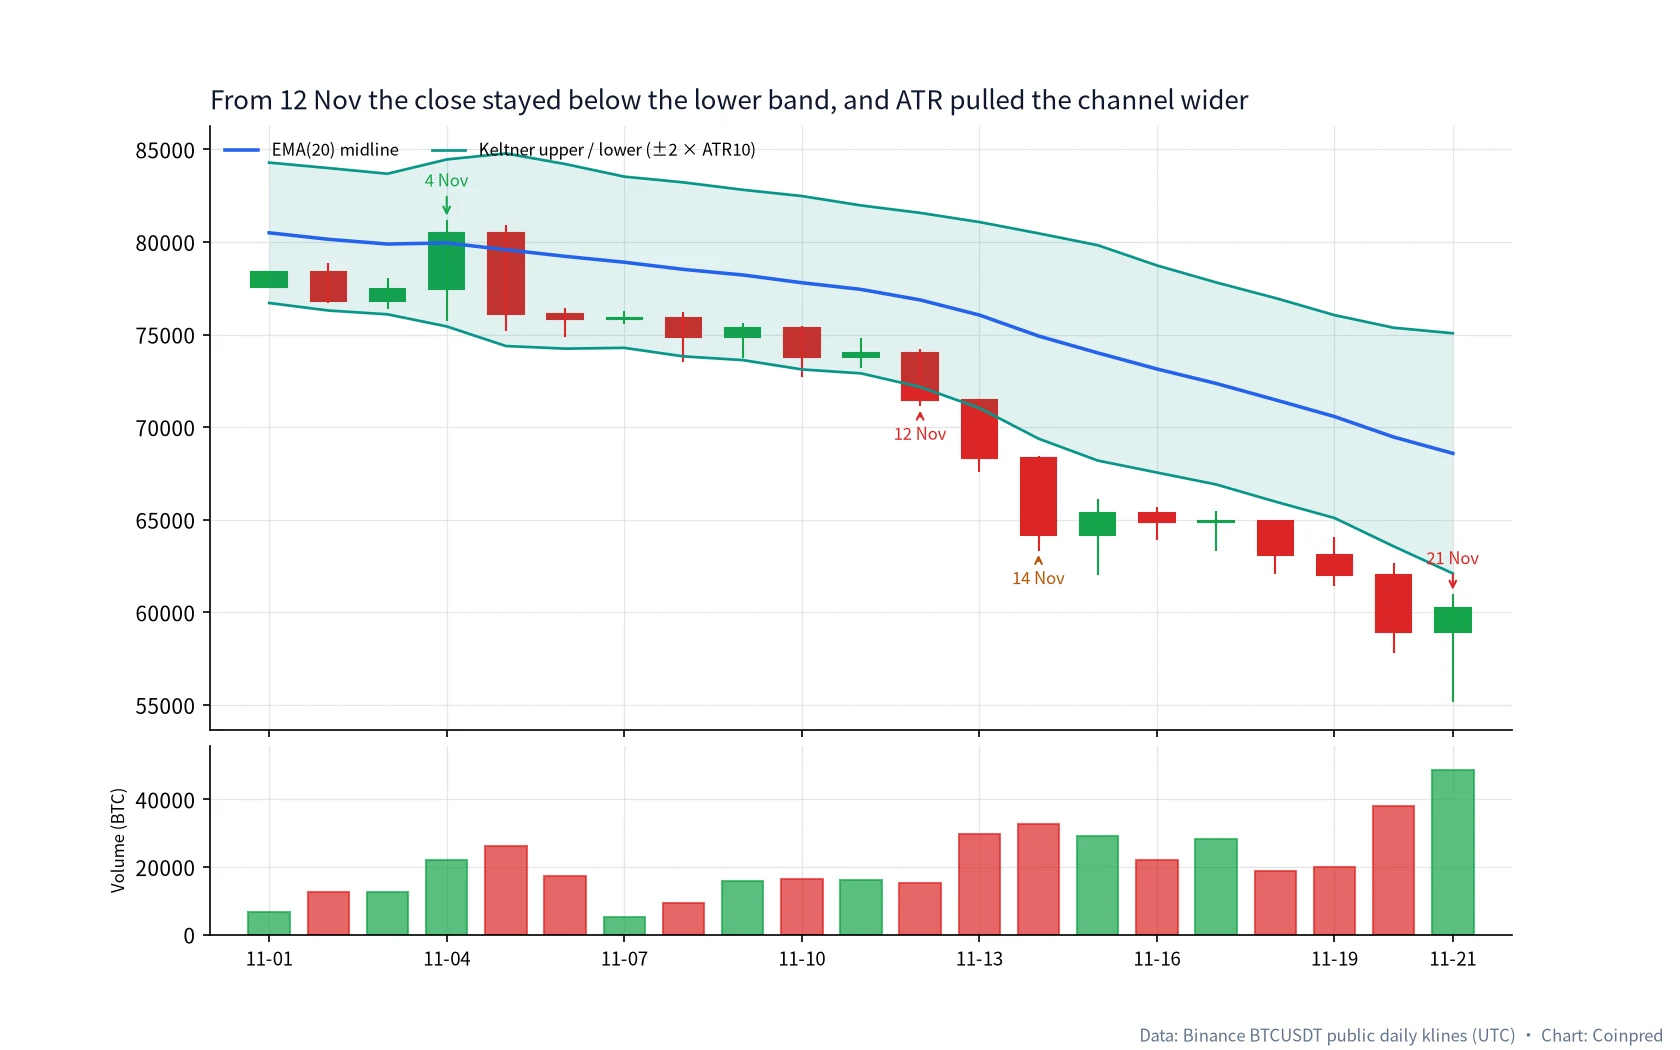
Early November still has one bounce that is easy to over-read.
| Date (UTC) | Open | High | Low | Close | Change | Mid | Lower | vs channel | Volume |
|---|---|---|---|---|---|---|---|---|---|
| 11-04 | 77,453.85 | 81,196.01 | 75,736.38 | 80,504.01 | +3.94% | 79,944.35 | 75,435.92 | Inside, just above mid | 22,140 |
| 11-05 | 80,504.01 | 80,918.01 | 75,208.42 | 76,088.01 | −5.49% | 79,577.08 | 74,377.58 | Inside, below mid | 26,060 |
| 11-11 | 73,796.06 | 74,811.45 | 73,209.12 | 74,015.19 | +0.30% | 77,435.51 | 72,901.82 | Inside | 16,146 |
| 11-12 | 74,015.20 | 74,217.49 | 71,113.06 | 71,460.00 | −3.45% | 76,866.41 | 72,165.20 | Below lower | 15,228 |
| 11-14 | 68,314.01 | 68,446.21 | 63,320.00 | 64,150.00 | −6.10% | 74,918.38 | 69,374.88 | Below lower | 32,675 |
| 11-20 | 61,986.73 | 62,639.52 | 57,778.35 | 58,951.51 | −4.90% | 69,463.38 | 63,561.43 | Below lower | 38,126 |
| 11-21 | 58,951.51 | 60,996.00 | 55,130.00 | 60,215.77 | +2.14% | 68,582.66 | 62,097.70 | Below lower | 48,558 |
On 4 November the close of 80,504.01 climbed back just above the midline, on volume of 22,140, which looks like a reclaim of the average. It lasted one day: 5 November closed at 76,088.01, down another 5.49%, still above the lower band at 74,377.58. A bounce back to the midline, and a close that has left through the lower band, are not the same event.
12 November is the first close in the window below the lower band: 71,460.00 sits about 705 under 72,165.20, on volume of 15,228, which is not the heaviest day in this stretch. What followed was not “one break and done,” but a run of closes outside. On 14 November the close fell 6.10% on volume of 32,675, to 64,150.00, about 5,225 below the lower band and about 10,768 below the midline; that was also the day the acceleration factor in the companion SAR note first reached 0.20. On 21 November the low reached 55,130.00, and the close of 60,215.77 was still about 1,882 below the lower band at 62,097.70, and about 12.2% below the midline. Volume of 48,558 was the heaviest session at the end of this window. Channel width, which had been about 4,451 on 16 August, had been pulled out to about 12,970, and ATR(10) had risen from about 1,113 to about 3,242.
The 21 November close was up 2.14%. That only says the session finished above its own open. It did not reclaim the lower band. The window stops here, and we will not write that bounce as a repaired channel.
8. A five-step habit of our own
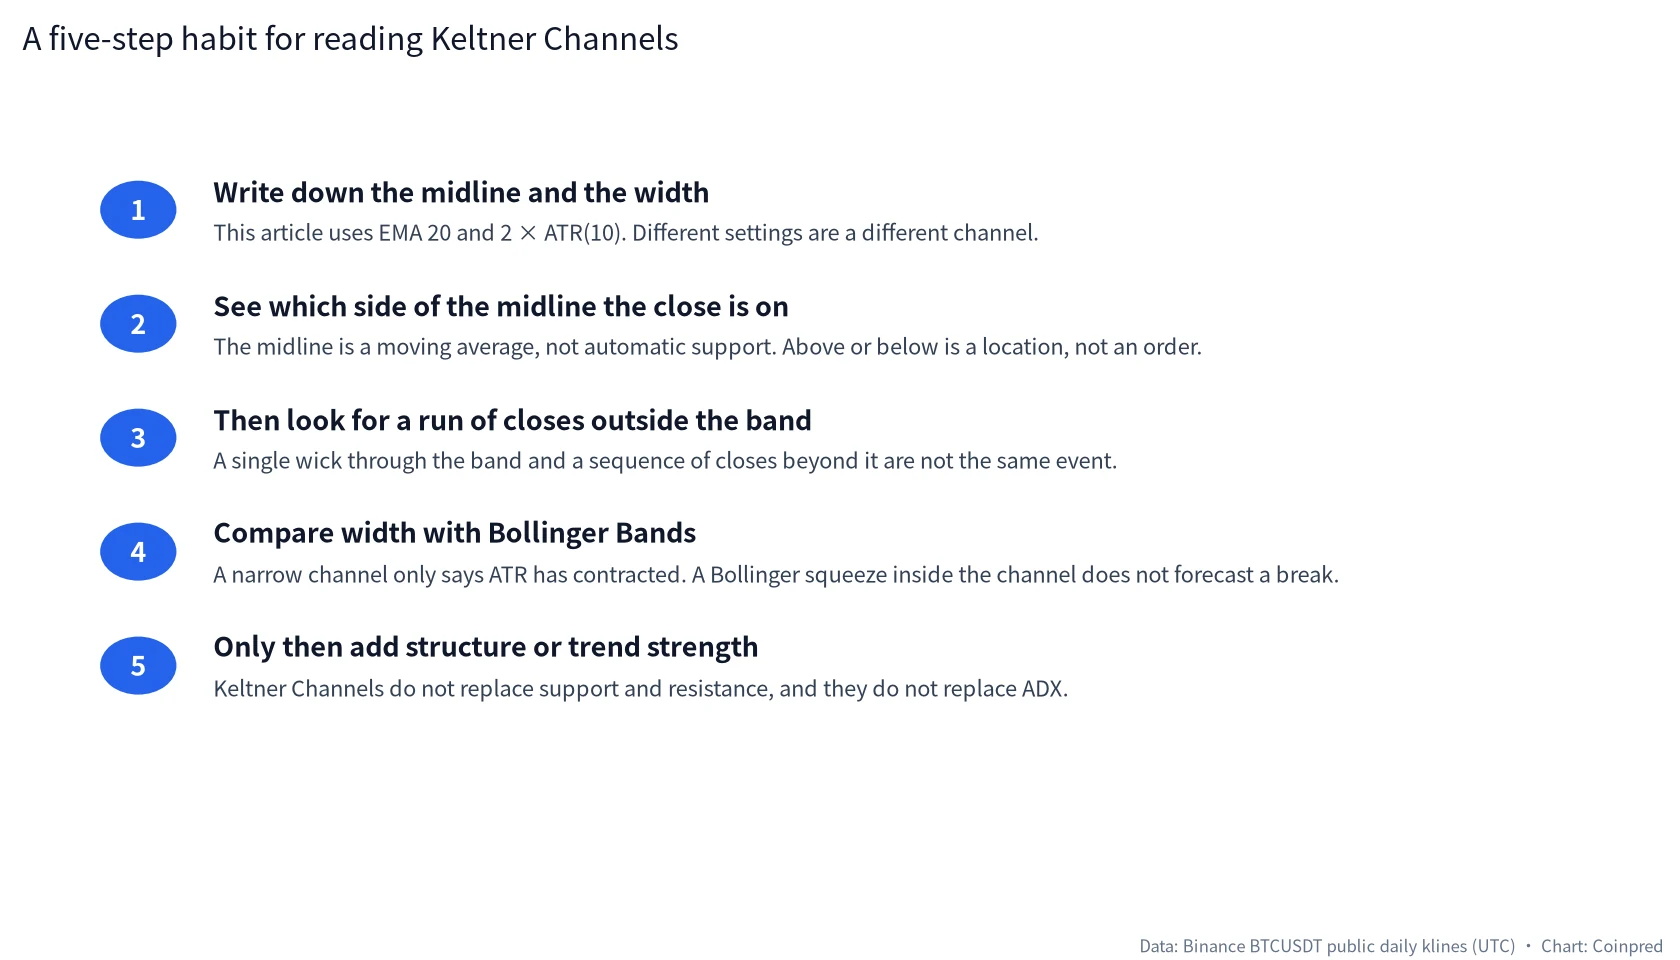
When we read Keltner Channels on a daily chart, we usually go in this order, rather than starting with “should I trade”:
- Write down the midline and the width. This article uses EMA 20 and 2 × ATR(10). A different length or multiplier is a different channel. Pick one set and put it on the chart.
- See which side of the midline the close is on. The midline is a moving average, not automatic support. A tag of the midline on 7 October, and a close below the lower band on 12 November, are not the same event.
- Then look for a run of closes outside the channel. Nine sessions above the upper band from 19–27 August are not the same as the one-day departure on 3 September; ten sessions below the lower band from 12 November are not the same as a close that only approached the band on 29 October.
- Compare width with Bollinger Bands. A narrow channel only says ATR has contracted; Bollinger width sitting inside the channel does not forecast a break. The 16 August squeeze still had to wait for the 19 August close, on rising volume, before anyone could say the price had left.
- Only then add structure or trend strength. Support and resistance tell you where you are, ADX tells you how strong a move is, and Parabolic SAR tells you whether a trailing dot has flipped on a wick. Keltner Channels do not replace them.
If we keep only one sentence: ask first which midline and width you are using, then whether the close is still inside near the average or has already left in a run, and only then decide whether today’s departure is worth writing down on its own.
9. What we will not do with Keltner Channels
- Write a contraction as if the next break were guaranteed. 16 August is the narrowest day in the window, but the break is not something the squeeze itself issued.
- Treat one close above the upper band as a chase. 3 September was back inside the next day.
- Write a close that only approaches the lower band as a break of the channel. On 29 October the close was still about 790 above it.
- Use a Bollinger break to “confirm” a Keltner departure, or the other way around. The two widths are different formulas, and the 19–20 August comparison already shows that.
- Treat the midline as support that must hold. The 4 November reclaim lasted one day.
- Copy a daily departure date onto a 15-minute decision, or the other way around.
- Turn Keltner Channels by themselves into a trading system. You can write rules, but you then have to write down whether you use the close or the wick, how many sessions count as a run, and how spot differs from perpetual futures. We do not do that here.
FAQ
Should I use Keltner Channels or Bollinger Bands?
You can read them together. You should not substitute one for the other. Bollinger width comes from the standard deviation of closes; Keltner width comes from ATR. Both contracted in mid-August; from 20 August the Bollinger width was the wider of the two; in October, Bollinger width sat inside the Keltner Channel again. Both can be true at once, and neither proves the other. If you want to recompute the figures in this article with only one channel, use EMA 20 ± 2 × ATR(10).
If the close leaves through the upper band, should I chase?
No. The run from 19–27 August did precede later highs; 3 September also closed above the upper band, and was back inside the next day. Our own reading is to ask whether this is a run of closes or a one-day departure, and whether volume joined in — not to treat “above the upper band” as an entry ticket.
After the channel narrows, does it have to leave in one direction?
No, and it will not tell you the direction. That prices left to the upside after 16 August is simply what happened in this window. A squeeze only says recent true range has shrunk. The direction has to be printed by the close, and it is better read with volume.
If the close loses the midline, should I go short?
No. On 7 October the close slipped just under the midline, and on 21 October it climbed back above, all of it still inside the channel. We put more weight on whether the close has stayed beyond the lower band. The stretch from 12 November is what makes that band clear.
Does this also apply to a 15-minute or 1-hour BTC chart?
The formula can be moved. The conclusions and the dates cannot. On a 1-hour chart, EMA 20 and ATR(10) are computed from hourly bars, not from the 19 August daily candle. Our own order is still daily first: write down the daily midline, width and departures, then decide whether to drop to a lower timeframe.
Can I build a trading system from Keltner Channels alone?
You can write one. You then have to define whether you use the close or allow wicks, how many sessions count as a run, and how the channel sits next to candlesticks and volume. On this stretch of BTC dailies, chasing every close above the upper band would have treated the brief pokes on 3 September and 29 August as a new trend; shorting every approach of the lower band would have written 29 October as a break before it was one. That is the failure mode. This article is for study and review only.
Can Keltner Channels tell me which event contract to pick, or which way JEV will lean?
Only indirectly. Event contracts have their own expiry, settlement index and payout rules; if that is the product you are studying, start with the BTC event contract note. JEV is a separate five-bucket directional reading, and its confidence is not a win rate. Keltner Channels can be market context we pass to a model, and they can be context we use when we read a chart ourselves. They are not a settlement forecast.
Data and references
- Candles: Binance’s public API, BTCUSDT daily klines, UTC, main window 2026-07-01 through 2026-11-21. 22 November was still an incomplete session when this was written, so it is not treated as a full day. Volume is the base BTC quantity returned by that endpoint.
- Indicator: Keltner Channels use a 20-day EMA of the close as the midline, with bands at the midline ± 2 × Wilder ATR(10). The EMA is seeded with a 20-day simple average and then updated with 2÷(20+1). The comparison Bollinger Bands are a 20-day simple average ± two sample standard deviations.
- A common modern construction of Keltner Channels uses an exponential midline and an ATR width; earlier versions used typical price and average range. The implementation above matches a common charting default and is not an exchange’s internal specification.
- Adjacent tutorials already in this series: candlesticks, support and resistance, moving averages, RSI, MACD, Bollinger Bands, volume, Fibonacci, Stochastic, ATR, ADX, Ichimoku, VWAP, SuperTrend, and the companion Parabolic SAR.
All charts were drawn by Coinpred from the public data above. If a date or a figure does not match your own recomputation, write to us through the author page or the contact listed there (@constcaoq). Trading involves risk; please judge independently and size positions with care. This article is for study only and is not investment advice. Coinpred does not provide services to users in mainland China.