What this strategy is for
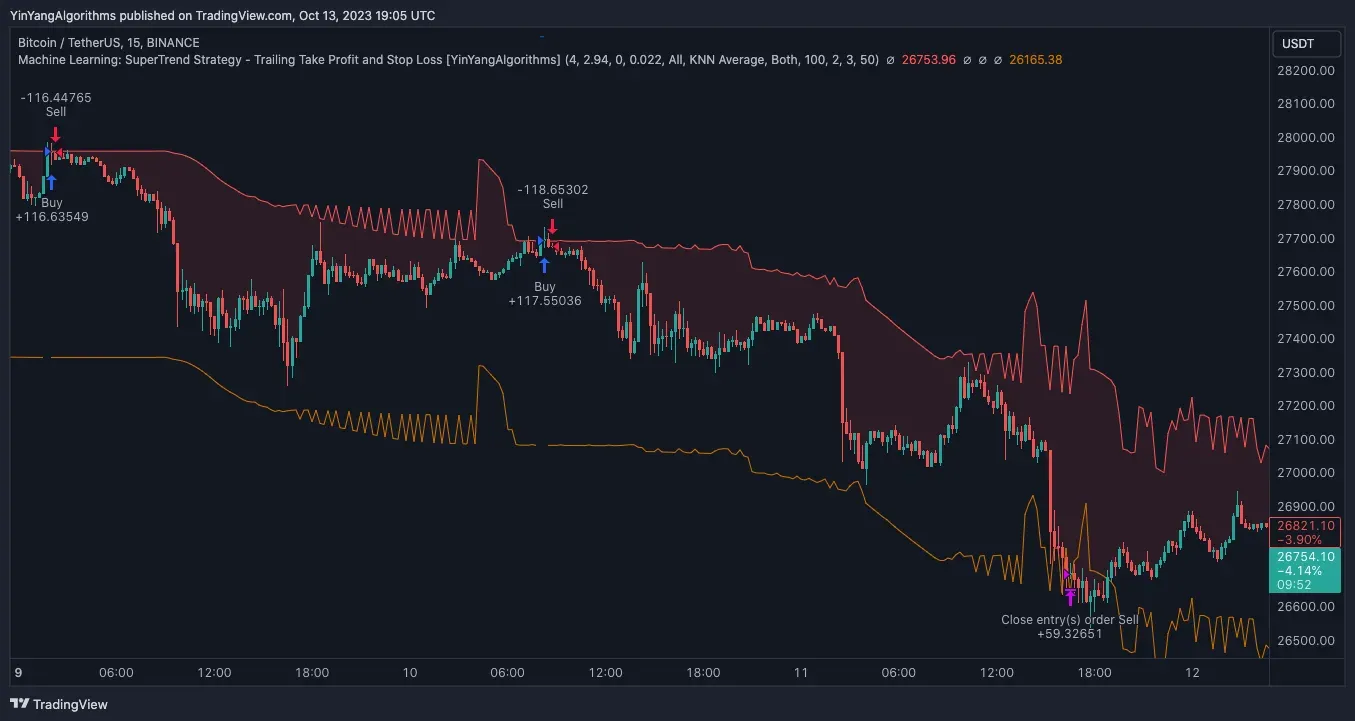
The classic SuperTrend is an ATR-based trend-following line that flips when price closes through its band. It works well in strong trends but tends to whipsaw when Bitcoin moves sideways. This TradingView script by YinYangAlgorithms adds three layers on top of it: Rational Quadratic kernel smoothing of price and ATR, a filter the author calls KNN that recalculates the SuperTrend line from historical data, and proportional trailing take-profit and stop buffers.
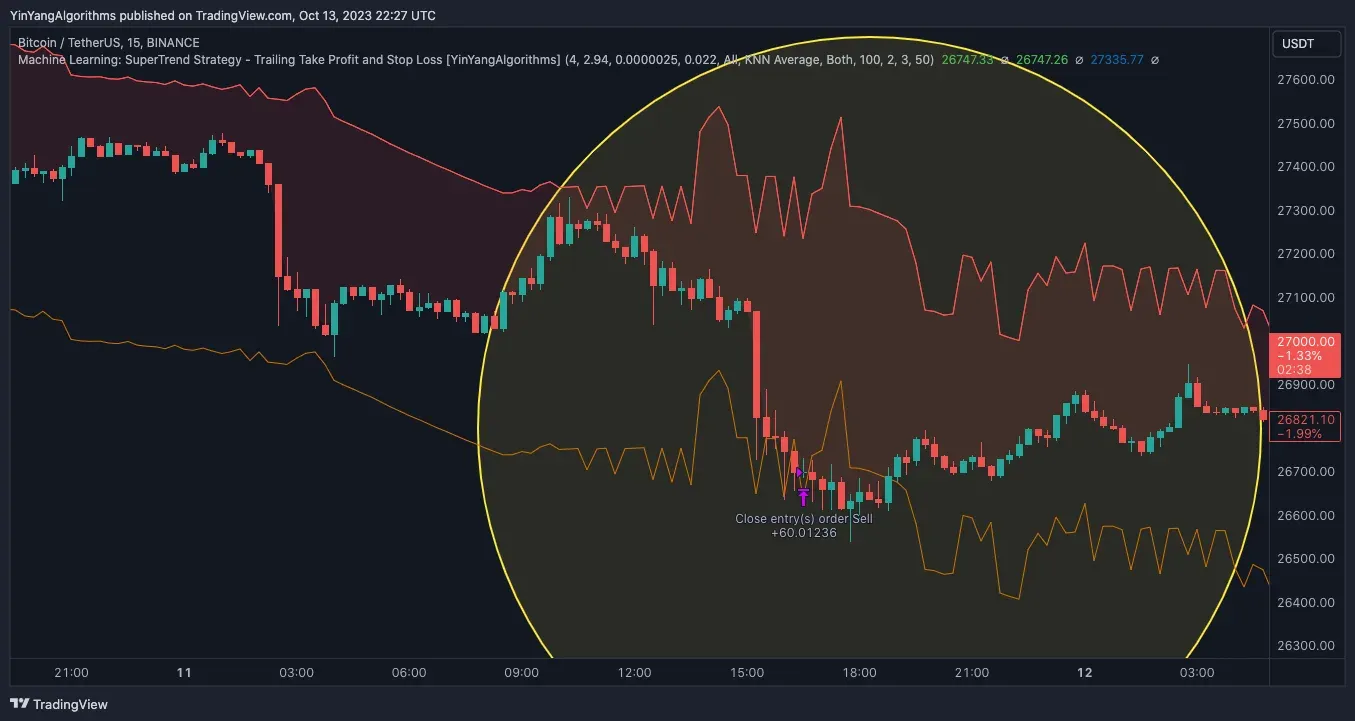
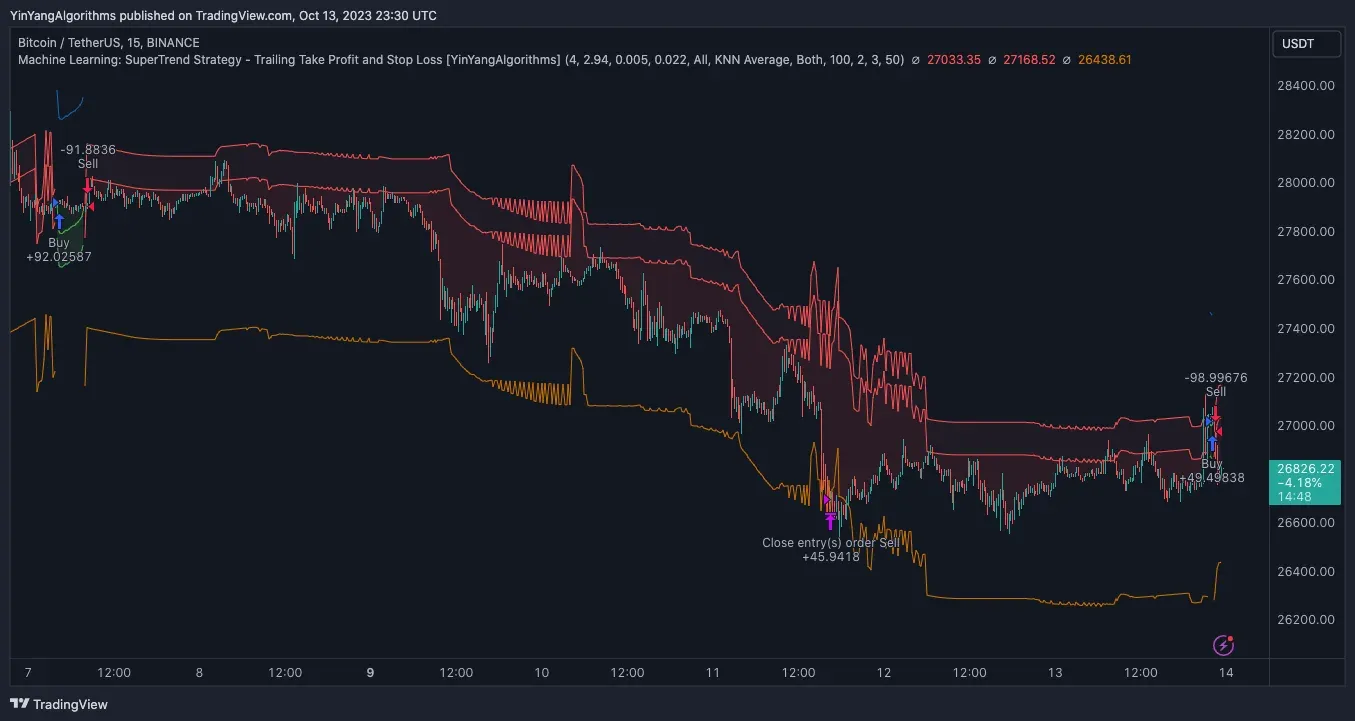
It is a strategy() script written in Pine Script v5, not an indicator(), so it loads directly into the TradingView Strategy Tester with orders and performance. The author's published chart is BINANCE:BTCUSDT on the 15-minute timeframe, which is why we file it as a Bitcoin TradingView strategy in the trend category. The source itself is not tied to any symbol; test it yourself before using it on other coins or timeframes.
Indicators and algorithm
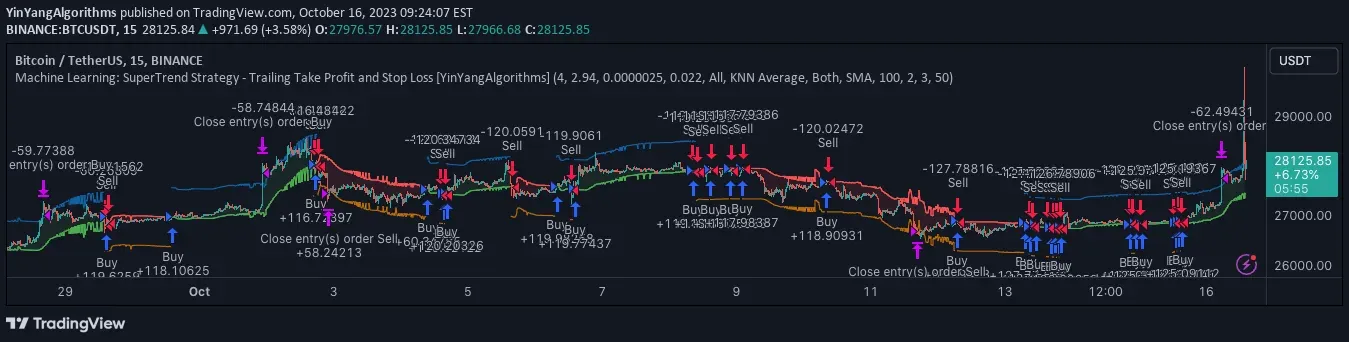
Step one is Rational Quadratic kernel smoothing. The rationalQuadratic function in the source is credited to jdehorty and takes a weighted average of the last 27 bars, giving more weight to recent bars (lookback 8, relative weight 8 and start parameter 25 are hard-coded). With the default Rationalized Source Type of All, hl2, close and ATR are all smoothed.
Step two is the base SuperTrend. The upper band is smoothed hl2 plus Factor times ATR, the lower band is hl2 minus Factor times ATR, and the usual ratchet applies: in an uptrend the lower band can only rise, in a downtrend the upper band can only fall. Unlike the classic version, the flip test compares the smoothed close with a stop line placed slightly beyond the band by the Stop Loss Multiplier.
Step three is the machine-learning recalculation. In the default KNN Average mode the script takes a 3-period and a 50-period SMA of the base SuperTrend and stores the fast line, slow line and direction for the last 100 bars. For bars with the current direction it computes slow minus fast. The two most recent same-direction differences define a min and max; only historical points inside that range are kept, and the average of their fast/slow midpoints becomes the new SuperTrend line. This is closer to a distance-band filter followed by averaging than to a textbook KNN classifier. The author also notes that in parabolic moves fewer points qualify, so the line can look jagged.
Finally the stop line is recalculated from the new SuperTrend and the direction is re-evaluated with the raw close: a close above the stop line means an uptrend (direction = -1 in the code, green), otherwise a downtrend (direction = 1, red).
Entry rules
- Long: when the direction changes from down to up (direction goes from 1 to -1), the script calls strategy.entry("Buy", strategy.long, stop=stop line price).
- Short: when the direction changes from up to down, it calls strategy.entry("Sell", strategy.short, stop=stop line price).
- It trades both sides and has no long-only or short-only switch. An opposite entry reverses the open position automatically.
- process_orders_on_close=true, so orders are processed at bar close. Because the close is already on the other side of the stop line when the order is placed, check actual fill times and prices in the Strategy Tester's List of Trades (not tested by Coinpred).
Exits, stops, take profit and sizing
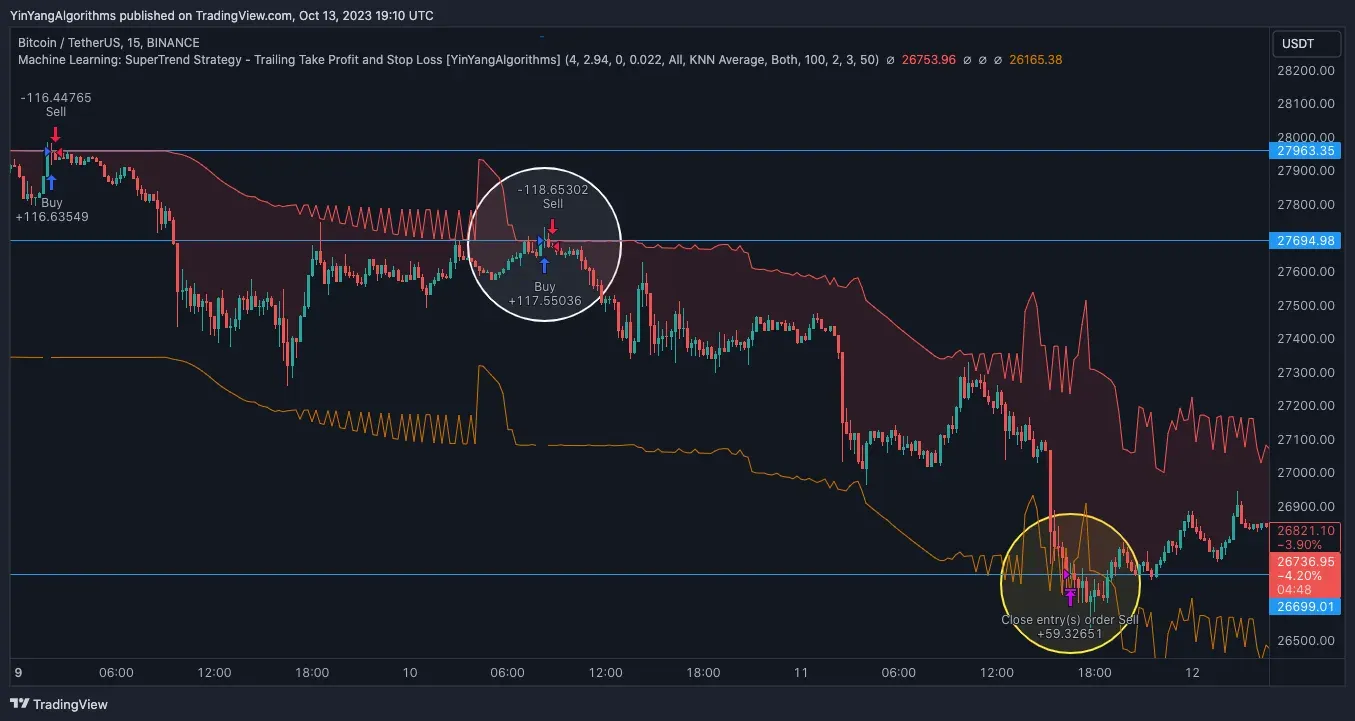
- Take profit: when Take Profit Multiplier is not 0, the long take-profit line is SuperTrend × (1 + 0.022) and a close above it closes the long with strategy.close; the short line is SuperTrend × (1 - 0.022) and a close below it closes the short. The line moves with the SuperTrend, hence the author's name Trailing Take Profit.
- Reversal exit: without a take-profit hit, the position stays open until the direction flips and the opposite entry fires.
- Stop loss: only when Allow Same Bar Entry and Exit for Orders is enabled and Stop Loss Multiplier is not 0 does a close beyond the previous bar's stop line close the position. It is off by default, so the stop line then only drives trend flips.
- Sizing: each entry uses 100% of equity with an initial capital of 1,000,000. There is no scaling in, pyramiding or fixed-risk position sizing in the source.
Inputs (source defaults)
| Input | Default | What it does and how changes affect it |
|---|---|---|
| ATR Length | 4 | ATR period of the base SuperTrend. Lower values react faster and flip more often. |
| Factor | 2.94 | ATR multiplier that sets the band distance from hl2. Higher values widen the bands, flip less often and lag more. |
| Stop Loss Multiplier | 0.0000025 | A price-proportional buffer beyond the SuperTrend line, used for the flip test and the stop line. 0 disables it. The author notes that larger values can reduce signal flashing but do not necessarily improve results. |
| Take Profit Multiplier | 0.022 | Proportional distance of the take-profit line from the SuperTrend line (0.022 = 2.2%). 0 disables take-profit exits. |
| Allow Same Bar Entry and Exit for Orders | false | When enabled, a close beyond the previous bar's stop line closes the position. When off (default), the stop line only affects trend flips. |
| Only Factor Same Trend Direction | true | The machine-learning step only uses historical SuperTrend data that shares the current direction. |
| Rationalized Source Type | All | Which inputs (hl2, close, ATR) are first smoothed with the Rational Quadratic kernel. Options: All, Close, HL2, ATR, None. |
| Machine Learning Type | KNN Average | Options: KNN Average, KNN Exponential Average, Simple Average, None (None uses the plain SuperTrend). |
| KNN Distance Type | Both | Which distance bounds are used to filter historical points. Options: Both, Max, Min. |
| Machine Learning Smoothing Type | SMA | How the fast and slow SuperTrend lines are smoothed. Options: SMA, EMA, VWMA. |
| Machine Learning Length | 100 | Number of bars kept for the machine-learning lookback. |
| k-Nearest Neighbour (KNN) Length | 2 | How many of the most recent same-direction distances define the allowed min/max range. |
| Fast ML Data Length | 3 | Period of the fast smoothed SuperTrend. |
| Slow ML Data Length | 50 | Period of the slow smoothed SuperTrend. |
| Strategy property | Value in source | Notes |
|---|---|---|
| initial_capital | 1000000 | Starting equity for backtests. |
| default_qty_type / value | percent_of_equity / 100 | Each entry uses 100% of equity, i.e. full position sizing. |
| process_orders_on_close | true | Orders are processed at bar close. |
| Commission and slippage | Not set in the source | TradingView then assumes 0. Enter your exchange's real fees in Properties, otherwise backtests will look optimistic. |
Markets, timeframes and limitations
- Market and timeframe shown by the author: BINANCE:BTCUSDT, 15-minute. Other coins (including ETH) and other timeframes were not shown by the author and have not been tested by Coinpred.
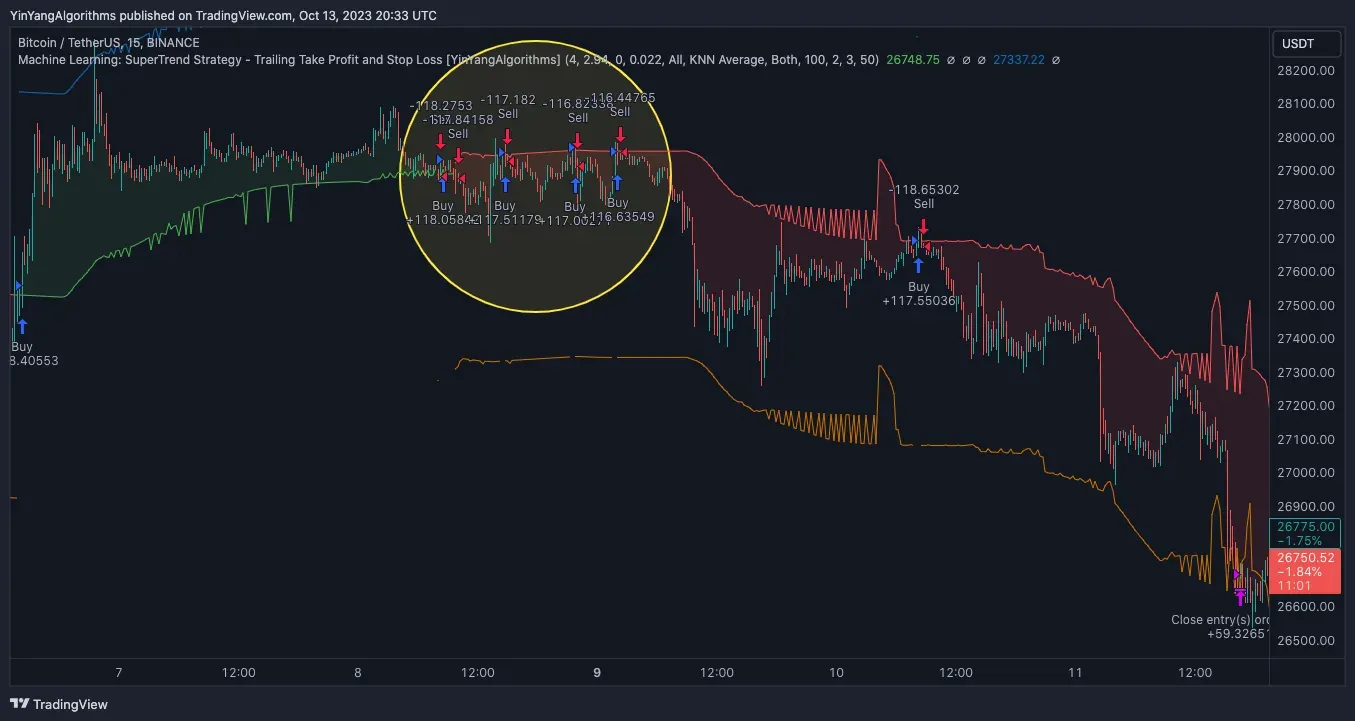
- Sideways markets cause signal flashing and runs of small losses. The author states the win rate may be low and that the strategy relies on a few large trends.
- In parabolic moves fewer historical points pass the filter, so the SuperTrend and take-profit lines can jump in a jagged pattern.
- Defaults use full position size with no commission or slippage, so raw Strategy Tester results will look optimistic. Enter real fees in Properties.
- The script only uses the chart's own data: no request.security calls and no lookahead. In principle closed-bar values should not change, but lines and signals move on the live bar until it closes. Repainting has not been tested by Coinpred; prefer alerts that fire on bar close.
- The source calls alert() with placeholders such as {{strategy.order.action}}; whether they are substituted inside alert() is unverified. The alert_message for closing a short says Exit LONG, which is a labelling issue in the source and does not change order logic.
- No external libraries, invite-only dependencies or special account requirements.
Pine Script setup guide for TradingView
- Download the .pine file from Coinpred (active membership required, see below), or view the source on the original TradingView script page.
- Open a TradingView chart, switch to BINANCE:BTCUSDT or the pair you want to test, and start with the 15-minute timeframe the author used.
- Open Pine Editor, create a blank script, replace its contents with the full source, and keep the MPL 2.0 notice and author credit on the first lines.
- Click Save, then Add to chart. You should see red and green SuperTrend lines, take-profit lines and Buy and Sell markers.
- Open the strategy's Inputs and confirm the defaults against the table above. Observe the defaults first, then change Factor, Take Profit Multiplier and other inputs one at a time.
- Open Properties, enter the commission and slippage of the exchange you actually use, and set order size to a level that fits your risk tolerance.
- Open the Strategy Tester to review the List of Trades, equity curve and performance, paying close attention to losing streaks in ranges.
- For alerts, create an alert with this strategy as the condition and use {{strategy.order.alert_message}} in the message. Test with paper trading or small size first to confirm the alert content.
Verification and backtest notes
Download access and version notes
- Original author: YinYangAlgorithms. Original title: Machine Learning: SuperTrend Strategy - Trailing Take Profit and Stop Loss [YinYangAlgorithms].
- Version: TradingView script version 2.0, first published 2023-10-16 (UTC), last updated 2024-10-12 (UTC). Coinpred stores the complete, unmodified 2.0 source.
- License: the source declares the Mozilla Public License 2.0. The original copyright and license notices are kept; if you modify and redistribute it, your modified file must also be made available under MPL 2.0.
- Download: the .pine file is available to active monthly or yearly members and does not use analysis credits; free analysis credits do not include downloads. Coinpred membership does not include any paid TradingView plan.
- If the author publishes a newer version, the original TradingView script page is the reference.