The idea
This open-source short-horizon script from BullByte is titled Smart Grid Scalping (Pullback). It does not chase a breakout. It builds an ATR grid around an older price, waits until price has traveled far enough from the center, then wants RSI in an extreme and a candle that closes back the other way before it enters against the move. In practice it is a pullback stack: grid level, plus RSI extreme, plus a small reversal bar.
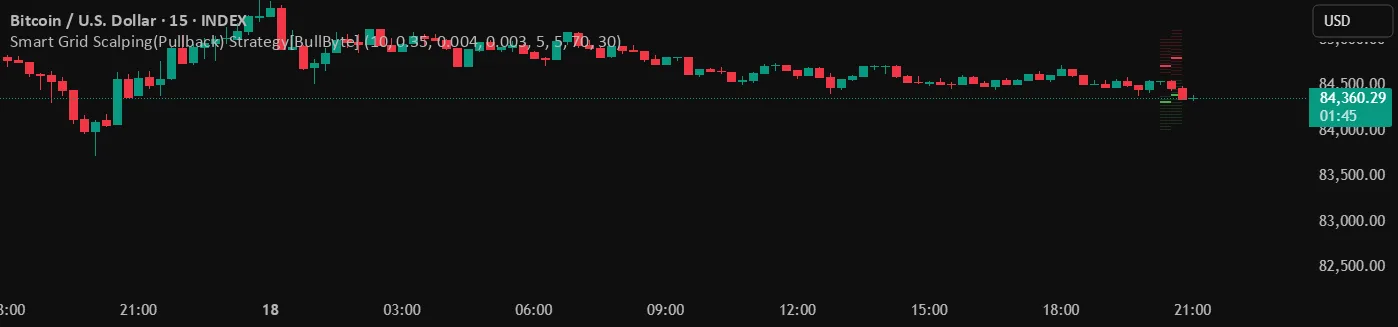
The chart on the publication page is BINANCE:BTCUSDT on the 15-minute timeframe, so this page is filed under BTC. The script is not hard-coded to one symbol and will load on others, but the walkthrough and the image stay with the author’s chart. The default size is a sizable 30% of equity, and the take-profit distance is 0.4% from the current close, which reads as scalping rather than a swing trade.
Indicators
- The center, basePrice, is close[20] — the close from 20 bars ago, not the current close. The author’s comment is that this widens the grid spacing.
- ATR defaults to 10. The 15 upper steps are basePrice + (i+1) × ATR × gridFactor; the lower steps are symmetric. gridFactor defaults to 0.35. The arrays are written only after bar_index > 20.
- RSI is hard-coded to period 14; there is no input for it.
- The no-trade zone looks at the current bar’s range: shorts need (high−low)/high above noTradeZone, longs need (high−low)/low above it. The default is 0.003 (0.3%). Narrow bars do not qualify.
- Each level is drawn with line.new. The trigger levels (shortLevel and longLevel, both default 5, counted from 0) are drawn thicker.
Entry rules
- Short: the close is above the upper trigger level (default level 5), the range filter passes, RSI is above minRSIShort (default 70), and the close is below the open (a down bar). The tester name is Short.
- Long: the close is below the lower trigger level (default level 5), the range filter passes, RSI is below maxRSILong (default 30), and the close is above the open (an up bar). The tester name is Long.
- There is no long-only or short-only switch; both sides can fire.
- The tester defaults to 30% of equity, 0.04% commission, and slippage 1.
Exits and position sizing
- While a position is open, the script calls strategy.exit on every bar. Both the limit and the trailing-stop anchor are based on the current close, not the entry price.
- For a long, the limit is close × (1 + profitTarget), with profitTarget defaulting to 0.004 — 0.4% above the current close. trail_price is close × (1 + profitTarget × 0.5), and trail_offset is the current ATR. Shorts are mirrored below the close.
- Because those orders are rebuilt from the live close, the exit behaves like a short-horizon target that moves with price, not a fixed 0.4% from the fill. That matters when you change timeframe or volatility.
- Entry labels print LONG or SHORT on the chart. Grid lines are created with line.new on every bar for every level; the source never deletes old line objects.
Inputs (source defaults)
| Input | Default | Purpose |
|---|---|---|
| ATR Length | 10 | ATR period used to space the grid |
| Grid Factor | 0.35 | Each step is ATR times this factor |
| Profit Target | 0.004 | Take-profit fraction of the current close; 0.4% by default |
| No-Trade Zone (%) | 0.003 | Minimum bar range; the title says percent, the value is 0.3% |
| Short Trigger Level | 5 | Upper-grid level that arms a short (0–14) |
| Long Trigger Level | 5 | Lower-grid level that arms a long (0–14) |
| Min RSI for Short | 70 | Minimum RSI required for a short |
| Max RSI for Long | 30 | Maximum RSI allowed for a long |
| RSI period | 14 (hard-coded) | No input is provided in the source |
Things to know before using it
- The grid center is close[20] and is recomputed every bar, so this is not a static grid pinned to one price; it drifts with the close from 20 bars ago.
- The script calls line.new for all 15 levels on every bar and never uses line.delete. TradingView caps the number of line objects, so older lines may disappear and the chart can get cluttered. That does not change the order conditions, but it does affect what you see.
- The take-profit is anchored on the current close and reset every bar. Do not read the default as “0.4% from the entry.”
- A 30% equity default on a 15-minute pullback is not a small size. The No-Trade Zone input title includes a percent sign, but the comparison uses the decimal 0.003.
- This is not the same rule set as the existing BullByte RSI divergence reversal (id 15). Here the trigger is an ATR grid plus an RSI extreme, not divergence.
Installing it on TradingView
- Download the .pine file from Coinpred (active membership required, see below), or check the original page for a newer version.
- Open the Pine Editor, create a blank script, paste the full source, and save.
- Click Add to chart. To match the author image, start with Binance BTCUSDT on the 15-minute timeframe.
- Check the trigger levels, RSI thresholds, and the fact that the target is based on the current close, then review fills in the Strategy Tester.
- Past tester results do not guarantee future returns.
About backtest figures
Source, license and version
- Source: https://www.tradingview.com/script/B3Ey5I4g-Smart-Grid-Scalping-Pullback-Strategy-BullByte/
- Author: BullByte. Source version 4.0 (Pine v6), scriptAccess=open_no_auth.
- License: Mozilla Public License 2.0. Redistribution must keep the copyright and license notices; modified files must remain under MPL 2.0. Coinpred ships the unmodified full source.
- Members can download the .pine file on this page to study the rules. Judge the risk yourself, and follow your venue’s rules.