The idea
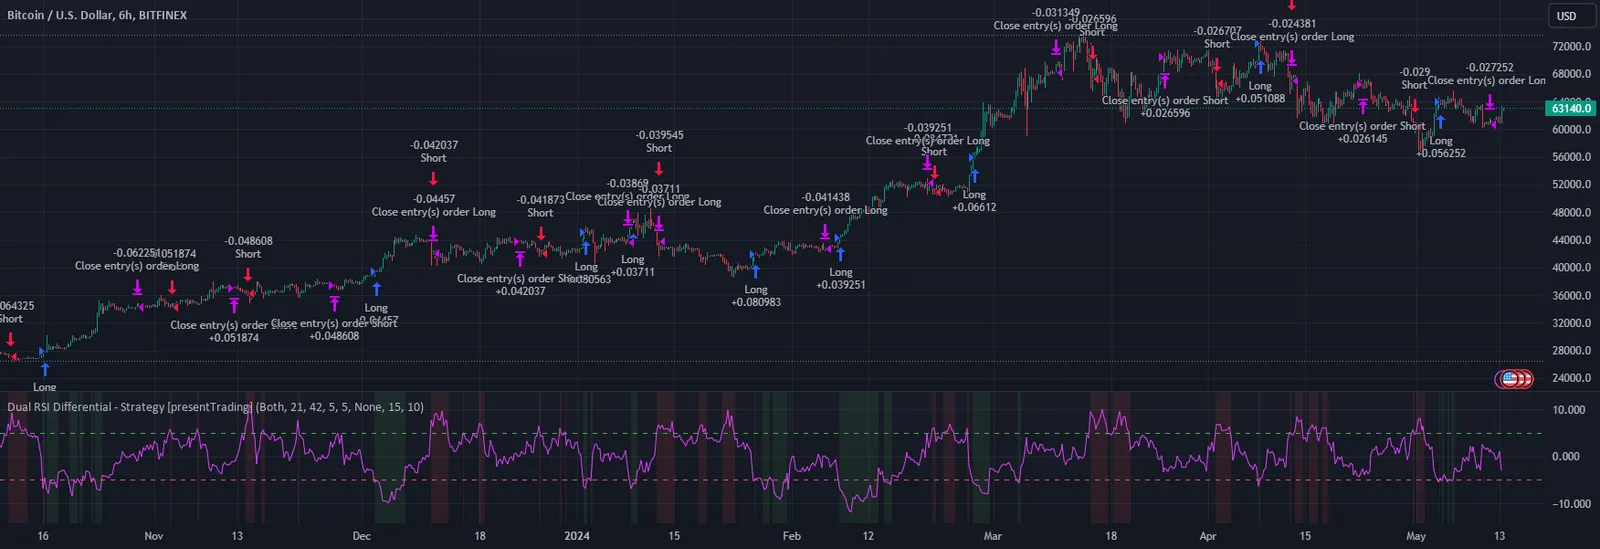
This system does not trade a single RSI against overbought or oversold bands. It compares two RSI lengths. In the source the spread is the longer RSI minus the shorter RSI. When the short RSI is clearly stronger and the spread falls through the negative threshold, it goes long. When the short RSI is clearly weaker and the spread rises through the positive threshold, it goes short. That is momentum in the RSI spread, not a classic 30/70 mean-reversion rule.
A 5-day holding window is on by default: the trade exits when that time is up, or sooner if the spread hits the opposite threshold. The stop and take-profit option defaults to None. The script uses overlay = false, so the main plot is the spread, not candles. A few labels on the page and in the source still mention RSI 7/35 or ±20, which does not match the default inputs of 21/42 and a threshold of 5. The sections below follow the inputs. The script is Pine Script v5 strategy() code.
Indicators
- Short RSI: ta.rsi(close, lengthShort), default 21.
- Long RSI: ta.rsi(close, lengthLong), default 42.
- Spread rsiDifference = rsiLong − rsiShort. The threshold is rsiDiffLevel, default 5.
- Long condition: spread < −threshold (the short RSI is at least the threshold above the long RSI). Short condition: spread > +threshold.
- Long exit: spread > +threshold. Short exit: spread < −threshold. The same symmetric levels unwind the other side.
- The hline titles say Level +20 / Level -20, the plot title says RSI Difference (35-7), and the alert text mentions RSI7 and RSI35. Those are labels only; they do not change the default inputs of 21, 42 and 5.
Entry rules
- Long, short or both, controlled by Trading Direction (default Both).
- Long: when combinedLongCondition is true, strategy.entry("Long") and store longEntryTime.
- Short: when combinedShortCondition is true, strategy.entry("Short") and store shortEntryTime.
- Default size is 10% of equity, with 0.1% commission, slippage 1 and initial capital 10,000.
- The entry call can fire again on every bar while the condition stays true. Watch the fill log if the tester allows pyramiding or repeat orders.
Exits and position sizing
- Use Hold Days defaults to true and Hold Days to 5. When that switch is on, strategy.close runs if current time minus entry time is at least five days, or if the spread reaches the opposite threshold.
- If you turn the holding window off, the script closes only when the spread hits the opposite threshold.
- TPSL Condition defaults to None, so strategy.exit stops and targets are not placed by default.
- If you set TPSL to TP, SL or Both, the source writes profit/loss (tick-style arguments) and limit/stop (price arguments) from the current close, and it recalculates them every bar. That is not the usual “percent from entry” stop. Check actual exit prices in the tester before relying on it.
- There is no trailing stop. The default path is the holding window or a spread reversal.
Inputs (source defaults)
| Input | Default | Purpose |
|---|---|---|
| Trading Direction | Both | Long only, short only, or both |
| Short RSI Period | 21 | Shorter RSI (the label’s 7 is not the default) |
| Long RSI Period | 42 | Longer RSI (the label’s 35 is not the default) |
| RSI Difference Level | 5 | Spread threshold (hline titles still say ±20) |
| Use Hold Days / Hold Days | true / 5 | Default time exit; max input is 20 days |
| TPSL Condition | None | Optional stop/target; off by default |
| Take Profit (%) / Stop Loss (%) | 15.0 / 10.0 | Used only if TPSL is enabled |
| default_qty_value | 10 | 10% of equity per entry |
Things to know before using it
- The publication frames this as a finer way to trade overbought and oversold conditions, but the source has no 30/70 RSI bands. It only compares the spread between two RSI lengths.
- The 7, 35 and ±20 figures in labels and alerts do not match the default inputs. Trust the input fields, not the label text.
- The script plots in a separate pane. Open the Strategy Tester as well so you can line signals up with the price chart.
- The default five-day hold uses 5 × 86,400,000 milliseconds of calendar time, not a bar count. On a 6-hour chart that is about 20 bars; on other intervals the number of bars changes while the day count stays the same.
- The author chart is Bitfinex BTCUSD on 6 hours. Backtest other symbols or intervals on their own, and consider retuning both RSI lengths and the spread threshold.
Installing it on TradingView
- Download the .pine file from Coinpred (active membership required, see below), or check the original page for the latest version.
- Open the Pine Editor on TradingView, create a blank script, paste the full source and save.
- Click Add to chart; start with BTCUSD 6-hour so you can compare with the author image, and open the Strategy Tester.
- Confirm the holding window and trade direction first. Only enable TPSL after you have checked exit prices in the tester.
- Study the spread signals and fills before setting alerts. Past results do not guarantee future returns.
About backtest figures
Source, license and version
- Author: PresentTrading. Original title: Dual RSI Differential - Strategy [presentTrading]. Version 1.0 (pine-facade).
- License: Mozilla Public License 2.0 (MPL 2.0). Coinpred provides the full, unmodified source.
- Original page: https://www.tradingview.com/script/VHbRaeUe-Dual-RSI-Differential-Strategy-presentTrading/
- Pine version: v5; script type: strategy().
- Images come from the author’s publication page, are not covered by the MPL, and are captioned “Author chart”.
- Downloads are subject to Coinpred membership terms. If you modify the source file, the modified file must remain under MPL 2.0.