Bounded decisions
Five predefined directions make results consistent to display and evaluate.
Get a clearer view of Bitcoin and Ethereum markets. JEV combines live prices, order books, recent trades and technical indicators to assess market direction and explain the evidence.
Collect 200 historical candles, volume and live prices.
JEV is TypeSafe AI’s System One model. Given context and predefined questions, it returns typed choices, scores and probabilities. TypeSafe describes its training approach as Reinforcement Learning for Calibrated Decisions (RLCD). [1]
Five predefined directions make results consistent to display and evaluate.
Probabilities and confidence help reveal whether a view is clearly favored.
Code computes indicators; JEV evaluates the supplied evidence against defined criteria.
This is our product design rationale: organize multiple technical signals into a reviewable directional view. Inputs currently describe spot markets. A candle interval is a data resolution, not a contract expiry. The request does not bind a specific contract strike, settlement rule or payout, so its output is technical context.
JEV does not generate free-form reports. The application organizes evidence and maps selected actions to predefined guidance; these are not the model’s internal reasoning. [3]
The official guide describes confidence as a 0–1 statistic derived from the Choice or Score probability distribution. Concentrated distributions indicate clearer decisions. The guide does not disclose the exact formula; neither entropy nor the largest probability should be presented as that formula. [2]
We display the direction answer’s confidence × 100%, or “—” when absent. Confidence in a separate score answer and the largest directional probability are different quantities.
Fast-moving BTC and ETH markets demand attention to trend, momentum and buying and selling pressure. We integrate JEV into a technical analysis workflow that combines candles, volume, depth and recent trades in one assessment. Five directional categories, probabilities and confidence make it easier to see whether signals align and focus your attention on timing and decisions.
Official limitations include numerical precision and complex indirection. Compute indicators in code and define precise classification criteria. [3]
Fix prediction times, expiry rules and settlement prices, then evaluate out of sample against baselines, calibration curves and Brier scores, including costs and payouts. Such results are not yet reported here.
Directional confidence describes certainty in a classification. An 80% value does not establish an 80% contract win probability or historical win rate.
Order book on the left, latest executions on the right. Both update with the WEEX feed.
Market structure, momentum & volatility — synthesized in one view.
Both plans include Downloadable TradingView strategies and illustrated tutorials, plus Kronos financial prediction, event-contract JEV AI predictions, signal subscription, transparent win rate, timely response, and open-source algorithms.
One-time payment. No auto-renewal.
5,000 analysis credits · 37 days
One-time payment for 455 days of access
50,000 analysis credits · 455 days
Explore TradingView strategies & guides →
Each purchase includes 5,000 analysis credits and 37 days of access. Renew before your subscription expires to add credits and extend your access. Any unused credits expire when your subscription ends.
Each purchase includes 50,000 analysis credits and 455 days of access. Renewing an active subscription adds credits to your balance and extends your access.
Sign in, choose a plan and pay with USDT on Arbitrum One. Access activates after payment confirmation and settlement.
Claim a free JEV analysis credit each day to explore market direction, confidence and supporting data.
Bitcoin and Ethereum, with multiple chart timeframes, live order books, recent trades and technical indicators.
Data comes from Binance / WEEX feeds. Analysis is produced by the Kronos prediction model and event-contract JEV AI model; indicators lag and results are reference only, not investment advice.
The library provides BTC and ETH indicator logic, parameters, illustrations and installation guides. Details are public. Active monthly or annual members can download published ZIP packages with complete Pine Script source, Chinese and English guides, and provenance and license notes.
No. Downloads require active membership and are separate from JEV and Kronos analysis credits. Expired membership does not grant download access. Coinpred membership does not include a paid TradingView plan.
Extract the ZIP and read the guide and license. Open or paste the .pine source in TradingView Pine Editor, save and add to chart. Check the market, interval, parameters, fees and slippage, then inspect historical behavior and paper test. Images do not establish realized returns; see each guide for unverified checks.
Direction and settlement status come from the public review data, cached for about 15 seconds.
Loading recent signals…
Daily candles (1D). If today is unavailable, the latest chart is shown. Images and forecast data are retained for 7 days.
Explore illustrated BTC and ETH strategy guides, indicators and setup tutorials. Published scripts are included with monthly and annual memberships, without using analysis credits.
Explore cryptocurrency strategies with clear rules and complete source code. Browse by asset, indicator or trading style, then read how entries and exits work and what has been tested before you download.
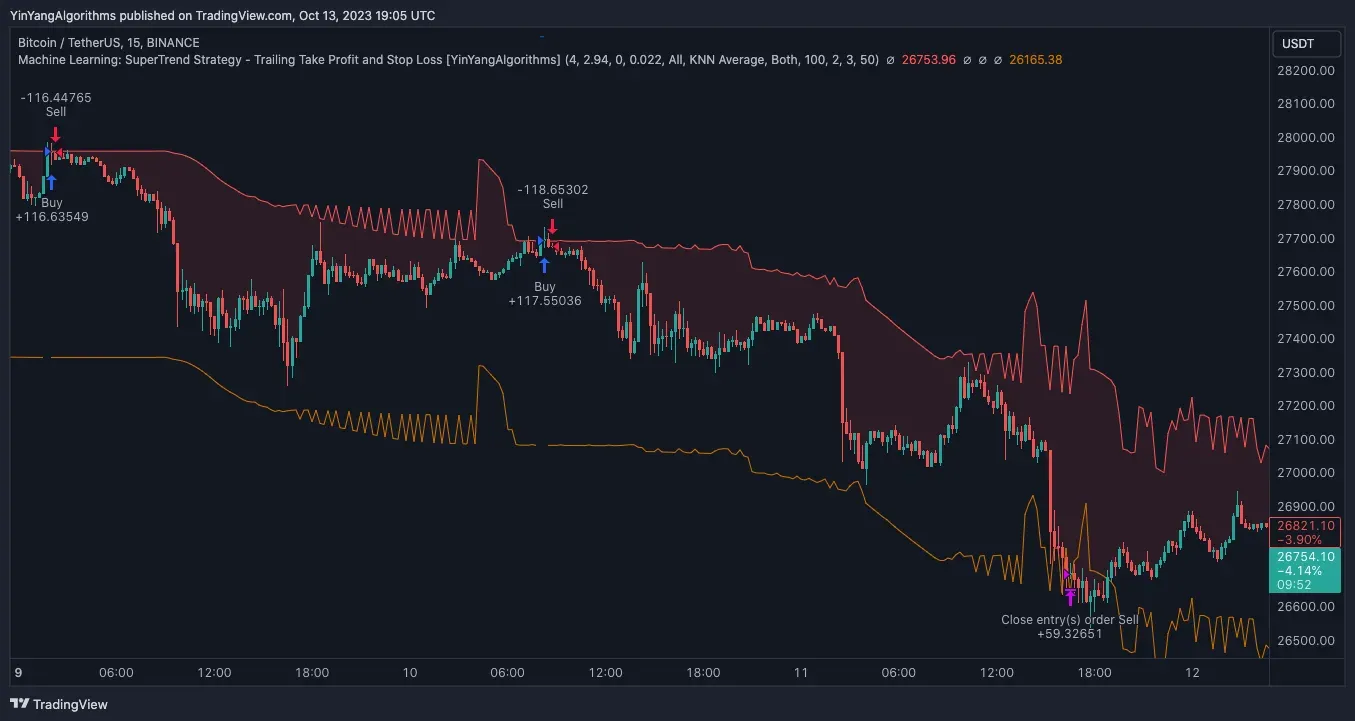 Included with membership
An open-source Bitcoin TradingView strategy by YinYangAlgorithms (Pine Script v5, MPL 2.0). It adds Rational Quadratic kernel smoothing and a KNN-style historical filter to the ATR SuperTrend, with a 2.2% trailing take profit, a stop buffer and long/short trading. We walk through the source logic, entry and exit rules, every default input, limitations and a Pine Script setup guide, with no unverified backtest figures.
 Included with membership
Open-source (MPL 2.0) YinYangAlgorithms RSI+volume purchase-zone strategy: entries/exits, defaults, author BTCUSDT 15m charts, and setup steps. No invented backtest stats.
 Included with membership
Skyrexio open-source (MPL 2.0) Bollinger enhancement: long-only rules, ATR risk, defaults, author BTCUSDT 4h chart, setup. No invented performance.
 Included with membership
KivancOzbilgic open-source (MPL 2.0) MACD Reloaded: selectable MA families, hist zero-line flips, defaults, author BTCUSDT daily chart. No invented backtests.
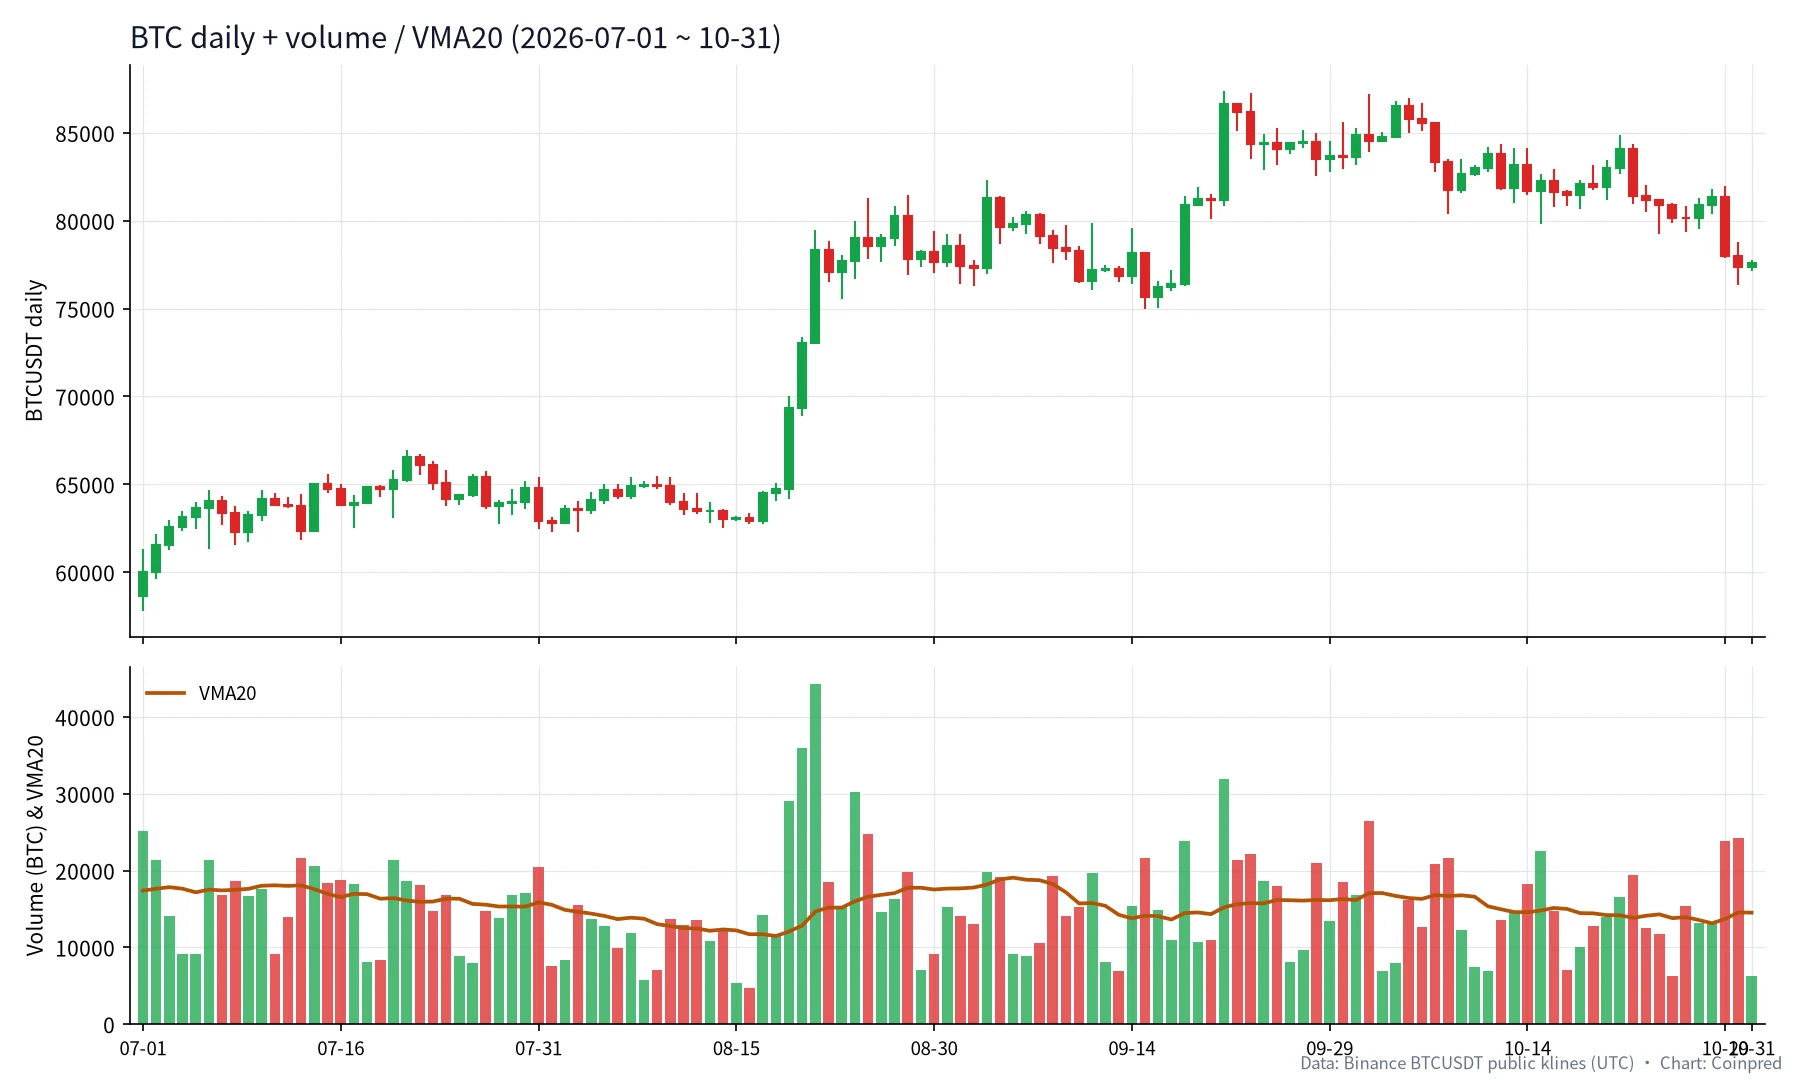 GUIDE
Volume asks whether a move had real participation. This guide uses Binance BTCUSDT public daily candles to revisit the Aug 19–21 high-volume breakout, the quieter pullback that followed, OBV, and October sell pressure—plus a five-step reading habit.
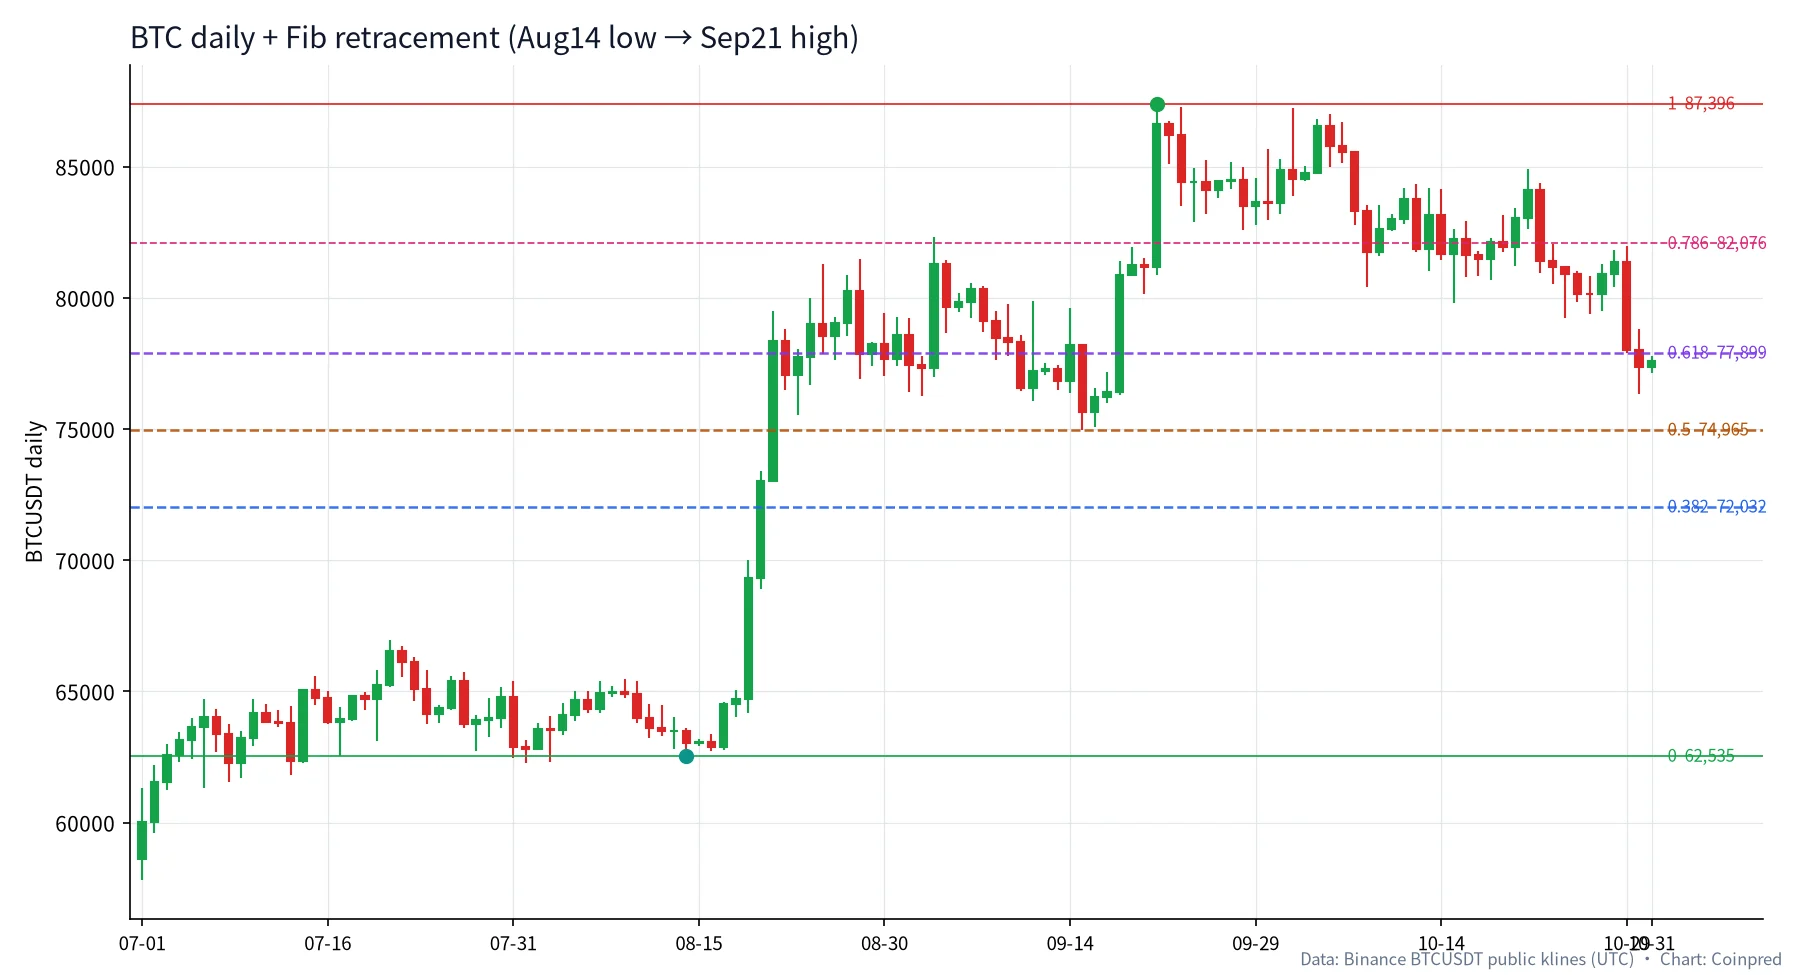 GUIDE
Fibonacci retracement slices a completed swing by fixed ratios. This guide uses Binance BTCUSDT public dailies from the 14 Aug swing low to the 21 Sep swing high, revisits the 15 Sep low hugging the 0.5 level, and demonstrates downswing Fibs plus extensions.
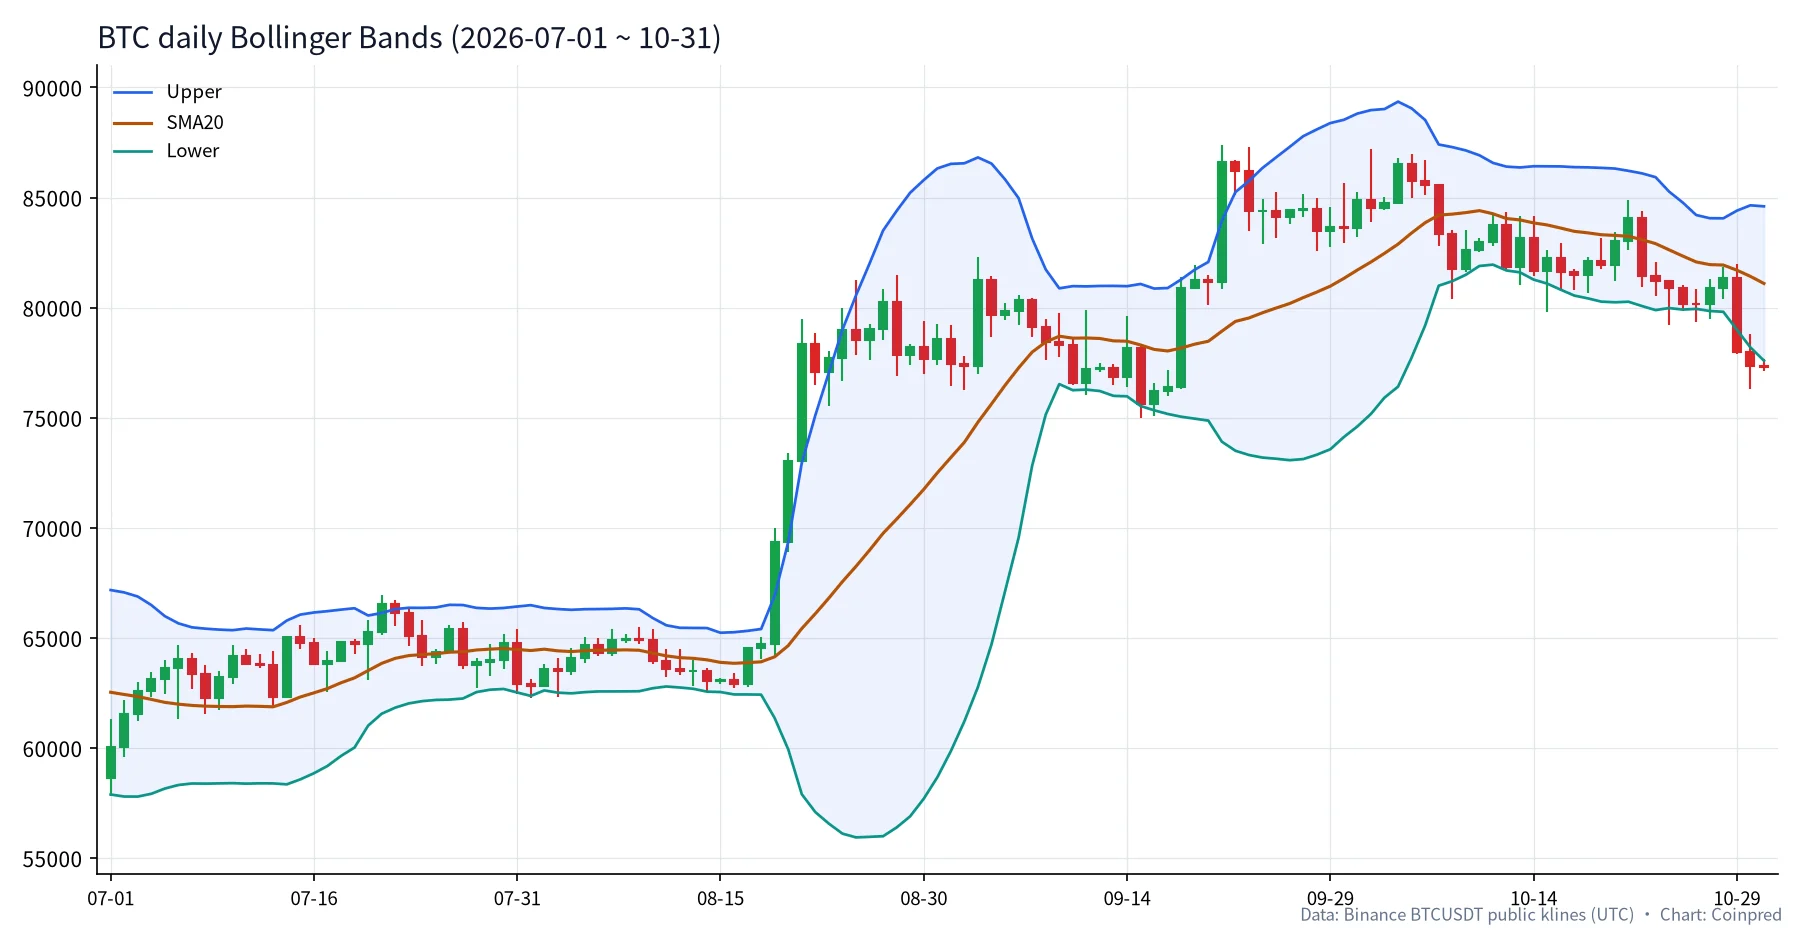 GUIDE
Bollinger Bands plot a volatility channel around a 20-day average ± two standard deviations. Using public Binance BTCUSDT daily candles, we walk through the mid-August 2026 squeeze near 4.2% bandwidth, the upper-band walk that followed, the expansion toward ~40%, and October’s lower-band failure — plus a five-step reading habit.
 GUIDE
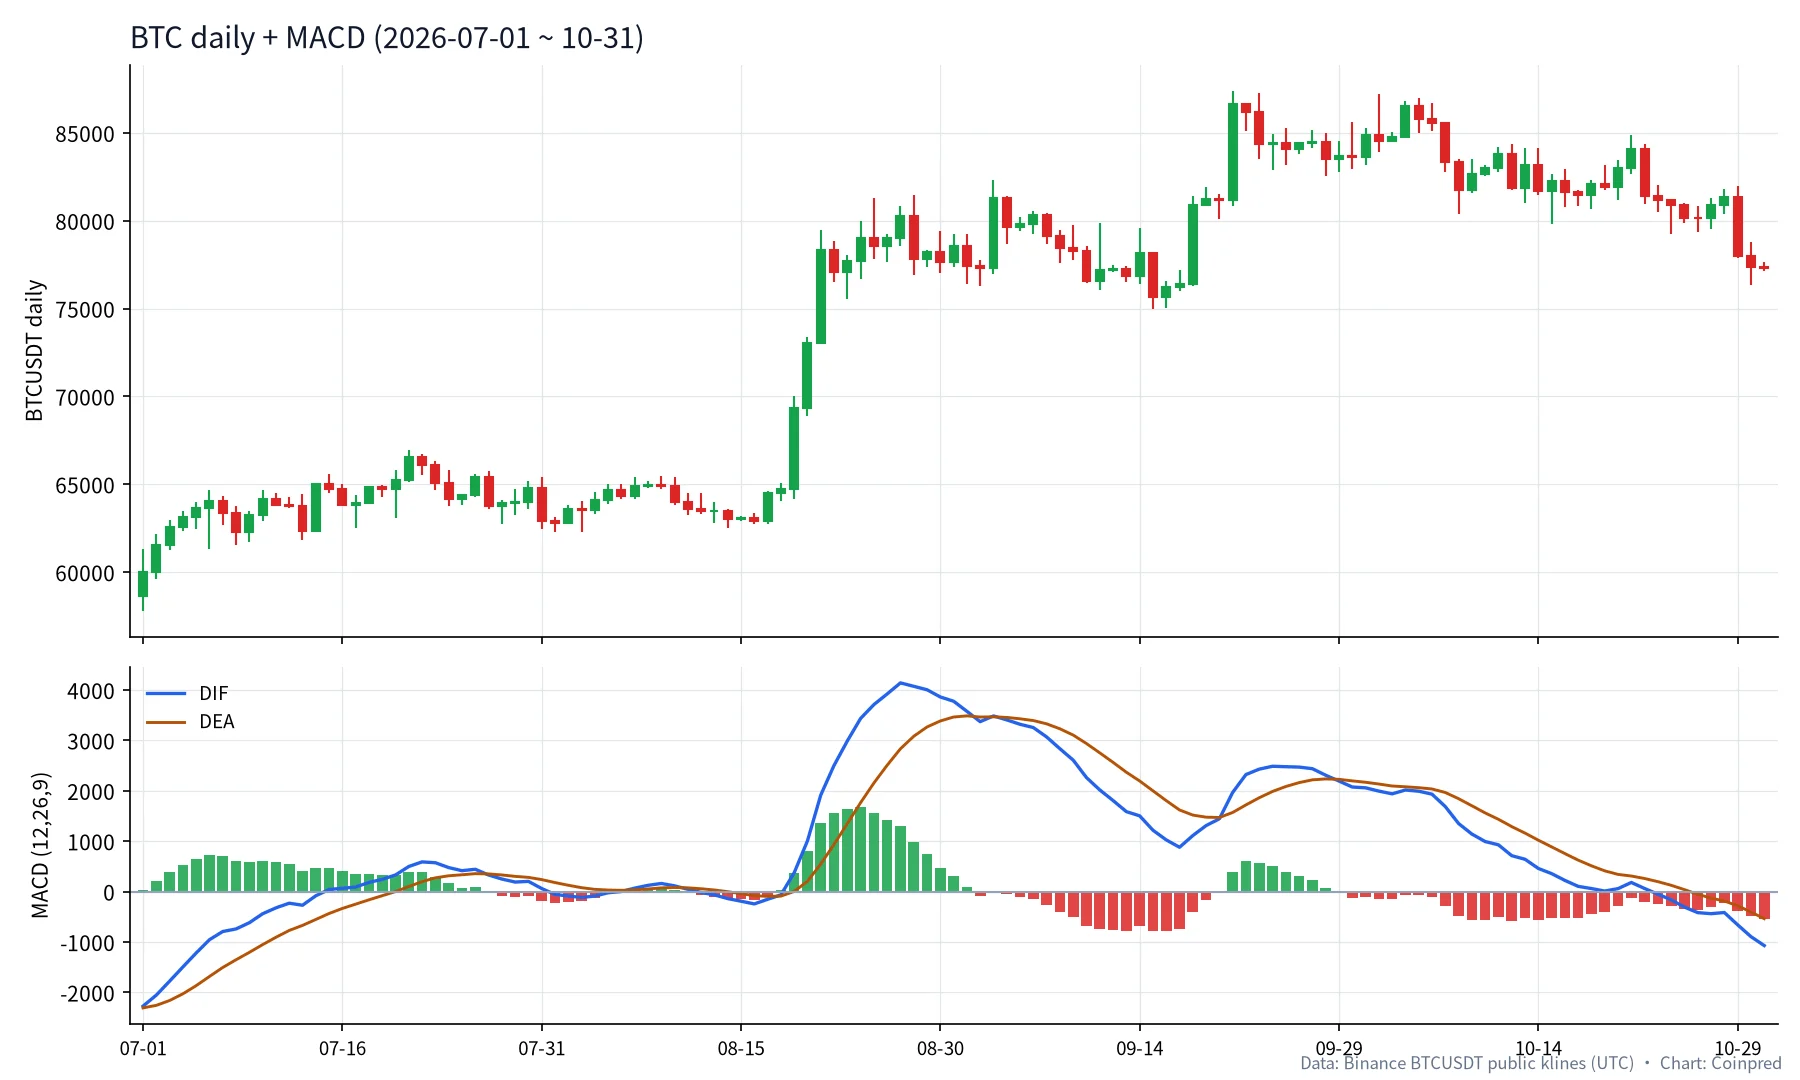
MACD compresses the gap between two EMAs into DIF, DEA and a histogram. Using public Binance BTCUSDT daily candles, we walk through the August 2026 golden cross and zero-line cross, an Aug–Sep bearish divergence, and October’s break below zero — plus a five-step reading habit.
Review BTC and ETH TradingView strategy signals with direction, entry price, settlement price and final outcome.