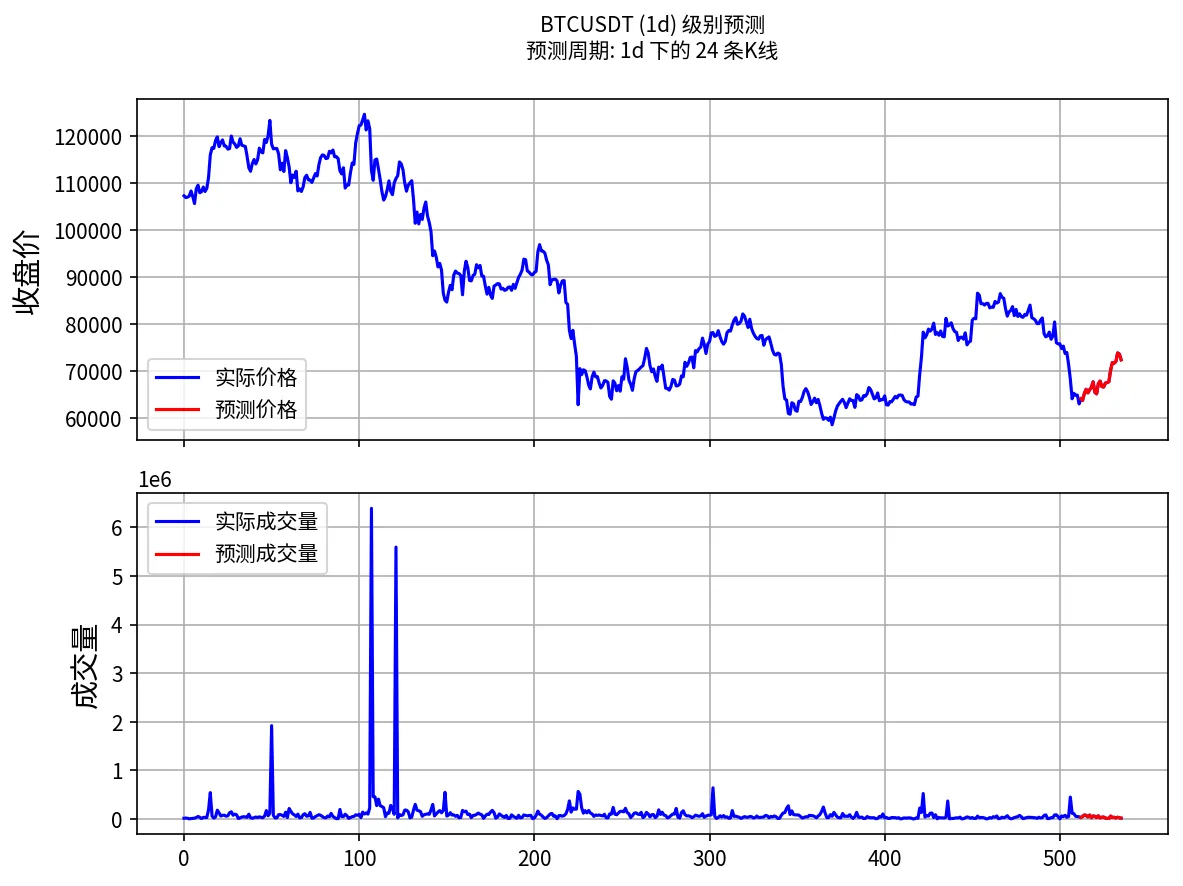
Gray: historical closes · Green dashed: forecasts · Orange: observed closed candlesView original Kronos forecast imageForecast OHLC and observed results
Target days use UTC; actual values include closed candles only
Target day
Forecast open
Forecast high
Forecast low
Forecast close
Actual close
Close error
2026-11-19
64,105.2344
65,279.1719
63,194.8086
64,169.9531
61,959
3.5684%
2026-11-20
64,977.3594
65,775.3281
62,907.6563
63,778.9063
58,914.9
8.256%
2026-11-21
61,597.3125
65,519.4766
60,680.4023
65,272.0234
Pending close/update
—
2026-11-22
64,021.8242
67,327.2344
62,855.6484
66,154.3203
Pending close/update
—
2026-11-23
67,357.7188
67,646.2422
64,461.8672
65,394.2344
Pending close/update
—
2026-11-24
66,139.1641
67,294.4922
64,744.8555
66,035.8359
Pending close/update
—
2026-11-25
66,027.5625
67,618.6484
64,900.0781
66,554.6953
Pending close/update
—
2026-11-26
67,278.5156
68,738.0469
66,505.7031
67,732.9609
Pending close/update
—
2026-11-27
67,779.0859
68,086.9141
64,943.4336
65,494.2266
Pending close/update
—
2026-11-28
65,886.7266
66,589.2813
64,490.6367
65,189.6172
Pending close/update
—
2026-11-29
66,082.6875
68,115.2656
65,610.1406
67,336.3438
Pending close/update
—
2026-11-30
67,877.1953
68,835.7344
67,181.375
67,898.6172
Pending close/update
—
2026-12-01
68,492.4297
68,593.4453
66,229.5313
66,735.7891
Pending close/update
—
2026-12-02
67,965.8594
68,214.3047
66,002.3047
66,612.6719
Pending close/update
—
2026-12-03
67,104.6172
68,510.7969
65,807.1094
67,474.1563
Pending close/update
—
2026-12-04
67,539.9063
68,726.4141
66,127.6328
67,567.625
Pending close/update
—
2026-12-05
67,720.4219
68,905.5859
66,306.3125
67,762.6875
Pending close/update
—
2026-12-06
68,999.2891
71,151.3594
68,461.4922
70,240.6484
Pending close/update
—
2026-12-07
71,053.0781
73,404.0781
62,925.4219
71,841.5391
Pending close/update
—
2026-12-08
71,802.9297
73,004.2656
68,590.8828
71,704.5469
Pending close/update
—
2026-12-09
72,007.4766
72,944.6563
71,199.6484
72,044.7656
Pending close/update
—
2026-12-10
73,068.5703
74,673.3516
72,429.6797
73,887.0781
Pending close/update
—
2026-12-11
73,873.8672
74,621.625
72,918.0391
73,616.0547
Pending close/update
—
2026-12-12
73,429
73,898.9141
71,951.1641
72,419.0469
Pending close/update
—
How to read the daily Kronos forecast archive
The green dashed line is the model forecast saved at generation time, gray shows historical closes and orange shows candles that closed afterward. Original model images are archived when available; the saved OHLC forecast data also powers the on-page chart.
The automated run uses closed WEEX daily candles. Publication dates use Asia/Shanghai, while forecast target dates use UTC. This is a forward-looking daily forecast record, not a backfilled signal history or a claim of backtested returns.
Frequently asked questions
Which forecasts are published each day?
One 1d candle forecast is generated for BTCUSDT and one for ETHUSDT. Each record preserves generation time, model, input and output; the actual candle count is shown in the record.
Is daily generation the same as a one-day horizon?
No. Daily describes publication frequency and 1d describes candle duration. One run can contain several daily candles; each target date appears in the detail table.
How long are daily forecasts and charts retained?
Forecast text, OHLC data and observed closes are kept permanently, so past dated URLs stay live; large original chart images are kept for seven days. Retained forecasts are never overwritten or backfilled.
How is the closing-price error calculated?
Close error = (forecast close − actual close) / actual close × 100%. It compares closed candles from the same WEEX market and UTC day, and is not a trading return.