BTC / ETH Daily Price Forecast, Chart and OHLC Archive | Kronos
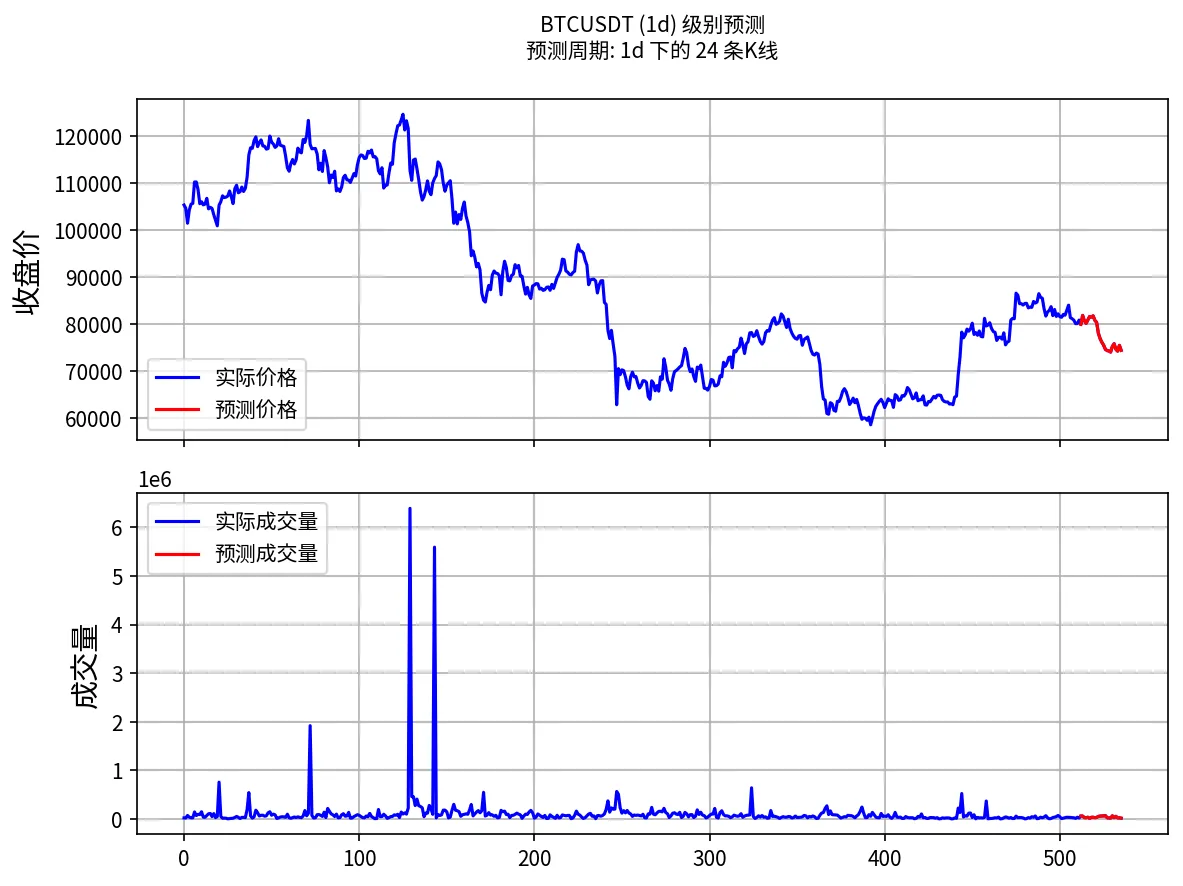
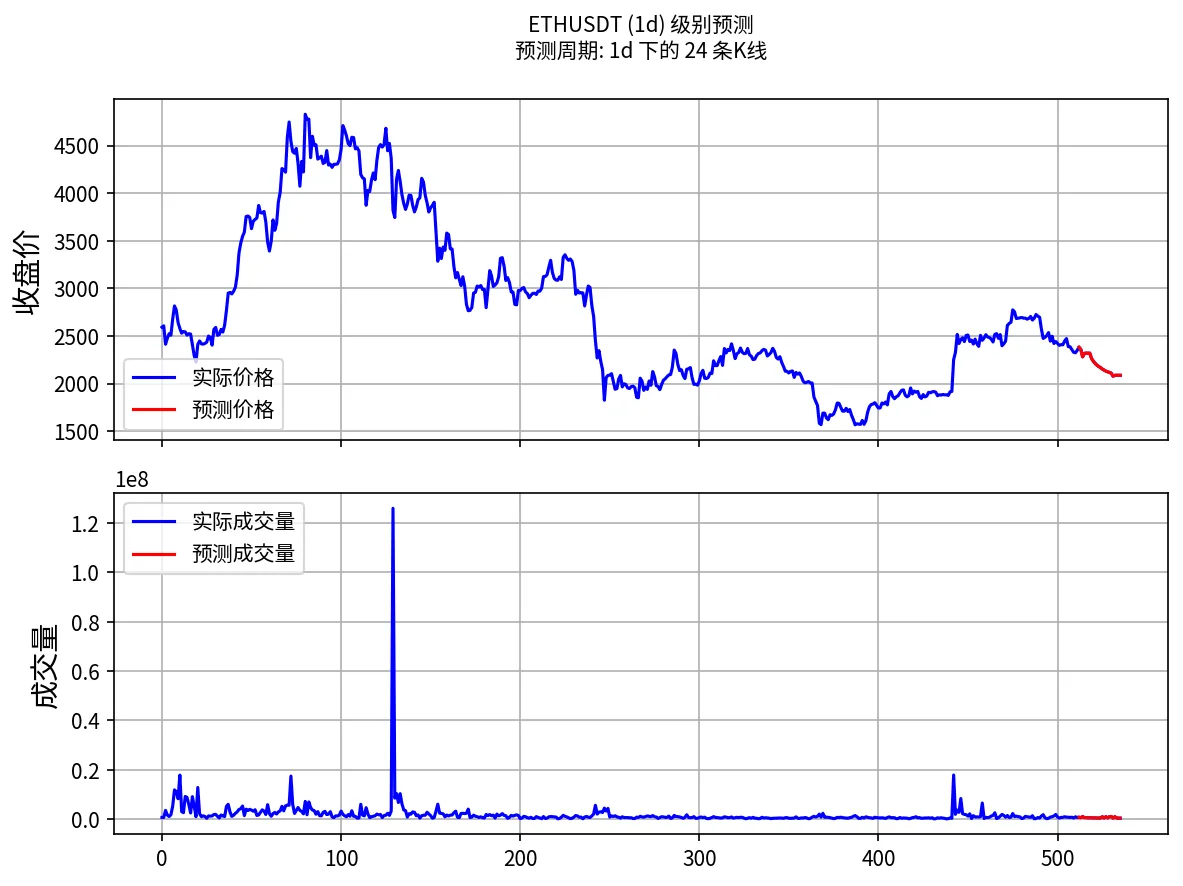
Explore daily Kronos Bitcoin and Ethereum forecasts, future OHLC candles and observed closes. Forecast data is permanently archived for historical review.
Scheduled daily at 08:10 Asia/Shanghai for BTC and ETH. Date filters use publication days in that timezone; forecast candle days use UTC.
Public access, no subscription required. The forecast text, OHLC data and observed closes are kept permanently, so past dated pages stay live; only the large original forecast images are kept for the latest seven days. Candle interval: 1D.
Gray: historical closes · Green dashed: forecasts · Orange: observed closed candlesView original Kronos forecast imageForecast OHLC and observed results
Target days use UTC; actual values include closed candles only
Target day
Forecast open
Forecast high
Forecast low
Forecast close
Actual close
Close error
2026-10-28
2,356.252
2,417.6553
2,334.2026
2,382.5681
2,358.5
1.0205%
2026-10-29
2,372.7141
2,406.6851
2,337.802
2,358.979
Pending close/update
—
2026-10-30
2,343.0161
2,363.8318
2,260.1116
2,281.2129
Pending close/update
—
2026-10-31
2,304.0522
2,353.3491
2,280.3188
2,317.001
Pending close/update
—
2026-11-01
2,324.5957
2,363.6985
2,294.0266
2,320.6729
Pending close/update
—
2026-11-02
2,323.0364
2,361.793
2,293.1394
2,319.0232
Pending close/update
—
2026-11-03
2,322.1655
2,361.0969
2,293.498
2,319.5903
Pending close/update
—
2026-11-04
2,305.8789
2,330.6868
2,248.4819
2,263.2429
Pending close/update
—
2026-11-05
2,263.3843
2,290.5979
2,218.1677
2,235.231
Pending close/update
—
2026-11-06
2,236.0383
2,264.741
2,194.7881
2,212.4834
Pending close/update
—
2026-11-07
2,213.8601
2,243.8318
2,174.9963
2,193.04
Pending close/update
—
2026-11-08
2,198.4597
2,229.0466
2,161.0466
2,179.3301
Pending close/update
—
2026-11-09
2,185.5288
2,216.468
2,149.2891
2,168.0125
Pending close/update
—
2026-11-10
2,174.1304
2,206.8354
2,126.1387
2,152.1851
Pending close/update
—
2026-11-11
2,156.6128
2,189.481
2,122.1792
2,141.9719
Pending close/update
—
2026-11-12
2,148.4346
2,183.4819
2,104.0486
2,130.6821
Pending close/update
—
2026-11-13
2,136.6436
2,169.9414
2,103.2388
2,123.0461
Pending close/update
—
2026-11-14
2,132.6064
2,167.95
2,090.4136
2,116.6597
Pending close/update
—
2026-11-15
2,123.3787
2,160.6289
2,082.2112
2,109.5776
Pending close/update
—
2026-11-16
2,083.2075
2,129.584
2,026.2385
2,077.0129
Pending close/update
—
2026-11-17
2,098.4973
2,140.1553
2,053.8293
2,086.1147
Pending close/update
—
2026-11-18
2,102.0896
2,134.5557
2,067.1516
2,087.7942
Pending close/update
—
2026-11-19
2,098.7317
2,130.9067
2,066.5974
2,086.9397
Pending close/update
—
2026-11-20
2,098.4585
2,129.592
2,067.0979
2,086.5278
Pending close/update
—
How to read the daily Kronos forecast archive
The green dashed line is the model forecast saved at generation time, gray shows historical closes and orange shows candles that closed afterward. Original model images are archived when available; the saved OHLC forecast data also powers the on-page chart.
The automated run uses closed WEEX daily candles. Publication dates use Asia/Shanghai, while forecast target dates use UTC. This is a forward-looking daily forecast record, not a backfilled signal history or a claim of backtested returns.
Frequently asked questions
Which forecasts are published each day?
One 1d candle forecast is generated for BTCUSDT and one for ETHUSDT. Each record preserves generation time, model, input and output; the actual candle count is shown in the record.
Is daily generation the same as a one-day horizon?
No. Daily describes publication frequency and 1d describes candle duration. One run can contain several daily candles; each target date appears in the detail table.
How long are daily forecasts and charts retained?
Forecast text, OHLC data and observed closes are kept permanently, so past dated URLs stay live; large original chart images are kept for seven days. Retained forecasts are never overwritten or backfilled.
How is the closing-price error calculated?
Close error = (forecast close − actual close) / actual close × 100%. It compares closed candles from the same WEEX market and UTC day, and is not a trading return.